In the last post, I mentioned that there four primary things that we have needed in order to move a large portion of our student and staff workers to full remote work during this quarantine.
In this post, I wanted to jump ahead a bit and talk a bit about how we are accounting for remote workers’ time. This is one of the things that the university wrestled with when thinking about moving students offline, how would we be able to account for time. Well, one of the ways we are trying to track time is by using the activity in the metadata editing system to help managers understand what their workers are working on.
Over the past two weeks, the Software Development Unit at the UNT Libraries has been working hard to push out quite a few changes to a system we call Events. This system has been sitting in the background of our metadata editing infrastructure for a number of years collecting what we call “Edit Events”. An Edit Event is logged in the Event system and contains information about the username, which record they edited, the timestamp for when it was edited, and how long the metadata edit window was open while they were doing metadata. This is then aggregated for users in a dashboard that they can view.
For a few years now this system has been unusable because of some code that needed to be refactored now that we have almost 2.5 million edit events. That’s what we have been working on for the past few weeks.
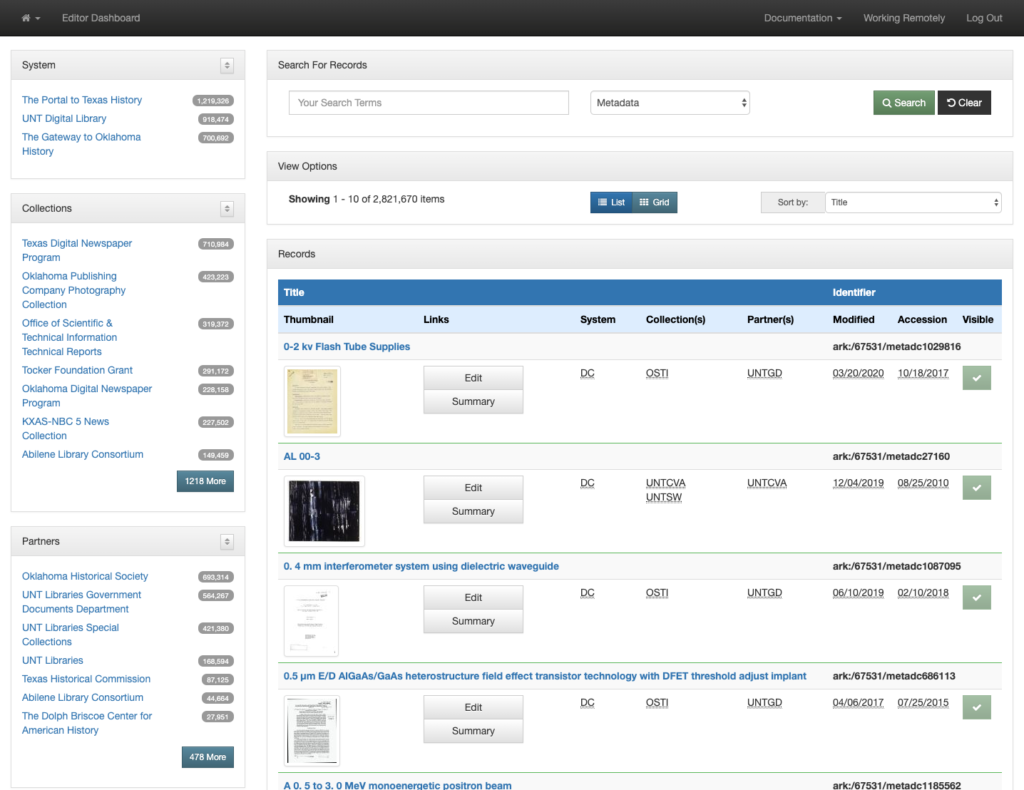
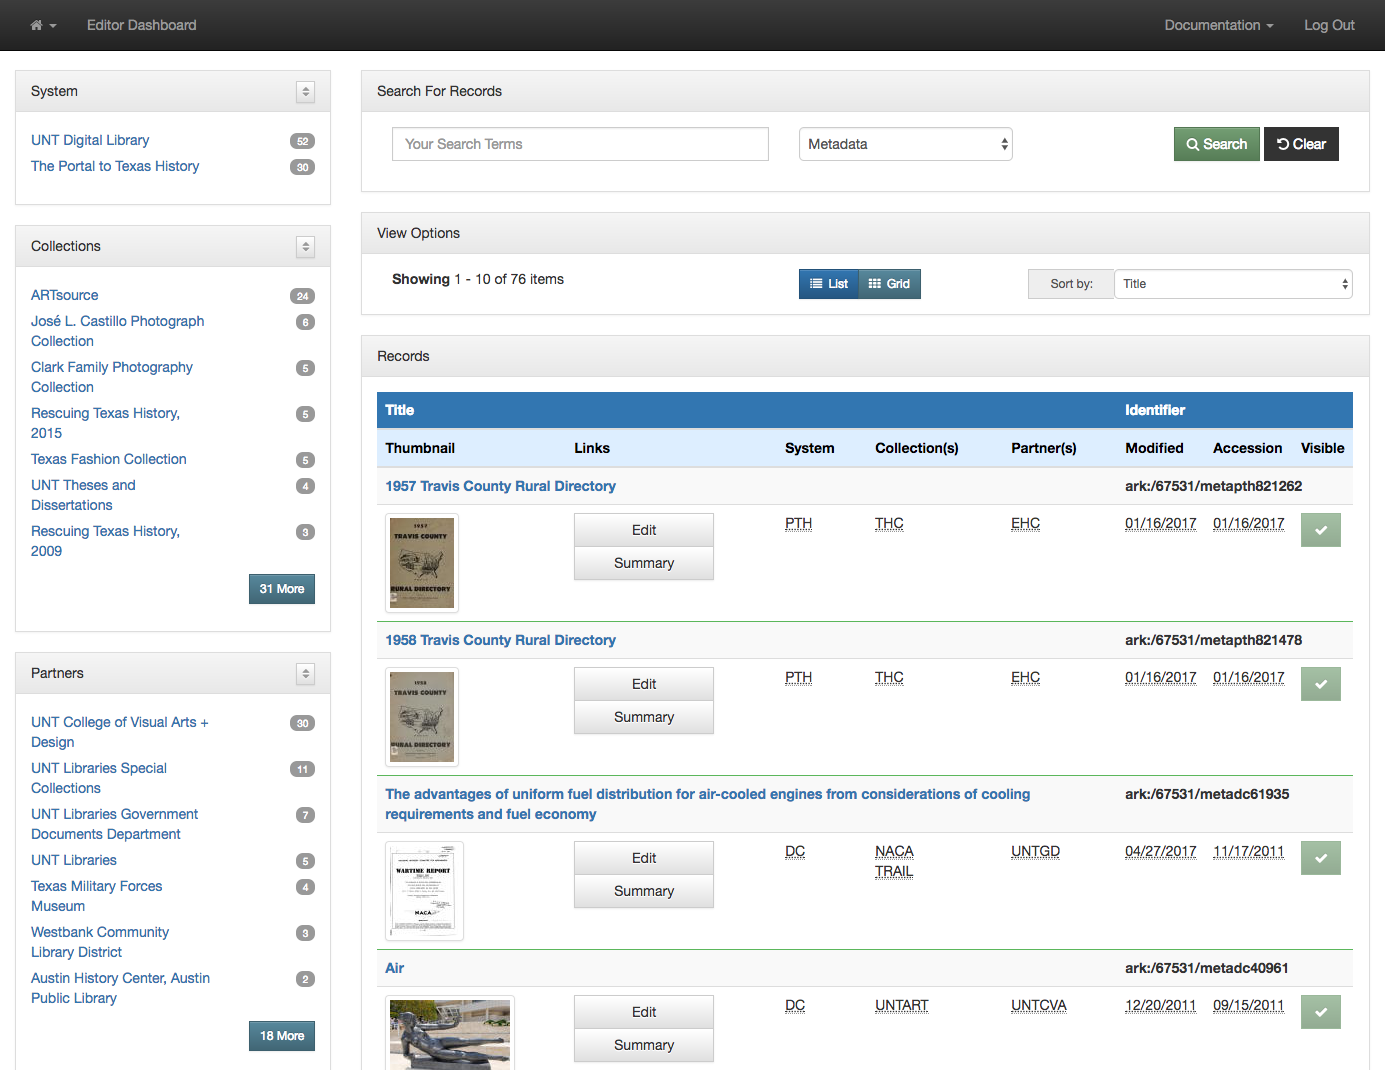
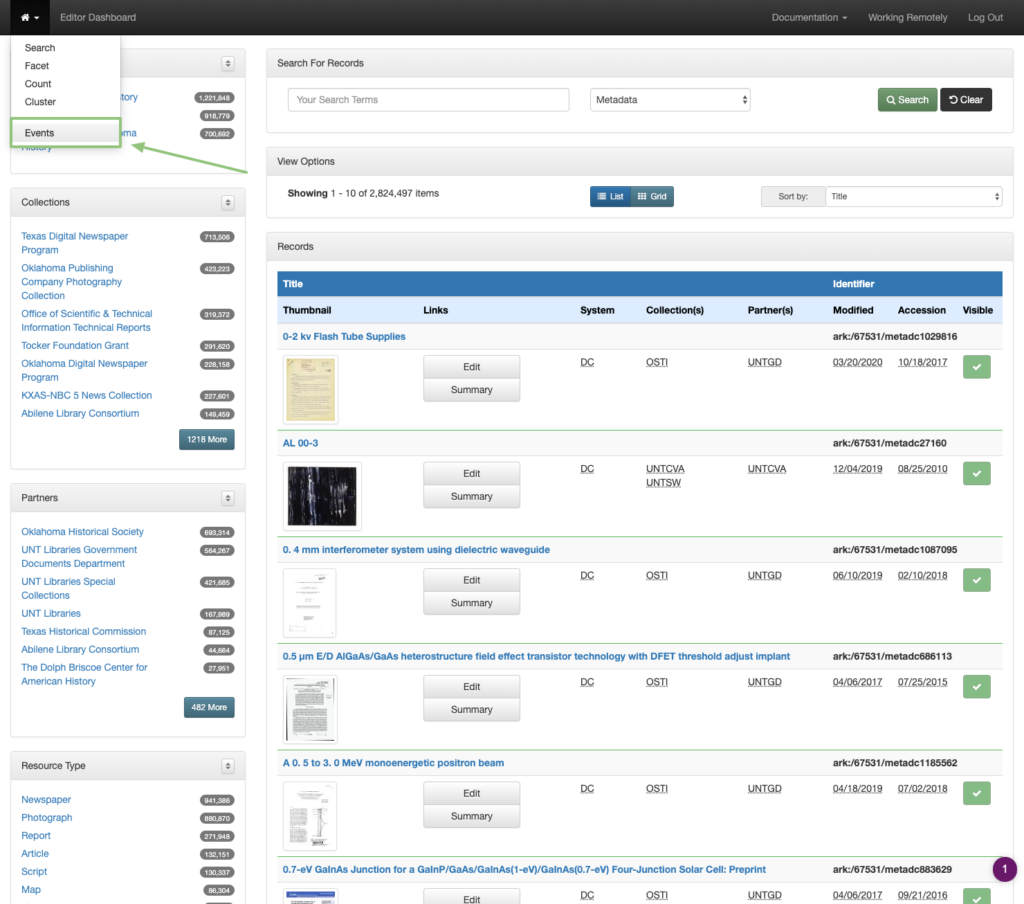
The first thing to note for users of our Edit system is “how do you get to the Events pages”. Well in the upper left corner of the screen, if you click on the “home” icon you will see an Events option in the dropdown.
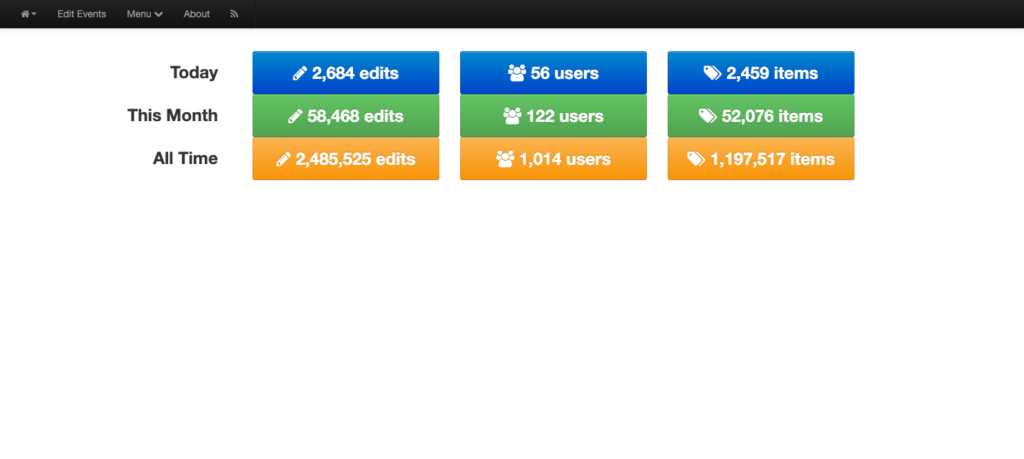
This will take you to the Events landing page, where you are greeted with an overview of what is going on with the events system. All data is divided into Today, This Month, and All Time and gives you statistics for the number of edits, the number of active users, and the number of unique items that have been edited. Clicking on the different buttons will take you to different places. I am going to walk through by clicking on any of the blue buttons for today.
By clicking on any of the Today buttons, you are presented with statistics for the Edit Events that have happened in the system today. You can get an overview of everything that has happened in the system. You can also navigate to different days by clicking on the Previous Day button.
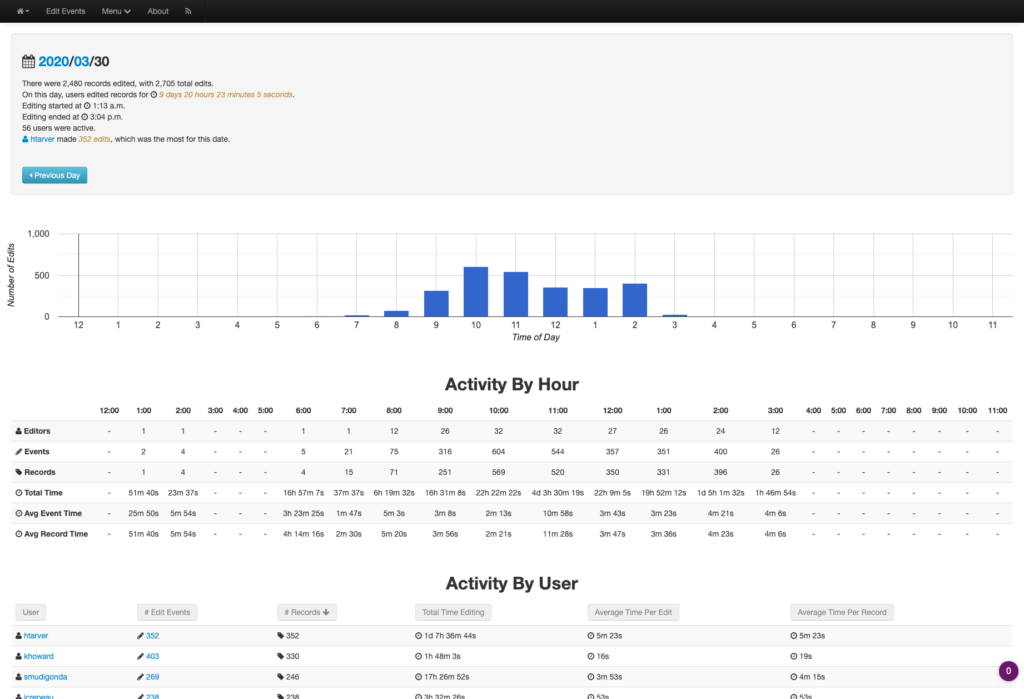
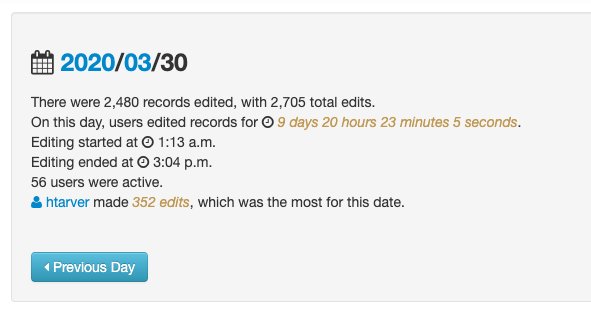
At the top of the page, you will see an overview of stats for the day. This includes the number of edits, the number of unique records edited, and how much aggregate time has been spent during the day editing. We also show the first and most recent edit, the number of users that have edited during the day, and then we list the user who has the most edits along with their edit count.
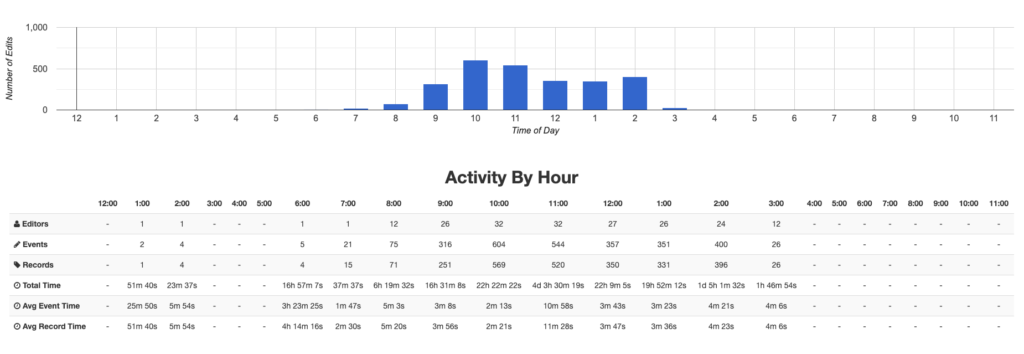
Next up is a view of the Activity By Hour section. I have been amazed to see the time of day when users are editing records. For example, on Saturday the 28th there were 35 users who edited records in 22 of the 24 hours during the day.
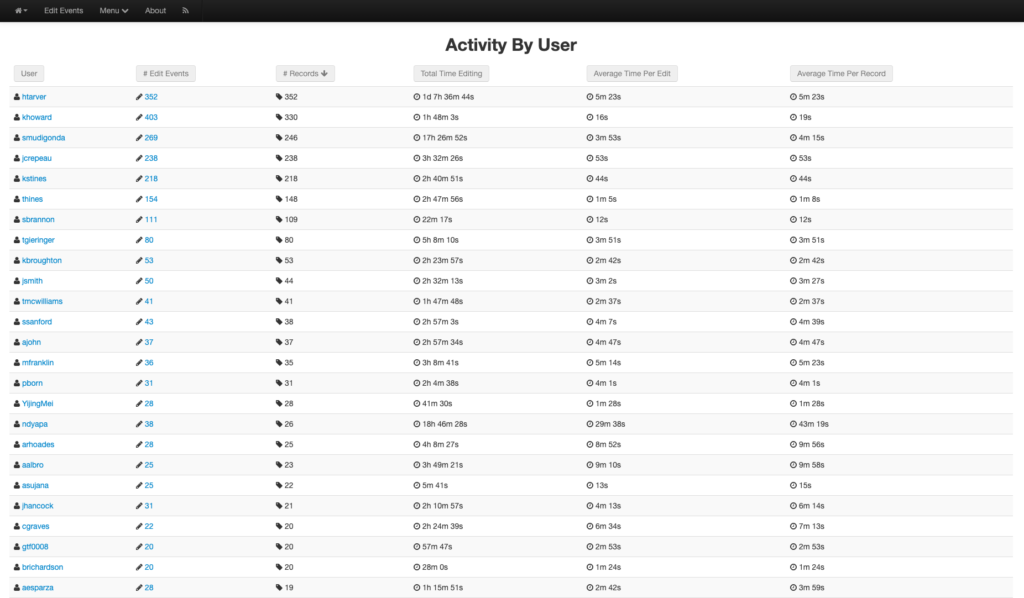
Below that block is the Activity By User for the day. You can see a listing of all of the users who have edited during the day as well as some statistics related to their activity including the number of edits, number of records, total editing duration and the average time per edit, and the average time per record. Clicking on any of the names will take you to an overview of that user’s activity.
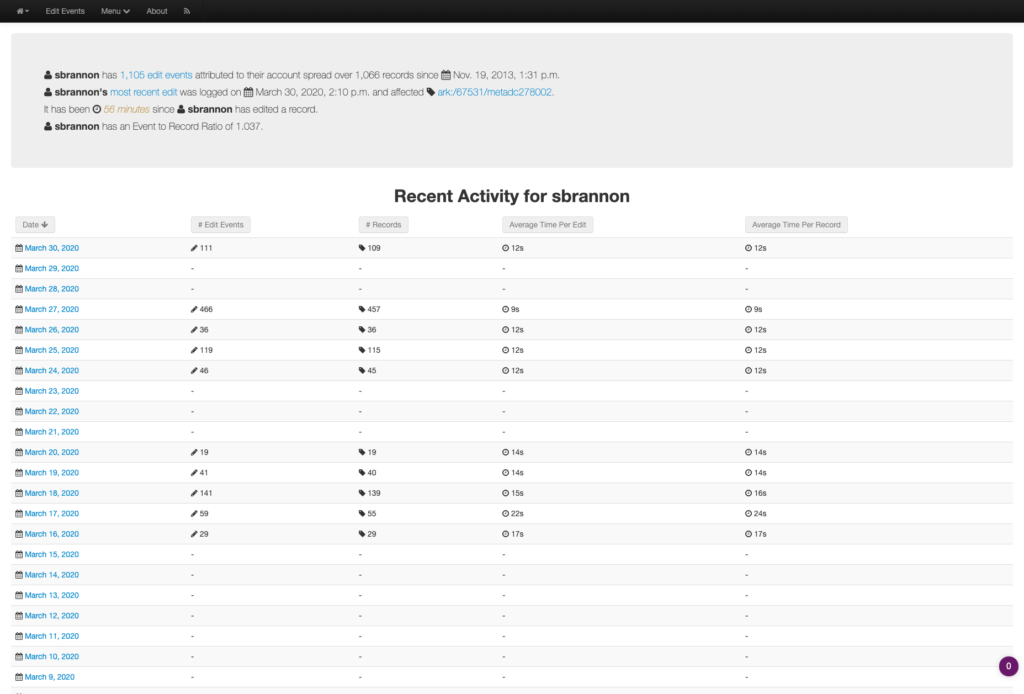
A user’s page gives information going back a little over a month so that managers can easily verify the time for pay periods that are either every two weeks or one month. In addition to an overview of all of the user’s activity in the Events system, you can see a breakdown of what days they have edited records as well as statistics about what activity they completed during that day. By clicking on the day link you can see information specific to that day for that user.
The User Hourly Detail View presents statistics for a user on a specific day. It includes similar information as the overview pages mentioned previously. There is also an hourly table that shows when the user was editing records, including how many edits, hours, duration and average time per edit and record for a given hour.
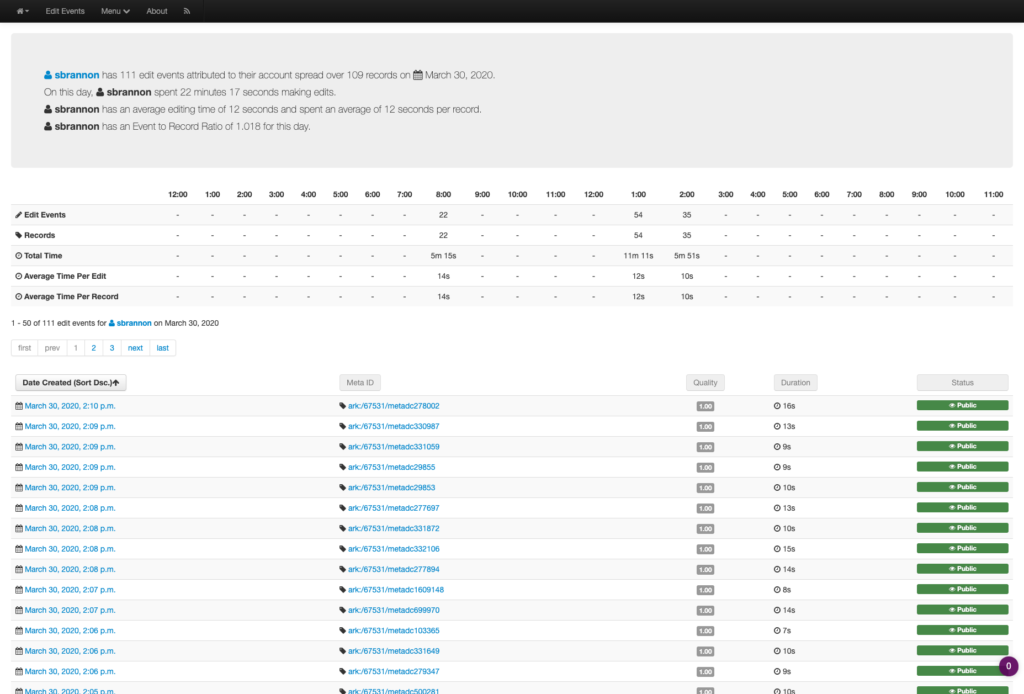
Below the hourly breakdown of activity, you see all of the edits performed by the user on that day. You can link directly to the edit event or you can view information about the record that they have edited.
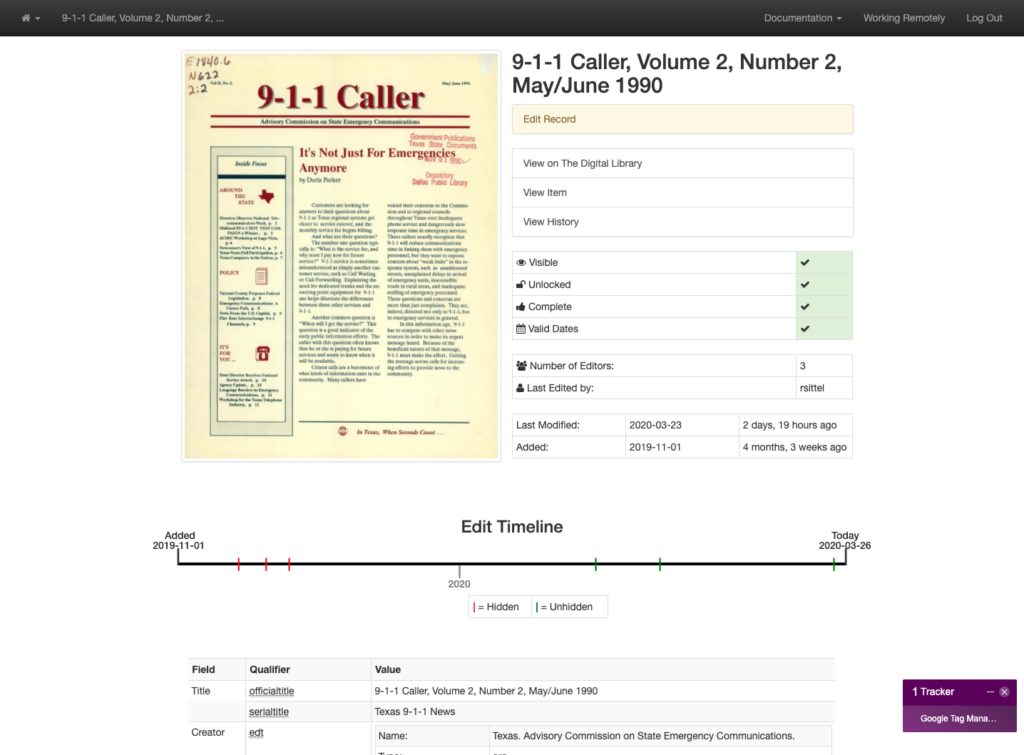
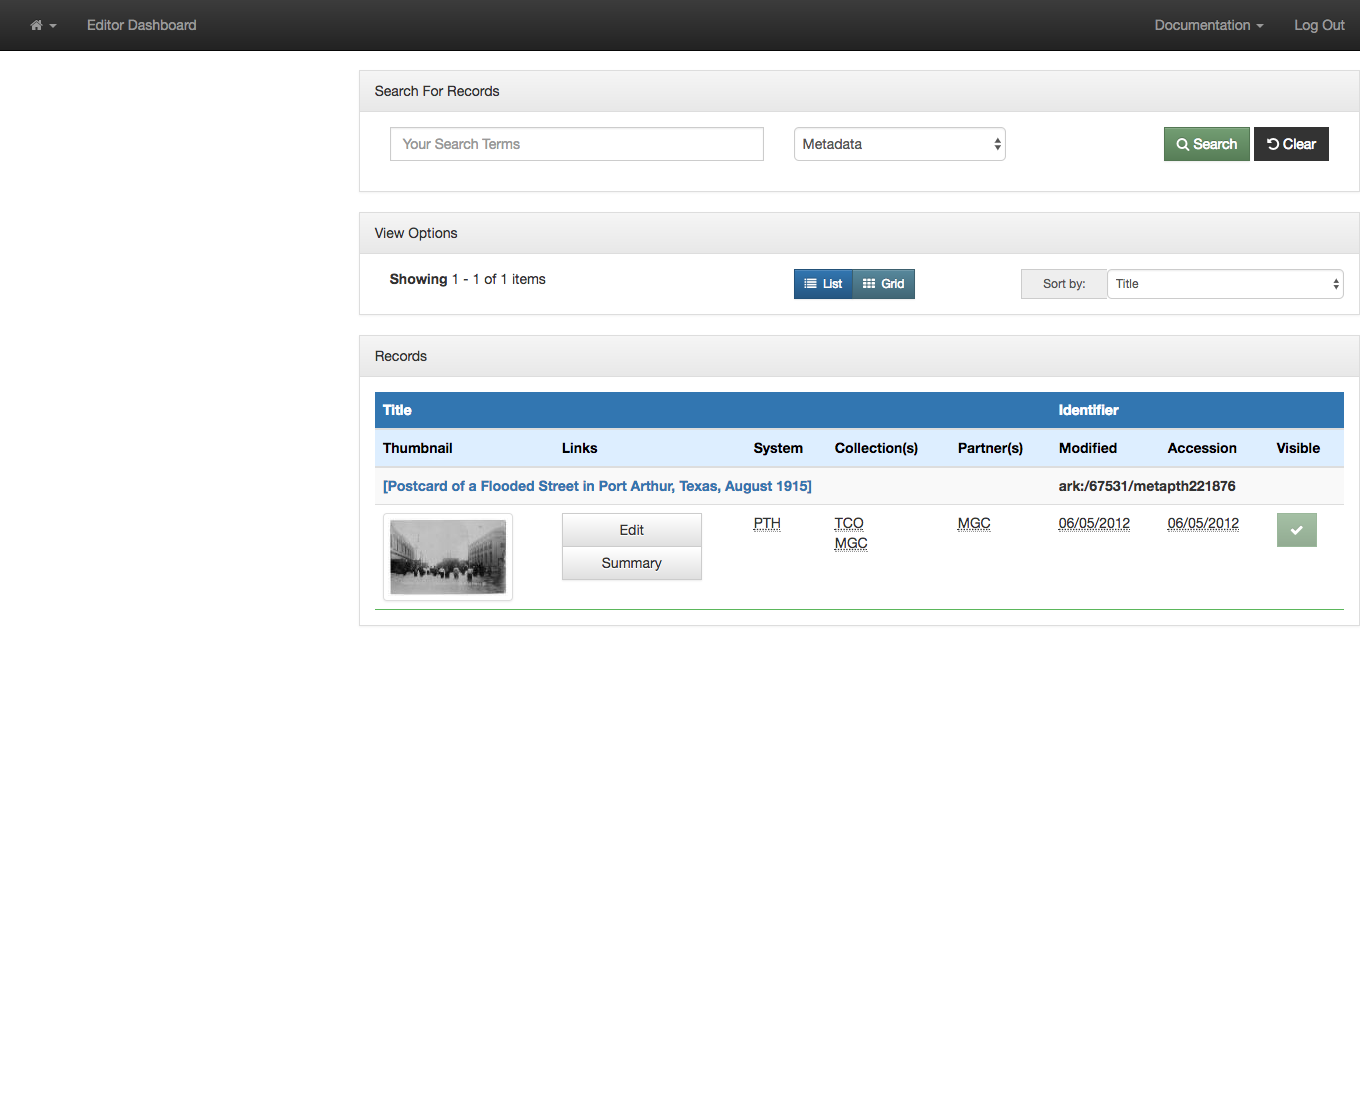
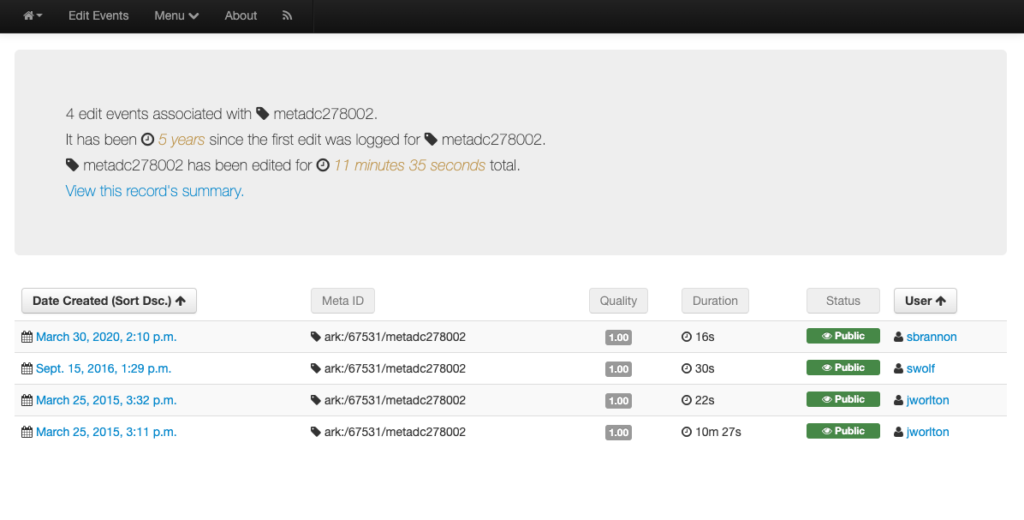
Below you will see the detail for a record in the Events system. You see how many total edits have taken place with a record including when, and which user performed the edits. There is a link on the page to view the records summary in the edit system to see more information about the record that was edited.
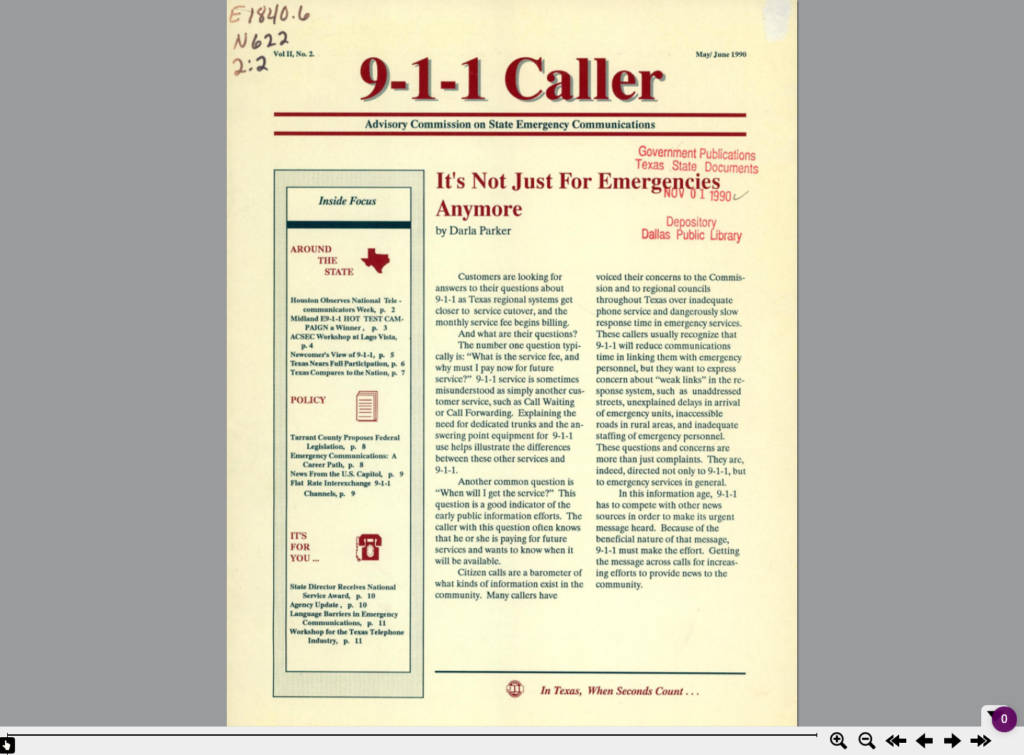
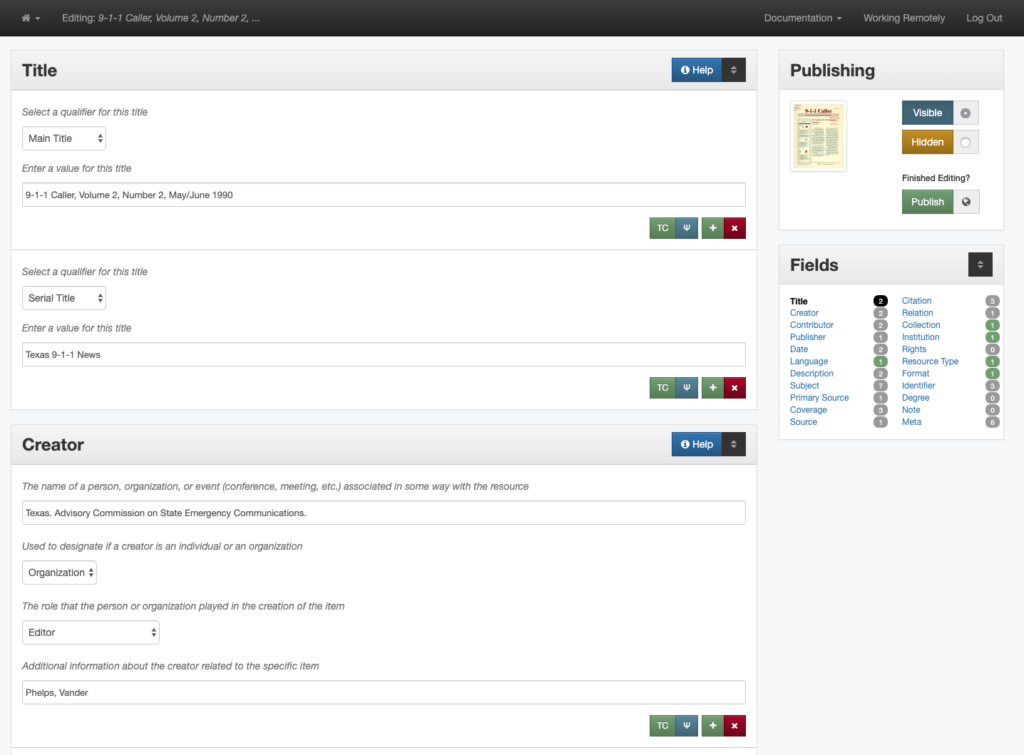
When you click on that link you are taken to the record summary page in the Edit interface.
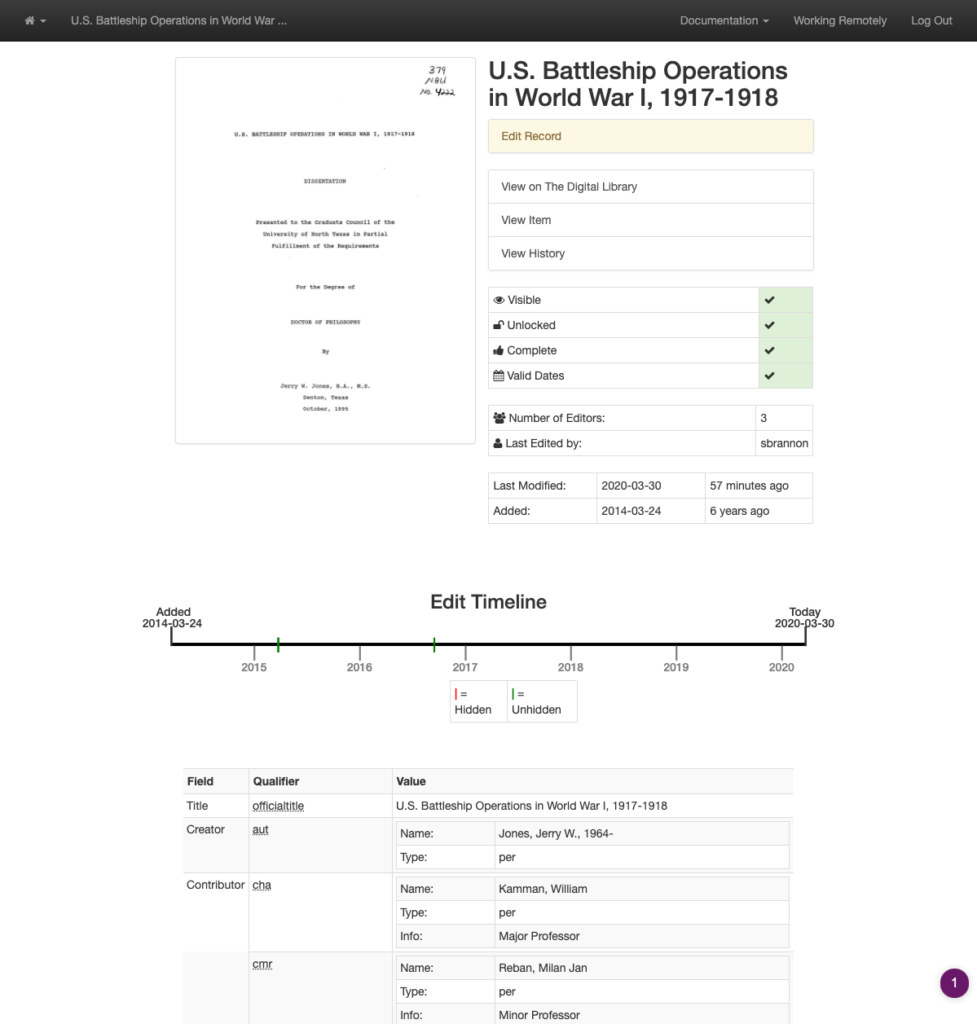
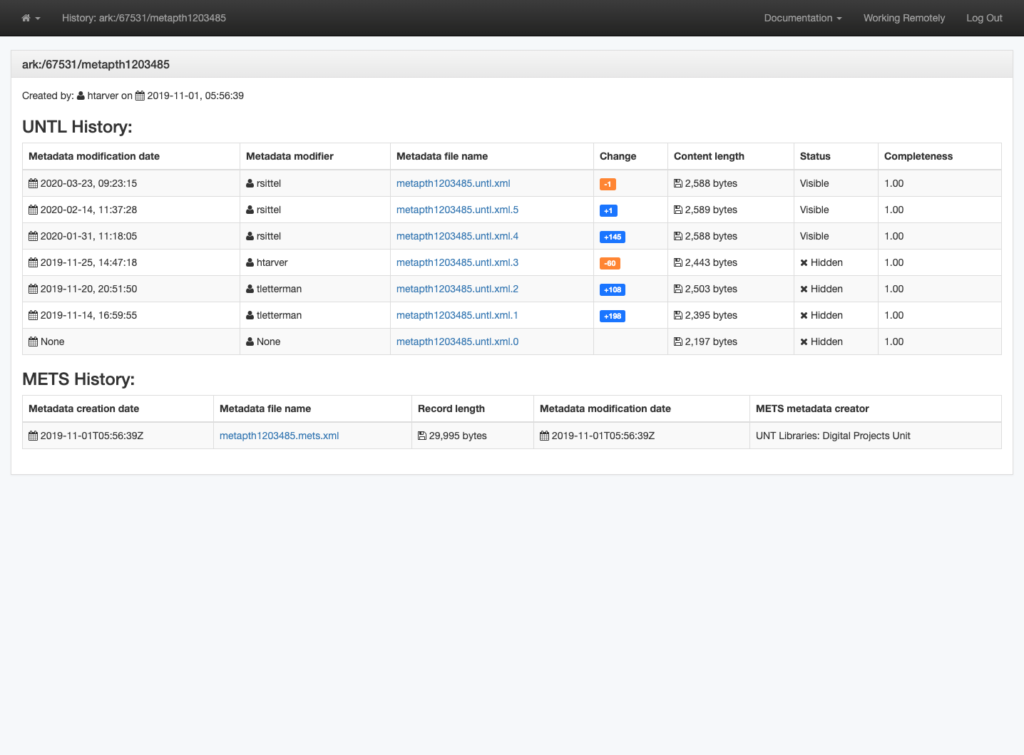
If you want to dig deeper into what happened with the record, you can click on the View History link and view different versions of the record to see what changes were made.

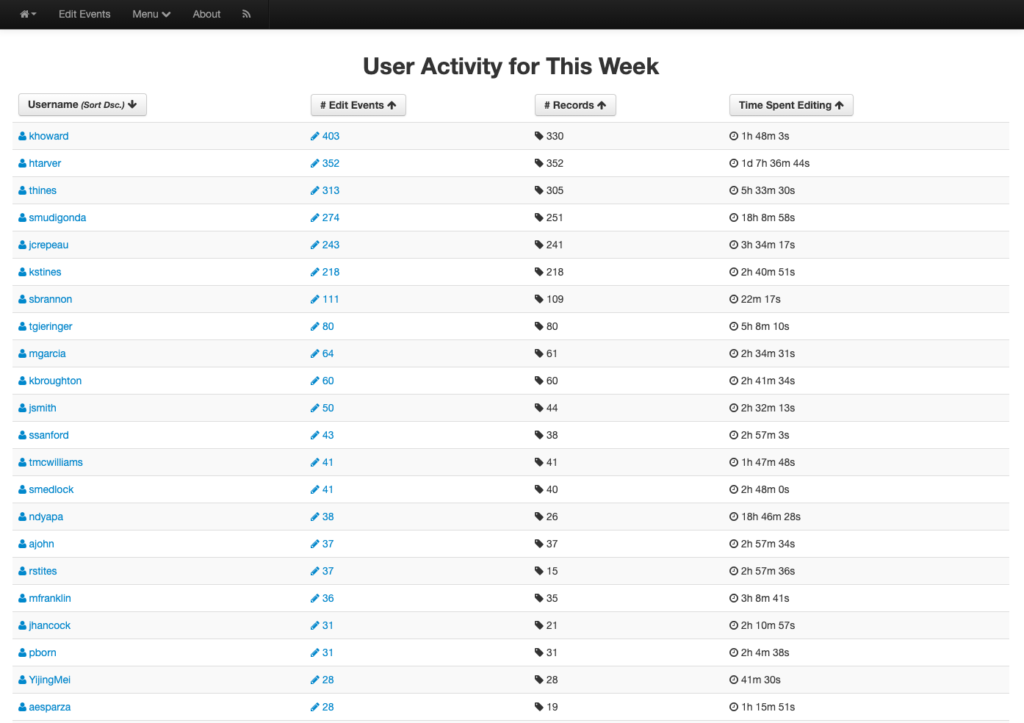
There are two other views in the Edit Events interface that can be useful. If you had clicked on the orange Users button on the Edit landing page you would see a list of all of the Users who have been active during the current week (starting Sunday).
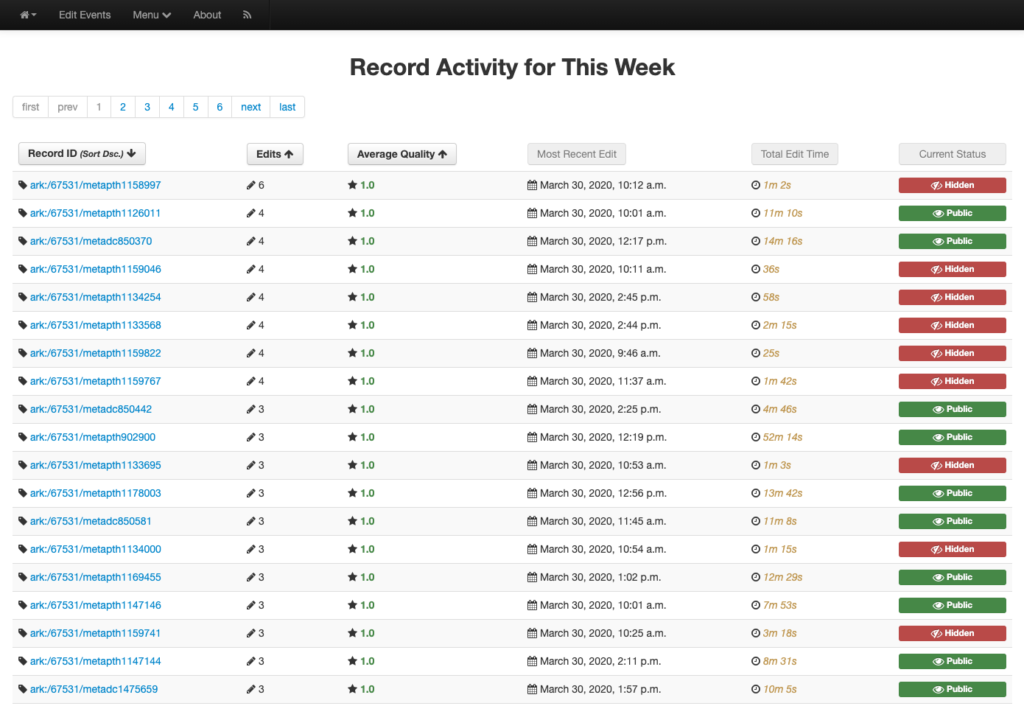
If you click on the orange items button on the Events landing page you get to a view that shows a listing of the records that were edited this week. It also includes the number of edits and the duration of editing for that week.
We are hoping that the improved Events pages will be useful for managers as they begin to review timesheets for students that they supervise. I know that I have been pleasantly surprised by the data when I can view the number of edits we are getting at all hours of the day. I think it shows the opportunities that we have with our digital library systems for providing engaging, meaningful work to a wide range of users during this quarantine.
I skipped forward in my list of components we have needed for this process. Over the next blog posts, I will go back and pick up where I left off describing the infrastructure we have in place to communicate instructions and documentation, and finally how we are identifying work that needs to be done in the system.
If you have questions or comments about this post, please let me know via Twitter.