News

Data donation to Wikidata, part 2: country/subject dossiers of the 20th Century Press Archives

The world's largest public newspaper clippings archive comprises lots of material of great interest particularly for authors and readers in the Wikiverse. ZBW has digitized the material from the first half of the last century, and has put all available metadata under a CC0 license. More so, we are donating that data to Wikidata, by adding or enhancing items and providing ways to access the dossiers (called "folders") and clippings easily from there.

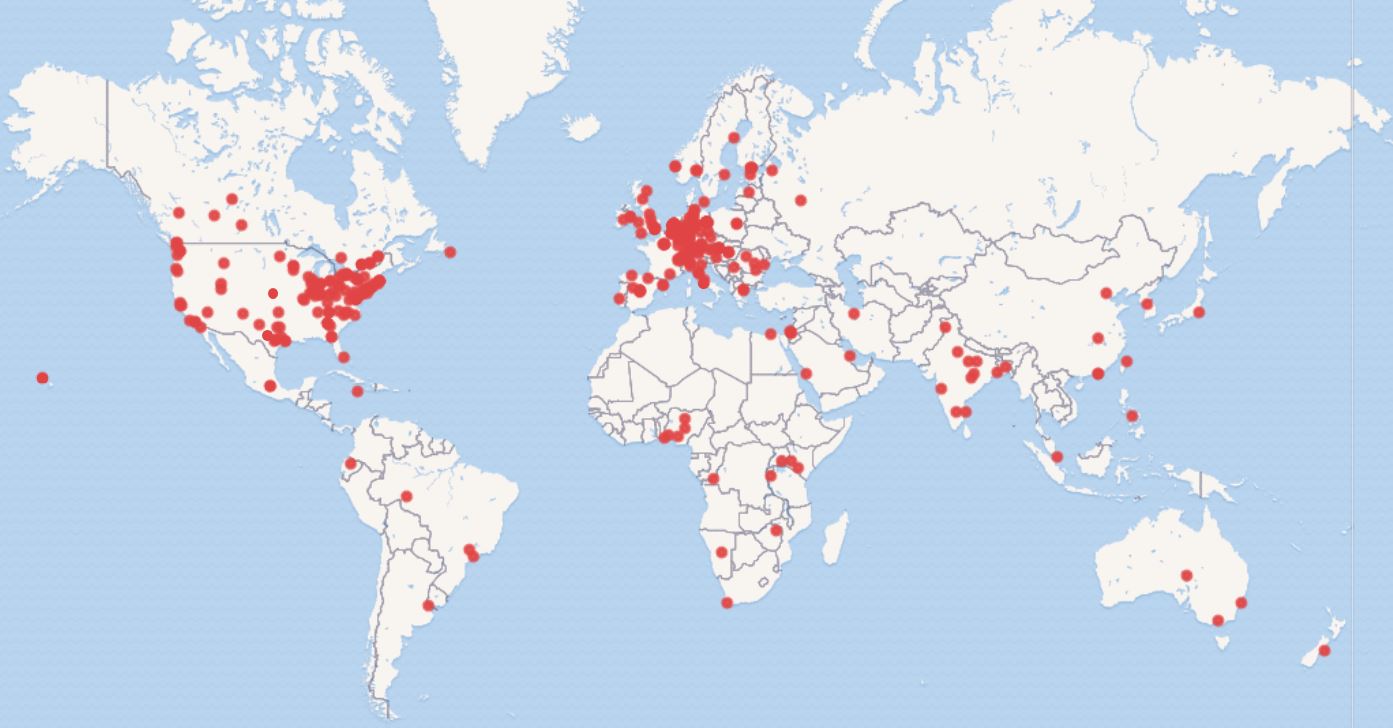
Building the SWIB20 participants map

 SWIB20 participant map

Here we describe the process of building the interactive SWIB20 participants map, created by a query to Wikidata. The map was intended to support participants of SWIB20 to make contacts in the virtual conference space. However, in compliance with GDPR we want to avoid publishing personal details. So we choose to publish a map of institutions, to which the participants are affiliated. (Obvious downside: the 9 un-affiliated participants could not be represented on the map).

We suppose that the method can be applied to other conferences and other use cases - e.g., the downloaders of scientific software or the institutions subscribed to an academic journal. Therefore, we describe the process in some detail.

Journal Map: developing an open environment for accessing and analyzing performance indicators from journals in economics

by Franz Osorio, Timo Borst

Introduction

Bibliometrics, scientometrics, informetrics and webometrics have been both research topics and practical guidelines for publishing, reading, citing, measuring and acquiring published research for a while (Hood 2001). Citation databases and measures had been introduced in the 1960s, becoming benchmarks both for the publishing industry and academic libraries managing their holdings and journal acquisitions that tend to be more selective with a growing number of journals on the one side, budget cuts on the other. Due to the Open Access movement triggering a transformation of traditional publishing models (Schimmer 2015), and in the light of both global and distributed information infrastructures for publishing and communicating on the web that have yielded more diverse practices and communities, this situation has dramatically changed: While bibliometrics of research output in its core understanding still is highly relevant to stakeholders and the scientific community, visibility, influence and impact of scientific results has shifted to locations in the World Wide Web that are commonly shared and quickly accessible not only by peers, but by the general public (Thelwall 2013). This has several implications for different stakeholders who are referring to metrics in dealing with scientific results:
 
  • With the rise of social networks, platforms and their use also by academics and research communities, the term 'metrics' itself has gained a broader meaning: while traditional citation indexes only track citations of literature published in (other) journals, 'mentions', 'reads' and 'tweets', albeit less formal, have become indicators and measures for (scientific) impact.
  • Altmetrics has influenced research performance, evaluation and measurement, which formerly had been exclusively associated with traditional bibliometrics. Scientists are becoming aware of alternative publishing channels and both the option and need of 'self-advertising' their output.
  • In particular academic libraries are forced to manage their journal subscriptions and holdings in the light of increasing scientific output on the one hand, and stagnating budgets on the other. While editorial products from the publishing industry are exposed to a global competing market requiring a 'brand' strategy, altmetrics may serve as additional scattered indicators for scientific awareness and value.

Against this background, we took the opportunity to collect, process and display some impact or signal data with respect to literature in economics from different sources, such as 'traditional' citation databases, journal rankings and community platforms resp. altmetrics indicators:

  • CitEc. The long-standing citation service maintainted by the RePEc community provided a dump of both working papers (as part of series) and journal articles, the latter with significant information on classic impact factors such as impact factor (2 and 5 years) and h-index.
  • Rankings of journals in economics including Scimago Journal Rank (SJR) and two German journal rankings, that are regularly released and updated (VHB Jourqual, Handelsblatt Ranking).
  • Usage data from Altmetric.com that we collected for those articles that could be identified via their Digital Object Identifier.
  • Usage data from the scientific community platform and reference manager Mendeley.com, in particular the number of saves or bookmarks on an individual paper.

Requirements

A major consideration for this project was finding an open environment in which to implement it. Finding an open platform to use served a few purposes. As a member of the "Leibniz Research Association," ZBW has a commitment to Open Science and in part that means making use of open technologies to as great extent as possible (The ZBW - Open Scienc...). This open system should allow direct access to the underlying data so that users are able to use it for their own investigations and purposes. Additionally, if possible the user should be able to manipulate the data within the system.
The first instance of the project was created in Tableau, which offers a variety of means to express data and create interfaces for the user to filter and manipulate data. It also can provide a way to work with the data and create visualizations without programming skills or knowledge. Tableau is one of the most popular tools to create and deliver data visualization in particular within academic libraries (Murphy 2013). However, the software is proprietary and has a monthly fee to use and maintain, as well as closing off the data and making only the final visualization available to users. It was able to provide a starting point for how we wanted to the data to appear to the user, but it is in no way open.

Challenges

The first technical challenge was to consolidate the data from the different sources which had varying formats and organizations. Broadly speaking, the bibliometric data (CitEc and journal rankings) existed as a spread sheet with multiple pages, while the altmetrics and Mendeley data came from a database dumps with multiple tables that were presented as several CSV files. In addition to these different formats, the data needed to be cleaned and gaps filled in. The sources also had very different scopes. The altmetrics and Mendeley data covered only 30 journals, the bibliometric data, on the other hand, had more than 1,000 journals.
Transitioning from Tableau to an open platform was big challenge. While there are many ways to create data visualizations and present them to users, the decision was made to use to work with the data and Shiny to present it. R is used widely to work with data and to present it (Kläre 2017). The language has lots of support for these kinds of task over many libraries. The primary libraries used were R Plotly and R Shiny. Plotly is a popular library for creating interactive visualizations. Without too much work Plotly can provide features including information popups while hovering over a chart and on the fly filtering. Shiny provides a framework to create a web application to present the data without requiring a lot of work to create HTML and CSS. The transition required time spent getting to know R and its libraries, to learn how to create the kinds of charts and filters that would be useful for users. While Shiny alleviates the need to create HTML and CSS, it does have a specific set of requirements and structures in order to function.
The final challenge was in making this project accessible to users such that they would be able to see what we had done, have access to the data, and have an environment in which they could explore the data without needing anything other than what we were providing. In order to achieve this we used Binder as the platform. At it's most basic Binder makes it possible to share a Jupyter Notebook stored in a Github repository with a URL by running the Jupyter Notebook remotely and providing access through a browser with no requirements placed on the user. Additionally, Binder is able to run a web application using R and Shiny. To move from a locally running instance of R Shiny to one that can run in Binder, instructions for the runtime environment need to be created and added to the repository. These include information on what version of the language to use,  which packages and libraries to install for the language, and any additional requirements there might be to run everything.

Solutions

Given the disparate sources and formats for the data, there was work that needed to be done to prepare it for visualization. The largest dataset, the bibliographic data, had several identifiers for each journal but without journal names. Having the journals names is important because in general the names are how users will know the journals. Adding the names to the data would allow users to filter on specific journals or pull up two journals for a comparison. Providing the names of the journals is also a benefit for anyone who may repurpose the data and saves them from having to look them up. In order to fill this gap, we used metadata available through Research Papers in Economics (RePEc). RePEc is an organization that seeks to "enhance the dissemination of research in Economics and related sciences". It contains metadata for more than 3 million papers available in different formats. The bibliographic data contained RePEc Handles which we used to look up the journal information as XML and then parse the XML to find the title of the journal.  After writing a small Python script to go through the RePEc data and find the missing names there were only 6 journals whose names were still missing.
For the data that originated in an MySQL database, the major work that needed to be done was to correct the formatting. The data was provided as CSV files but it was not formatted such that it could be used right away. Some of the fields had double quotation marks and when the CSV file was created those quotes were put into other quotation marks resulting doubled quotation marks which made machine parsing difficult without intervention directly on the files. The work was to go through the files and quickly remove the doubled quotation marks.
In addition to that, it was useful for some visualizations to provide a condensed version of the data. The data from the database was at the article level which is useful for some things, but could be time consuming for other actions. For example, the altmetrics data covered only 30 journals but had almost 14,000 rows. We could use the Python library pandas to go through the all those rows and condense the data down so that there are only 30 rows with the data for each column being the sum of all rows. In this way, there is a dataset that can be used to easily and quickly generate summaries on the journal level.
Shiny applications require a specific structure and files in order to do the work of creating HTML without needing to write the full HTML and CSS. At it's most basic there are two main parts to the Shiny application. The first defines the user interface (UI) of the page. It says what goes where, what kind of elements to include, and how things are labeled. This section defines what the user interacts with by creating inputs and also defining the layout of the output. The second part acts as a server that handles the computations and processing of the data that will be passed on to the UI for display. The two pieces work in tandem, passing information back and forth to create a visualization based on user input. Using Shiny allowed almost all of the time spent on creating the project to be concentrated on processing the data and creating the visualizations. The only difficulty in creating the frontend was making sure all the pieces of the UI and Server were connected correctly.
Binder provided a solution for hosting the application, making the data available to users, and making it shareable all in an open environment. Notebooks and applications hosted with Binder are shareable in part because the source is often a repository like Github. By passing a Github repository to Binder, say one that has a Jupyter Notebook in it, Binder will build a Docker image to run the notebook and then serve the result to the user without them needing to do anything. Out of the box the Docker image will contain only the most basic functions. The result is that if a notebook requires a library that isn't standard, it won't be possible to run all of the code in the notebook. In order to address this, Binder allows for the inclusion in a repository of certain files that can define what extra elements should be included when building the Docker image. This can be very specific such as what version of the language to use and listing various libraries that should be included to ensure that the notebook can be run smoothly. Binder also has support for more advanced functionality in the Docker images such as creating a Postgres database and loading it with data. These kinds of activities require using different hooks that Binder looks for during the creation of the Docker image to run scripts.

Results and evaluation

The final product has three main sections that divide the data categorically into altmetrics, bibliometrics, and data from Mendeley. There are additionally some sections that exist as areas where something new could be tried out and refined without potentially causing issues with the three previously mentioned areas. Each section has visualizations that are based on the data available.
Considering the requirements for the project, the result goes a long way to meeting the requirements. The most apparent area that the Journal Map succeeds in is its goals is of presenting data that we have collected. The application serves as a dashboard for the data that can be explored by changing filters and journal selections. By presenting the data as a dashboard, the barrier to entry for users to explore the data is low. However, there exists a way to access the data directly and perform new calculations, or create new visualizations. This can be done through the application's access to an R-Studio environment. Access to R-Studio provides two major features. First, it gives direct access to the all the underlying code that creates the dashboard and the data used by it. Second, it provides an R terminal so that users can work with the data directly. In R-Studio, the user can also modify the existing files and then run them from R-Studio to see the results. Using Binder and R as the backend of the applications allows us to provide users with different ways to access and work with data without any extra requirements on the part of the user. However, anything changed in R-Studio won't affect the dashboard view and won't persist between sessions. Changes exist only in the current session.
All the major pieces of this project were able to be done using open technologies: Binder to serve the application, R to write the code, and Github to host all the code. Using these technologies and leveraging their capabilities allows the project to support the Open Science paradigm that was part of the impetus for the project.
The biggest drawback to the current implementation is that Binder is a third party host and so there are certain things that are out of our control. For example, Binder can be slow to load. It takes on average 1+ minutes for the Docker image to load. There's not much, if anything, we can do to speed that up. The other issue is that if there is an update to the Binder source code that breaks something, then the application will be inaccessible until the issue is resolved.

Outlook and future work

The application, in its current state, has parts that are not finalized. As we receive feedback, we will make changes to the application to add or change visualizations. As mentioned previously, there a few sections that were created to test different visualizations independently of the more complete sections, those can be finalized.
In the future it may be possible to move from BinderHub to a locally created and administered version of Binder. There is support and documentation for creating local, self hosted instances of Binder. Going that direction would give more control, and may make it possible to get the Docker image to load more quickly.
While the application runs stand-alone, the data that is visualized may also be integrated in other contexts. One option we are already prototyping is integrating the data into our subject portal EconBiz, so users would be able to judge the scientific impact of an article in terms of both bibliometric and altmetric indicators.
 

References

  • William W. Hood, Concepcion S. Wilson. The Literature of Bibliometrics, Scientometrics, and Informetrics. Scientometrics 52, 291–314 Springer Science and Business Media LLC, 2001. Link

  • R. Schimmer. Disrupting the subscription journals’ business model for the necessary large-scale transformation to open access. (2015). Link

  • Mike Thelwall, Stefanie Haustein, Vincent Larivière, Cassidy R. Sugimoto. Do Altmetrics Work? Twitter and Ten Other Social Web Services. PLoS ONE 8, e64841 Public Library of Science (PLoS), 2013. Link

  • The ZBW - Open Science Future. Link

  • Sarah Anne Murphy. Data Visualization and Rapid Analytics: Applying Tableau Desktop to Support Library Decision-Making. Journal of Web Librarianship 7, 465–476 Informa UK Limited, 2013. Link

  • Christina Kläre, Timo Borst. Statistic packages and their use in research in Economics | EDaWaX - Blog of the project ’European Data Watch Extended’. EDaWaX - European Data Watch Extended (2017). Link

Integrating altmetrics into a subject repository - EconStor as a use case

Back in 2015 the ZBW Leibniz Information Center for Economics (ZBW) teamed up with the Göttingen State and university library (SUB), the Service Center of Götting library federation (VZG) and GESIS Leibniz Institute for the Social Sciences in the *metrics project funded by the German Research Foundation (DFG). The aim of the project was: “… to develop a deeper understanding of *metrics, especially in terms of their general significance and their perception amongst stakeholders.” (*metrics project about).

In the practical part of the project the following DSpace based repositories of the project partners participated as data sources for online publications and – in the case of EconStor – also as implementer for the presentation of the social media signals:

  • EconStor - a subject repository for economics and business studies run by the ZBW, currently (Aug. 2019) containing round about 180,000 downloadable files,
  • GoeScholar - the Publication Server of the Georg-August-Universität Göttingen run by the SUB Göttingen, offering approximately 11,000 publicly browsable items so far,
  • SSOAR - the “Social Science Open Access Repository” maintained by GESIS, currently containing about 53,000 publicly available items.

In the work package “Technology analysis for the collection and provision of *metrics” of the project an analysis of currently available *metrics technologies and services had been performed.

As stated by [Wilsdon 2017], currently suppliers of altmetrics “remain too narrow (mainly considering research products with DOIs)”, which leads to problems to acquire *metrics data for repositories like EconStor with working papers as the main content. As up to now it is unusual – at least in the social sciences and economics – to create DOIs for this kind of documents. Only the resulting final article published in a journal will receive a DOI.

Based on the findings in this work package, a test implementation of the *metrics crawler had been built. The crawler had been actively deployed from early 2018 to spring 2019 at the VZG. For the aggregation of the *metrics data the crawler had been fed with persistent identifiers and metadata from the aforementioned repositories.

At this stage of the project, the project partners still had the expectation, that the persistent identifiers (e.g. handle, URNs, …), or their local URL counterparts, as used by the repositories could be harnessed to easily identify social media mentions of their documents, e.g. for EconStor:

  • handle: “hdl:10419/…”
  • handle.net resolver URL: “http(s)://hdl.handle.net/10419/…”
  • EconStor landing page URL with handle: “http(s)://www.econstor.eu/handle/10419/…”
  • EconStor bitstream (PDF) URL with handle: “http(s)://www.econstor.eu/bitstream/10419/…”

20th Century Press Archives: Data donation to Wikidata

ZBW is donating a large open dataset from the 20th Century Press Archives to Wikidata, in order to make it better accessible to various scientific disciplines such as contemporary, economic and business history, media and information science, to journalists, teachers, students, and the general public.

The 20th Century Press Archives (PM20) is a large public newspaper clippings archive, extracted from more than 1500 different sources published in Germany and all over the world, covering roughly a full century (1908-2005). The clippings are organized in thematic folders about persons, companies and institutions, general subjects, and wares. During a project originally funded by the German Research Foundation (DFG), the material up to 1960 has been digitized. 25,000 folders with more than two million pages up to 1949 are freely accessible online.  The fine-grained thematic access and the public nature of the archives makes it to our best knowledge unique across the world (more information on Wikipedia) and an essential research data fund for some of the disciplines mentioned above.

The data donation does not only mean that ZBW has assigned a CC0 license to all PM20 metadata, which makes it compatible with Wikidata. (Due to intellectual property rights, only the metadata can be licensed by ZBW - all legal rights on the press articles themselves remain with their original creators.) The donation also includes investing a substantial amount of working time (during, as planned, two years) devoted to the integration of this data into Wikidata. Here we want to share our experiences regarding the integration of the persons archive metadata.

ZBW's contribution to "Coding da Vinci": Dossiers about persons and companies from 20th Century Press Archives

At 27th and 28th of October, the Kick-off for the "Kultur-Hackathon" Coding da Vinci is held in Mainz, Germany, organized this time by GLAM institutions from the Rhein-Main area: "For five weeks, devoted fans of culture and hacking alike will prototype, code and design to make open cultural data come alive." New software applications are enabled by free and open data.

For the first time, ZBW is among the data providers. It contributes the person and company dossiers of the 20th Century Press Archive. For about a hundred years, the predecessor organizations of ZBW in Kiel and Hamburg had collected press clippings, business reports and other material about a wide range of political, economic and social topics, about persons, organizations, wares, events and general subjects. During a project funded by the German Research Organization (DFG), the documents published up to 1948 (about 5,7 million pages) had been digitized and are made publicly accessible with according metadata, until recently solely in the "Pressemappe 20. Jahrhundert" (PM20) web application. Additionally, the dossiers - for example about Mahatma Gandhi or the Hamburg-Bremer Afrika Linie - can be loaded into a web viewer.

As a first step to open up this unique source of data for various communities, ZBW has decided to put the complete PM20 metadata* under a CC-Zero license, which allows free reuse in all contexts. For our Coding da Vinci contribution, we have prepared all person and company dossiers which already contain documents. The dossiers are interlinked among each other. Controlled vocabularies (for, e.g., "country", or "field of activity") provide multi-dimensional access to the data. Most of the persons and a good share of organizations were linked to GND identifiers. As a starter, we had mapped dossiers to Wikidata according to existing GND IDs. That allows to run queries for PM20 dossiers completely on Wikidata, making use of all the good stuff there. An example query shows the birth places of PM20 economists on a map, enriched with images from Wikimedia commons. The initial mapping was much extended by fantastic semi-automatic and manual mapping efforts by the Wikidata community. So currently more than 80 % of the dossiers about - often rather prominent - PM20 persons are linked not only to Wikidata, but also connected to Wikipedia pages. That offers great opportunities for mash-ups to further data sources, and we are looking forward to what the "Coding da Vinci" crowd may make out of these opportunities.

Technically, the data has been converted from an internal intermediate format to still quite experimental RDF and loaded into a SPARQL endpoint. There it was enriched with data from Wikidata and extracted with a construct query. We have decided to transform it to JSON-LD for publication (following practices recommended by our hbz colleagues). So developers can use the data as "plain old JSON", with the plethora of web tools available for this, while linked data enthusiasts can utilize sophisticated Semantic Web tools by applying the provided JSON-LD context. In order to make the dataset discoverable and reusable for future research, we published it persistently at zenodo.org. With it, we provide examples and data documentation. A GitHub repository gives you additional code examples and a way to address issues and suggestions.

* For the scanned documents, the legal regulations apply - ZBW cannot assign licenses here.


Wikidata as authority linking hub: Connecting RePEc and GND researcher identifiers

In the EconBiz portal for publications in economics, we have data from different sources. In some of these sources, most notably ZBW's "ECONIS" bibliographical database, authors are disambiguated by identifiers of the Integrated Authority File (GND) - in total more than 470,000. Data stemming from "Research papers in Economics" (RePEc) contains another identifier: RePEc authors can register themselves in the RePEc Author Service (RAS), and claim their papers. This data is used for various rankings of authors and, indirectly, of institutions in economics, which provides a big incentive for authors - about 50,000 have signed into RAS - to keep both their article claims and personal data up-to-date. While GND is well known and linked to many other authorities, RAS had no links to any other researcher identifier system. Thus, until recently, the author identifiers were disconnected, which precludes the possibility to display all publications of an author on a portal page.

To overcome that limitation, colleagues at ZBW have matched a good 3,000 authors with RAS and GND IDs by their publications (see details here). Making that pre-existing mapping maintainable and extensible however would have meant to set up some custom editing interface, would have required storage and operating resources and wouldn't easily have been made publicly accessible. In a previous article, we described the opportunities offered by Wikidata. Now we made use of it.

New version of multi-lingual JEL classification published in LOD

The Journal of Economic Literature Classification Scheme (JEL) was created and is maintained by the American Economic Association. The AEA provides this widely used resource freely for scholarly purposes. Thanks to André Davids (KU Leuven), who has translated the originally English-only labels of the classification to French, Spanish and German, we provide a multi-lingual version of JEL. It's lastest version (as of 2017-01) is published in the formats RDFa and RDF download files. These formats and translations are provided "as is" and are not authorized by AEA. In order to make changes in JEL tracable more easily, we have created lists of inserted and removed JEL classes in the context of the skos-history project.

Economists in Wikidata: Opportunities of Authority Linking

Wikidata is a large database, which connects all of the roughly 300 Wikipedia projects. Besides interlinking all Wikipedia pages in different languages about a specific item – e.g., a person -, it also connects to more than 1000 different sources of authority information.

The linking is achieved by a „authority control“ class of Wikidata properties. The values of these properties are identifiers, which unambiguously identify the wikidata item in external, web-accessible databases. The property definitions includes an URI pattern (called „formatter URL“). When the identifier value is inserted into the URI pattern, the resulting URI can be used to look up the authoritiy entry. The resulting URI may point to a Linked Data resource - as it is the case with the GND ID property. This, on the one hand, provides a light-weight and robust mechanism to create links in the web of data. On the other hand, these links can be exploited by every application which is driven by one of the authorities to provide additional data: Links to Wikipedia pages in multiple languages, images, life data, nationality and affiliations of the according persons, and much more.

Bini Agarwal - Sqid screenshot

Wikidata item for the Indian Economist Bina Agarwal, visualized via the SQID browser

Integrating a Research Data Repository with established research practices

Authors: Timo Borst, Konstantin Ott

In recent years, repositories for managing research data have emerged, which are supposed to help researchers to upload, describe, distribute and share their data. To promote and foster the distribution of research data in the light of paradigms like Open Science and Open Access, these repositories are normally implemented and hosted as stand-alone applications, meaning that they offer a web interface for manually uploading the data, and a presentation interface for browsing, searching and accessing the data. Sometimes, the first component (interface for uploading the data) is substituted or complemented by a submission interface from another application. E.g., in Dataverse or in CKAN data is submitted from remote third-party applications by means of data deposit APIs [1]. However the upload of data is organized and eventually embedded into a publishing framework (data either as a supplement of a journal article, or as a stand-alone research output subject to review and release as part of a ‘data journal’), it definitely means that this data is supposed to be made publicly available, which is often reflected by policies and guidelines for data deposit.

Pages

Subscribe to ZBW Labs RSS