You shall know a word by the company it keeps. --John Rupert Firth
I am finally getting my brain around the process of reading texts through the use of network graphs.
Words in-and-of themselves do not carry very much meaning; the connotation of words is lost without context; the meaning and connotation of words only really present themselves when words are used in conjunction with other words. That is why, in world of natural language processing, things like ngrams, noun phrases, and grammars are so important. Heck, things like topic modelers (such as MALLET) and semantic indexers (such as Word2Vec) assume the co-occurrence of words is indicative of meaning. With this in mind, network graphs can be used to literally illustrate the relationship of words.
As you may or may not know, network graphs are mathematical models composed of "nodes" and "edges". Nodes denote things, and in my world, nodes are usually words or documents. Edges denote the relationships -- measurements -- between nodes. In the work I do, these measurements are usually the distances between words or the percentage a given document is about a given topic. Once the nodes and edges are manifested in a data structure -- usually some sort of matrix -- they can be computed against and ultimately visualized. This is what I have learned how to do.
Below is a little Python script called "txt2graphml.py". Given a plain text file, one of two normalization functions, and an integer, the script will output a common network graph data structure called "GraphML". The script does its good work through the use of two Python modules, Textacy and NetworkX. The first takes a stream of plain text, parses it into words, normalizes them by finding their lemmas or lower casing them, and then calculates the number of times the given word is in proximity to other words. The normalized words are the nodes, and the proximities are the edges. The second module simply takes the output of the former and serializes it into a GraphML file. The script is relatively tiny; about 33% of the code includes comments:
  #!/usr/bin/env python

  # txt2graphml.py - given the path to a text file, a normalizer,
  # and the size of window, output a graphml file

  # Eric Lease Morgan <emorgan@nd.edu>
  # January 4, 2021 - first cut; because of /dev/stdout, will probably break under Windows

  # configure
  MODEL = 'en_core_web_sm'

  # require
  import networkx as nx
  import os
  import spacy
  import sys
  import textacy

  # get input
  if len( sys.argv ) != 4 : sys.exit( "Usage: " + sys.argv[ 0 ] + " <file> <lemma|lower> <window>" )
  file      = sys.argv[ 1 ]
  normalize = sys.argv[ 2 ]
  window    = int( sys.argv[ 3 ] )

  # get the text to process
  text = open( file ).read()

  # create model and then then use it against the text
  size = ( os.stat( file ).st_size ) + 1
  nlp  = spacy.load( MODEL, max_length=size, disable=( 'tagger', 'parser', 'ner', 'textcat' ) )
  doc  = nlp( text )

  # create a graph; the magic happens here
  G = textacy.spacier.doc_extensions.to_semantic_network(
    doc,
    normalize=normalize,
    nodes='words',
    edge_weighting='cooc_freq',
    window_width=window )

  # output the graph and done
  nx.write_graphml( G, '/dev/stdout' )
  exit()
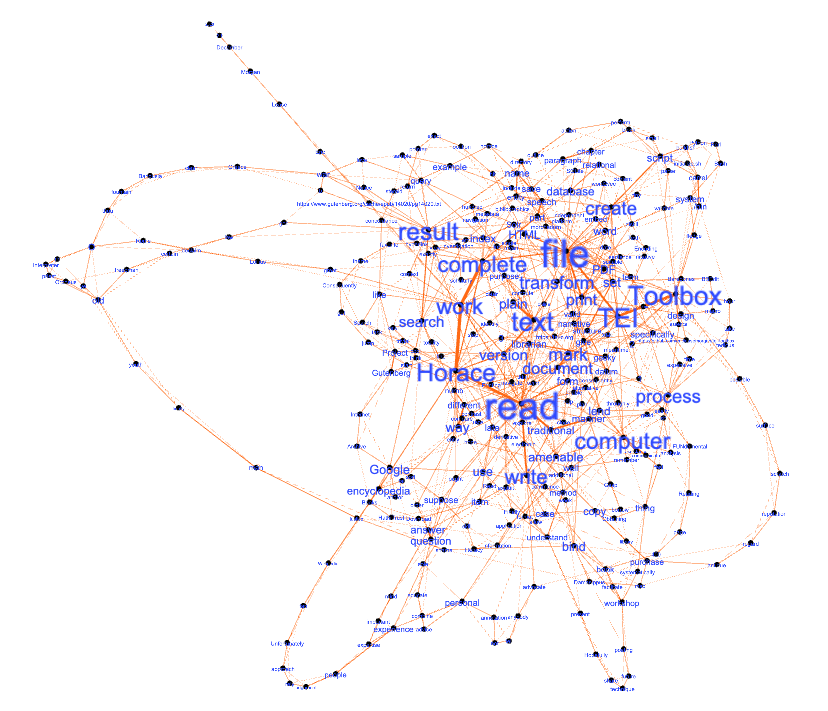
One can take GraphML files and open them in Gephi, a program intended to render network graphs and provide a means to interact with them. Using Gephi is not easy; the use of Gephi requires practice, and I have been practicing off and on for the past few years. (Geesh!) In any event, I used both txt2graphml.py and Gephi to "read" a few of my recent blog postings, and I believe the results are somewhat illuminating. I believe the results illustrate the salient word combinations of each posting. Files. Functions. Tools. Content. Etc. Each "reading" is presented below:
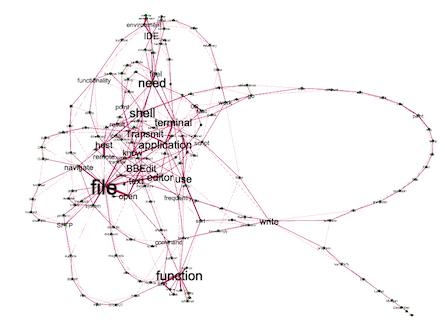
The tools I use to do my application development |
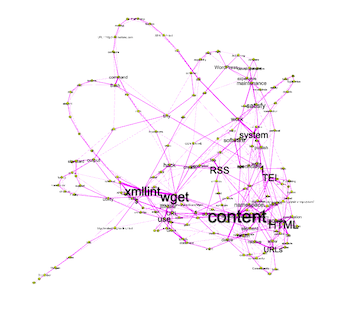
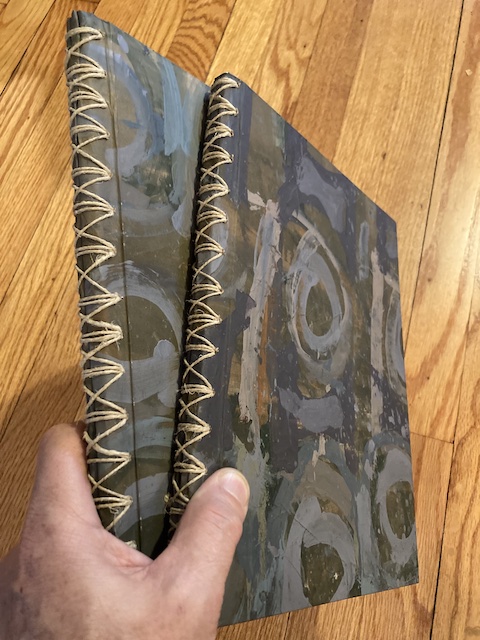
The combined use of two tools to create content |
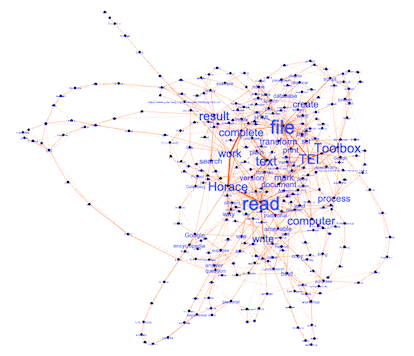
The process I'm employing to read the works of Horace |
There are many caveats to this whole process. First, the denoting of nodes & edges is not trivial, but txt2graphml.py helps. Second, like many visualization processes, the difficulty of visualization is directly proportional to the amount of given data; it is not possible to illustrate the relationship of every word to every other word unless a person has a really, really, really big piece of paper. Third, like I already said, Gephi is not easy to use; Gephi has so many bells, whistles, and options that it is easy to get overwhelmed. That said, the linked zip file includes sample data, txt2graphml.py, a few GraphML files, and a Gephi project so you can get give it a whirl, if you so desire.
Forever and a day we seem to suffering from information overload. Through the ages different tools have been employed to overcome this problem. The venerable library catalog is an excellent example. My personal goal is to learn how certain big ideas (love, honor, truth, justice, beauty, etc.) have been manifested over time, but the corpus of content describing these things is... overwhelming. The Distant Reader is a system designed to address this problem, and I am now on my way to adding network graphs to its toolbox.
Maybe you can employ similar techniques in the work you do?


 WordPress is a significant piece of software, and while its functionality is undeniable, maintaining the software in a constant process. It has become too expensive for me.