a Stop TB and Leprosy Elimination, Division of Communicable Diseases, World Health Organization Regional Office for the Western Pacific, Manila, Philippines.
Correspondence to Tom Hiatt (email:hiattt@wpro.who.int).
To cite this article:
Hiatt T, Nishikiori N. Epidemiology and control of tuberculosis in the Western Pacific Region: update with 2013 case notification rate. Western Pacific Surveillance and Response Journal, 2016, 7(2):41–50. doi:10.5365/wpsar.2015.6.4.010
Introduction: Since the year 2000, tuberculosis (TB) prevalence in the World Health Organization (WHO) Western Pacific Region decreased 36%. However, there were an estimated 1.6 million TB cases in the Region in 2013. This study describes a regional analysis using the WHO global TB database data from 2000 to 2013.
Methods: TB surveillance data are annually collected from 36 countries and areas in the Western Pacific Region using a web-based system. TB case notifications, treatment outcomes and information on TB/HIV coinfection are analysed descriptively. Stratified analysis of the TB data by age, sex and countries and areas were conducted.
Results: Countries and areas in the Western Pacific Region notified 1.3 million new and relapse TB cases in 2013. TB notification rate increased in the early 2000s, stabilized for several years and declined recently. Country-specific TB notification rates declined over time for all age groups in most countries. TB treatment success rates remain high in the Region with 16 countries reaching or maintaining 85% (or higher) in 2013. HIV testing among TB cases has increased gradually with approximately 11 000 HIV-positive TB cases diagnosed each year since 2009.
Discussion: The results suggest that true TB incidence is possibly declining. Treatment success rates have remained high for six of seven high-burden countries. TB surveillance data analysis is an important source of programmatic and epidemiological information. Careful interpretation of these findings can provide useful insight for programmatic decision-making. While the TB burden remains immense, national TB programmes must evolve and adapt to build upon previous efforts.
The burden of tuberculosis (TB) in the World Health Organization (WHO) Western Pacific Region has been greatly reduced since 2000. Estimated TB prevalence fell in the Region from 3.5 million cases in 2000 to 2.3 million in 2013.1 During the same period, 16.7 million TB cases were diagnosed and treated. However, national TB control programmes must continue to evolve and take advantage of new tools to further combat the epidemic. Under the new WHO End TB Strategy with ambitious targets,2 effective monitoring and evaluation is needed to track progress and understand how to best adapt interventions. Surveillance data analysis provides valuable information on the current epidemiological situation, programmatic progress and future directions.
This article presents an updated regional analysis of TB notification data which provides revised information for our previous study.3 It describes the epidemiological situation and progress in programmatic response with particular focus on seven countries having a high burden of TB: Cambodia, China, the Lao People’s Democratic Republic, Mongolia, Papua New Guinea, the Philippines and Viet Nam.
Thirty-two countries and areas of the Western Pacific Region reported data representing more than 99.9% of the total population in 2013. Around March of each year, TB surveillance data are collected from countries and areas in the Region (n = 36) by WHO using a web-based data collection form. Collected data cover the following areas: TB case notifications and treatment outcomes, diagnostic and treatment services, drug management, surveillance and surveys of drug resistance, information on TB/HIV coinfection, infection control, engagement of care providers and budgets and expenditures for TB control. The full description of data collection methods is available in the Global Tuberculosis Report,1 and the data sets are available from the WHO global TB database.4
Case definitions for TB were revised in 2013,5 and cases previously known as smear-positive are now included in the category of bacteriologically confirmed cases which includes cases confirmed by any laboratory method. Similarly, smear-negative cases are combined with all clinically diagnosed cases including where smear was not done or results are unknown. (This obscures the number of cases where laboratory confirmation was sought by including them with the number of cases for which confirmation was not attempted. Knowing this information can indicate uncertainty around the number of notified cases.)
Descriptive analysis of TB case notifications in the Region and by country and area was done. TB notifications were stratified by age and sex for analysis. TB treatment outcomes and progress in TB/HIV activities (HIV testing, HIV positivity rate, co-trimoxazole preventive therapy [CPT] coverage and antiretroviral therapy [ART] coverage) were also analysed. All analyses were conducted by the statistical software environment R version 3.2.1 (R Core Team, Vienna, Austria, 2015).
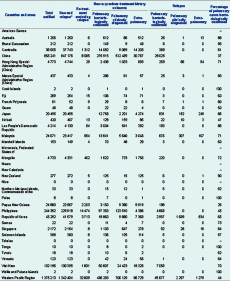
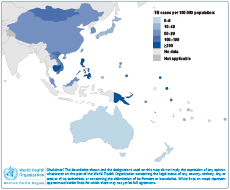
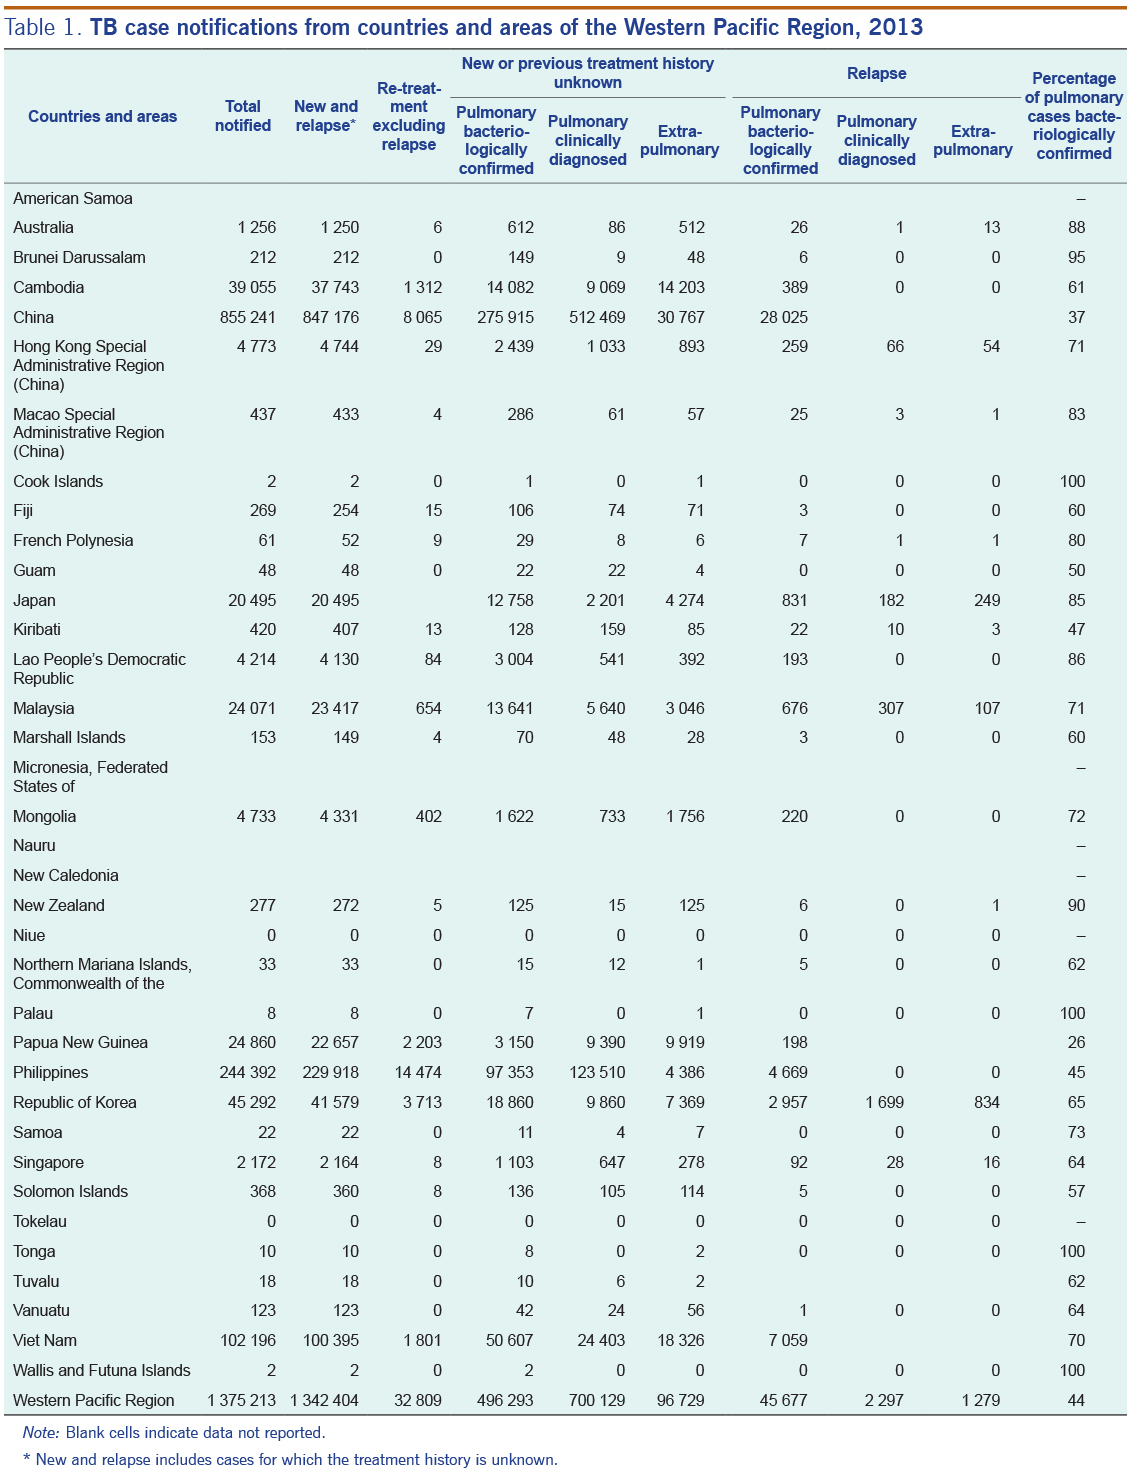
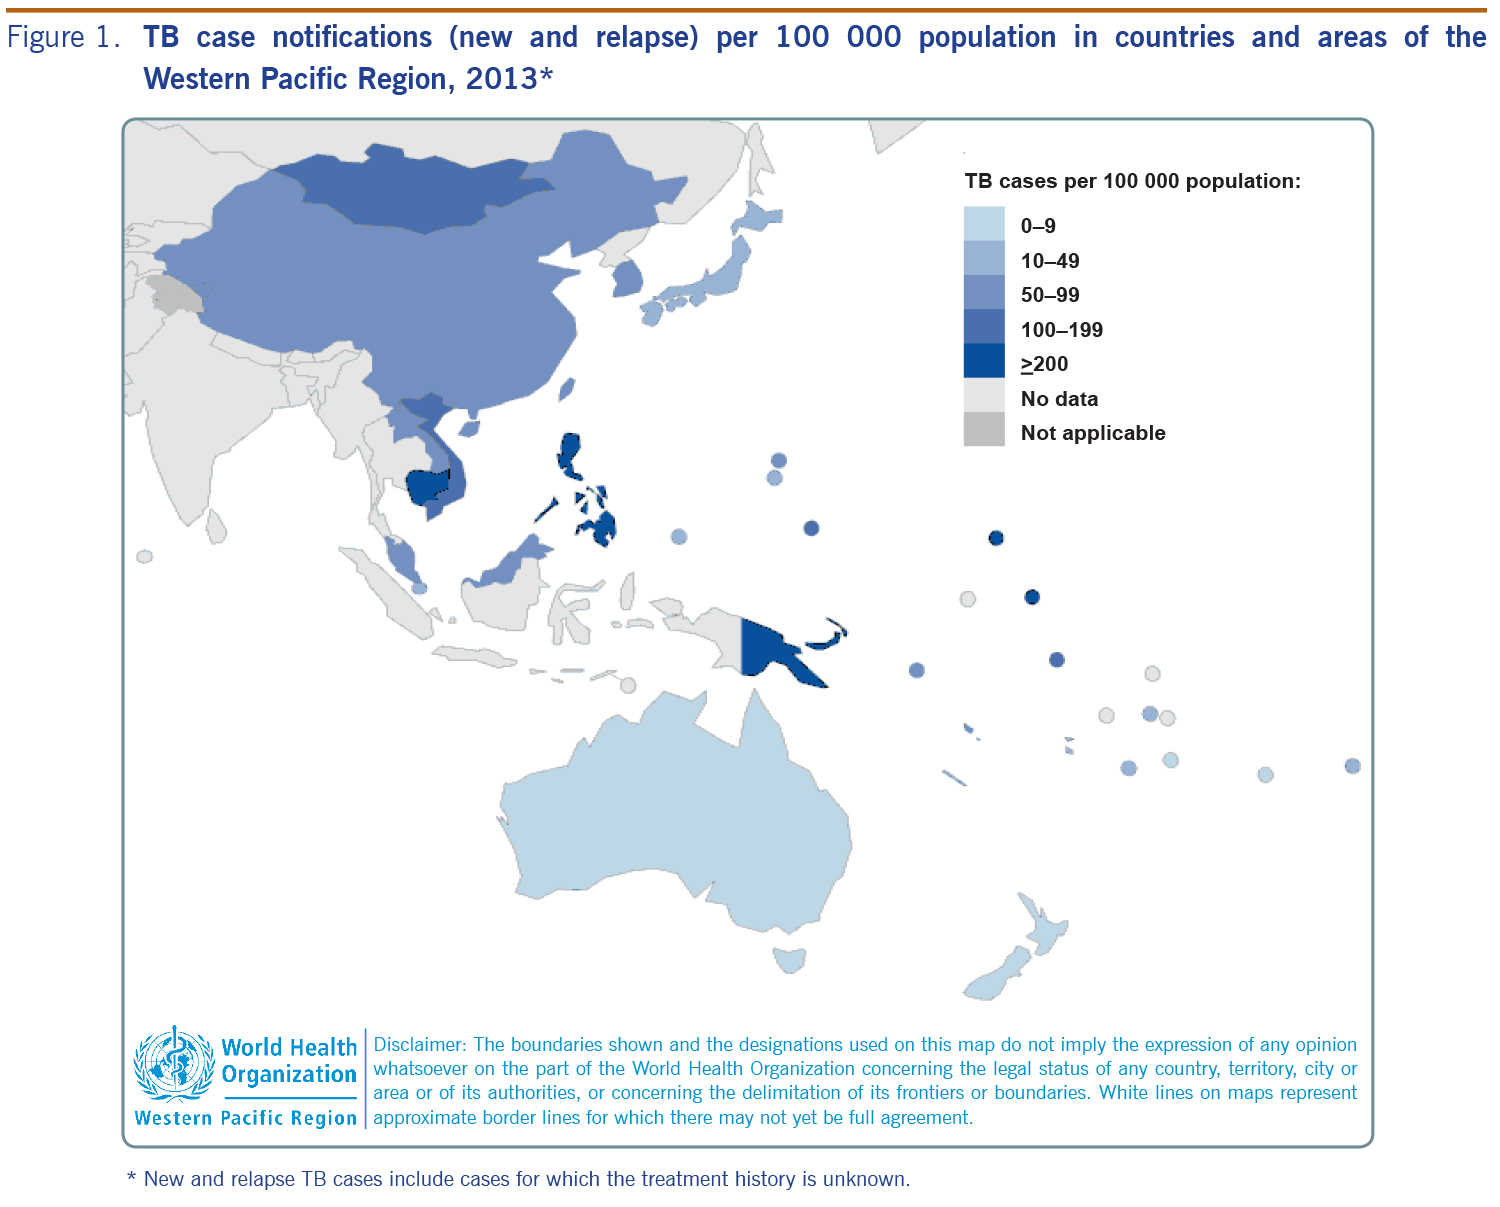
In 2013, countries and areas in the Western Pacific Region (n = 36) reported 1 375 213 people with TB disease (Table 1), making up 23% of the global burden. Of these, 97.6% (1 342 404 cases) were either new or relapse TB cases. Within the Region, China accounted for 62% (855 241 cases) of the caseload followed by the Philippines and Viet Nam with 18% (244 392 cases) and 7.4% (102 196 cases), respectively. TB notification rates in 2013, expressed as cases per 100 000 person years (PYs), varied substantially in the Region with the highest rates (≥ 200 per 100 000 PYs) found in Kiribati, Papua New Guinea, Marshall Islands, Cambodia and the Philippines with 375, 310, 282, 250 and 236 per 100 000 PYs, respectively (Figure 1).
Note: Blank cells indicate data not reported.
* New and relapse includes cases for which the treatment history is unknown.
* New and relapse includes cases for which the treatment history is unknown.
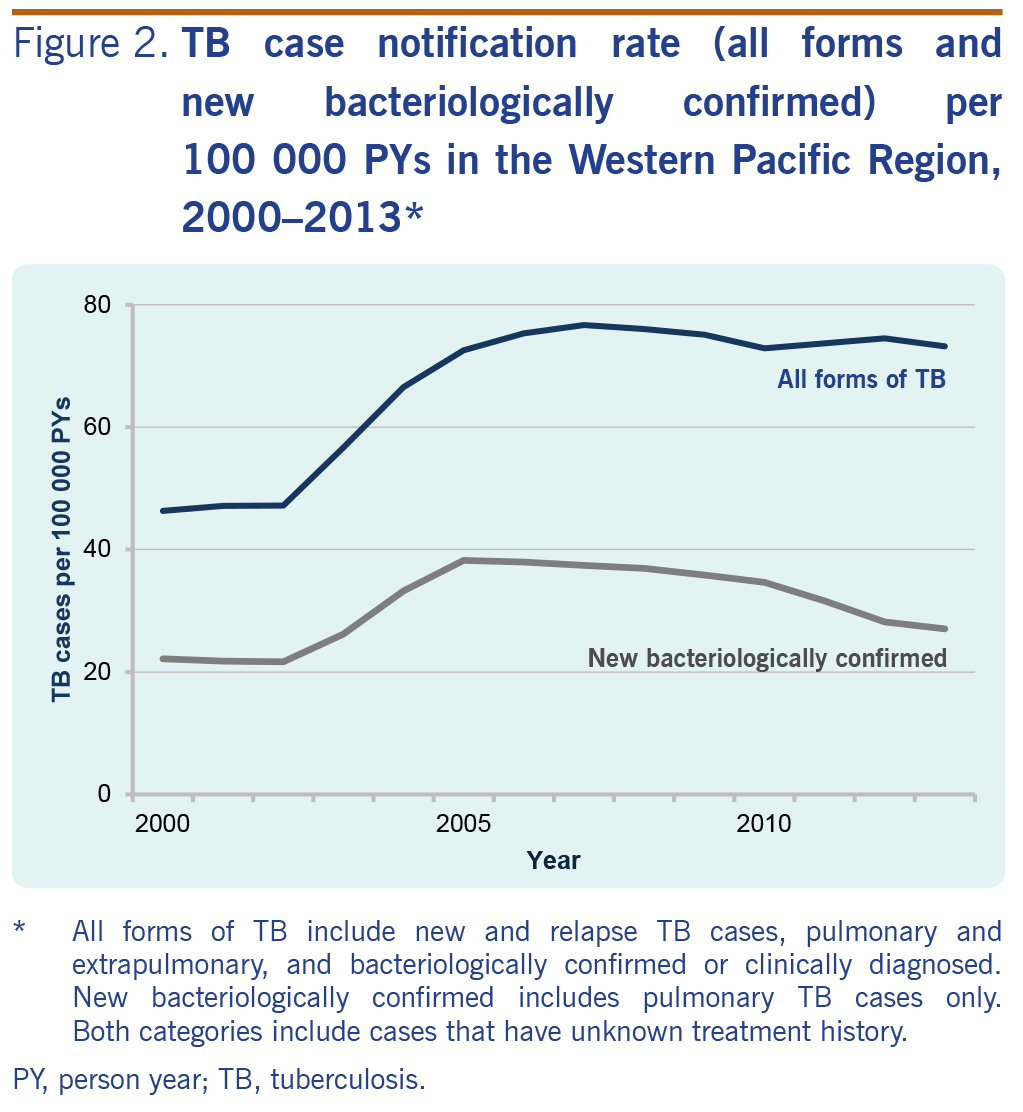
Between 2002 and 2005, case notification rates in the Region of all forms of TB increased from 47 to 74 cases per 100 000 PYs and have stabilized at 73–78 cases per 100 000 PYs since 2005. New bacteriologically confirmed cases increased from 22 cases per 100 000 PYs in 2002 to a peak in 2005 of 39 cases per 100 000 PYs and have declined steadily to 2013 at an average rate of 4.3% per year (Figure 2).
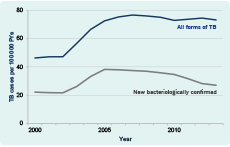
* All forms of TB include new and relapse TB cases, pulmonary and extrapulmonary, and bacteriologically confirmed or clinically diagnosed. New bacteriologically confirmed includes pulmonary TB cases only. Both categories include cases that have unknown treatment history.
PY, person year; TB, tuberculosis.
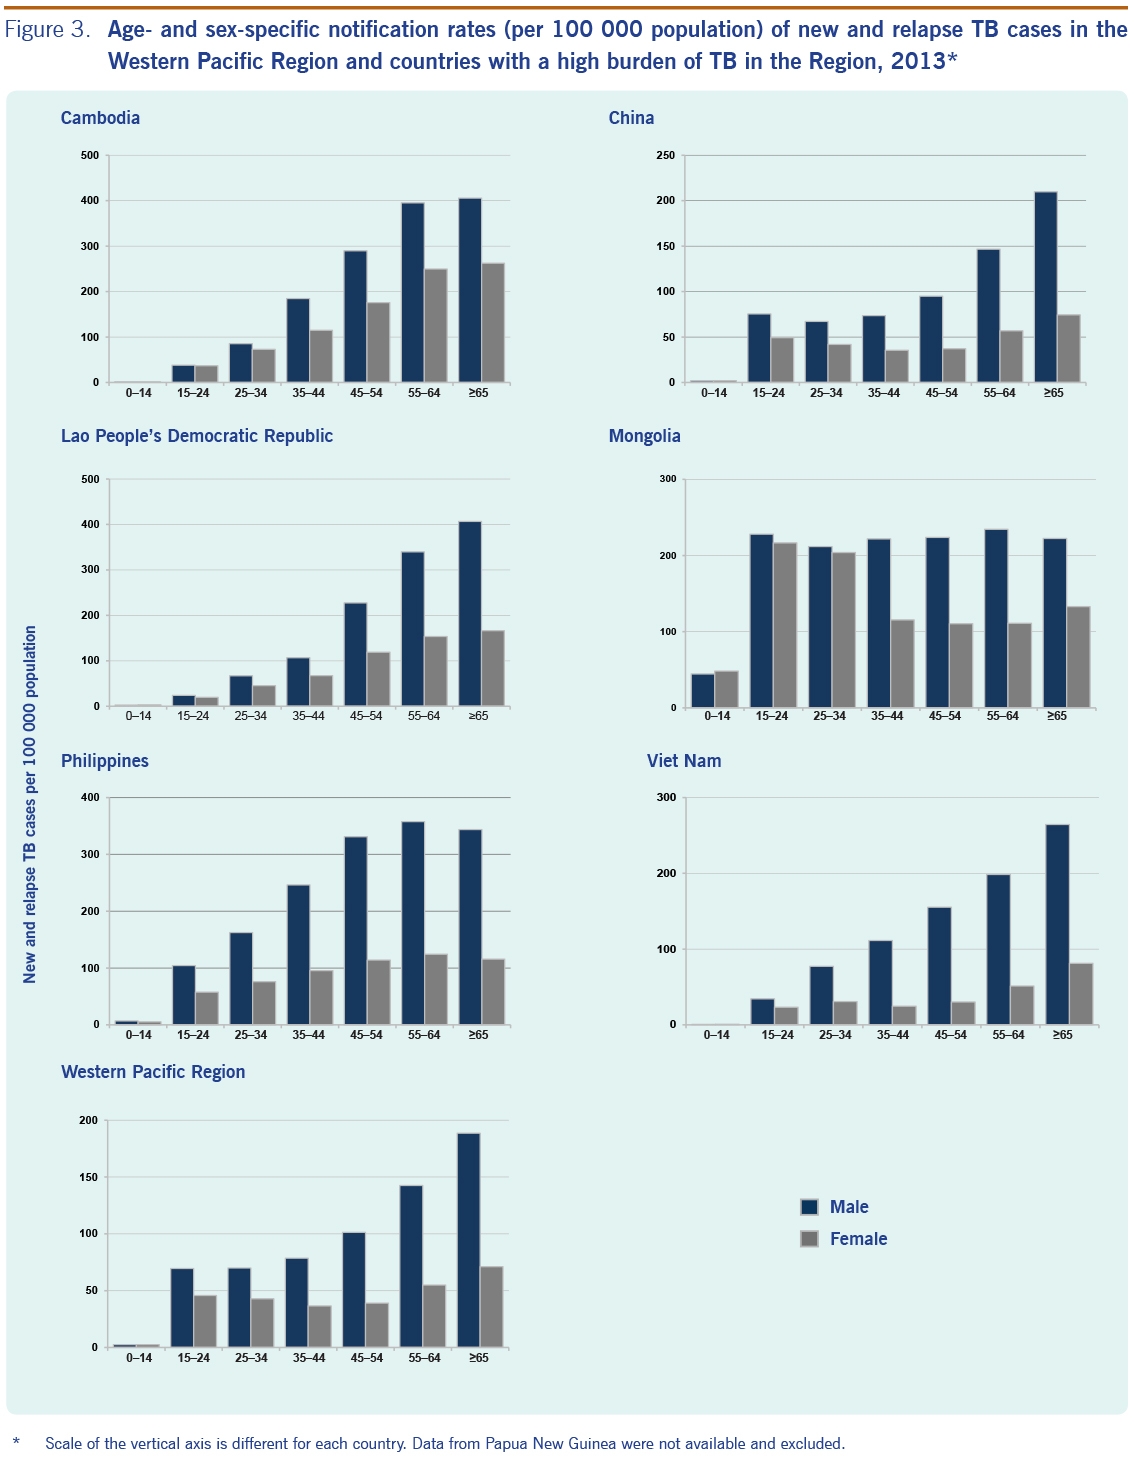
Figure 3 shows age- and sex-specific case notification rates of new bacteriologically confirmed cases for the Western Pacific Region and countries with a high burden of TB in the Region in 2013. In general, TB affected males more than females with an overall male-to-female ratio of 2.2 in the Region (highest in Viet Nam, 2.9 and lowest in Cambodia, 1.2).
* Scale of the vertical axis is different for each country. Data from Papua New Guinea were not available and excluded.
All countries follow a typical pattern for cross-sectional observations with increasing notification rates for older populations, except Mongolia. Children aged 0–14 showed the lowest rates, with Viet Nam showing the lowest rates for this age group (unweighted mean of males and females was 0.68 cases per 100 000 PYs). Among the population 15 years and older in the Region, the difference in TB notification rates was the lowest in Mongolia, among male cases, where the highest rate (55–64 age group) was only 1.1 times to the lowest (≥ 65 age group). The difference in TB notification rates was the highest in the Lao People’s Democratic Republic, among male cases, where the highest rate (≥ 65 age group) was 17 times that of the lowest (15–24 age group).
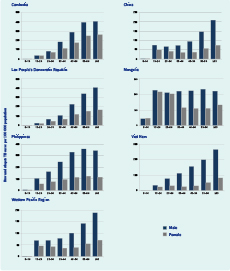
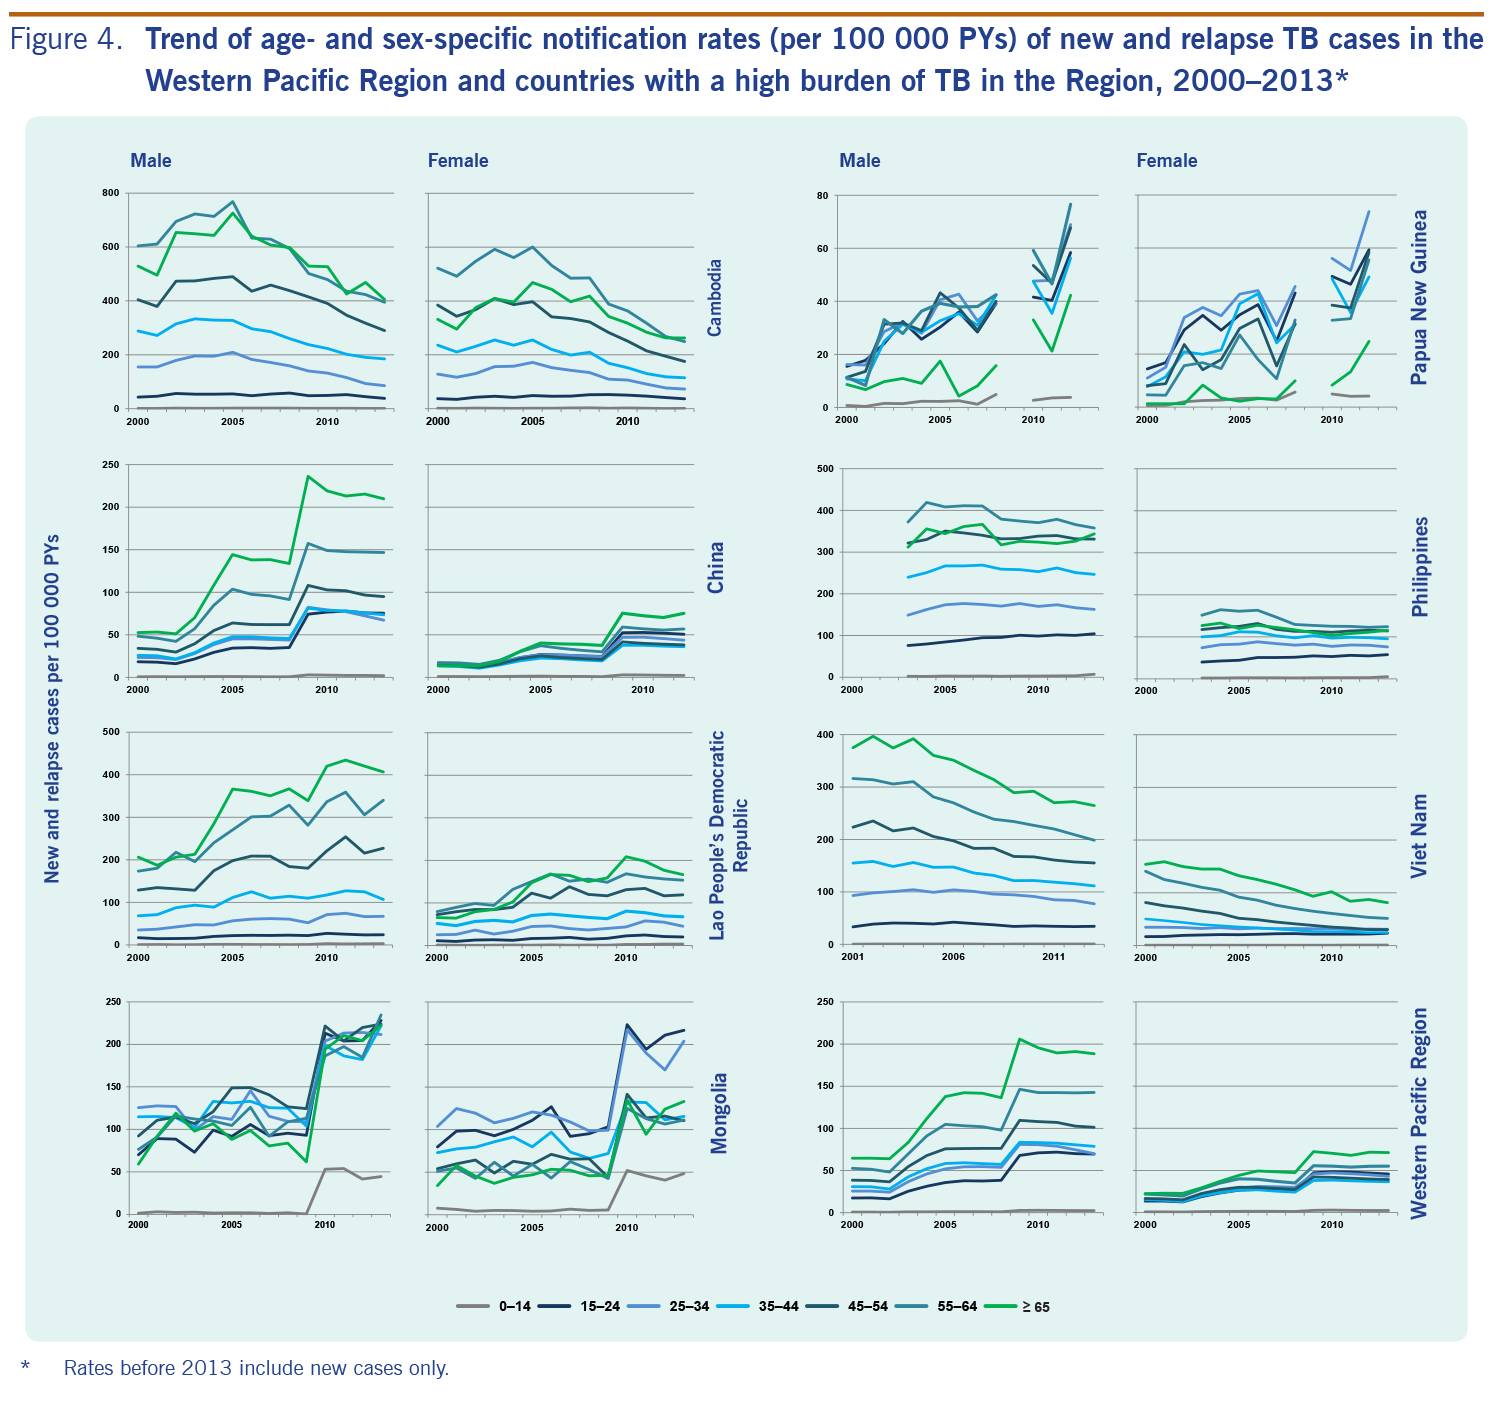
Figure 4 shows trends of notification rates of new bacteriologically confirmed cases of age- and sex-specific groups in the Region and seven countries with a high burden of TB from 2000 to 2013. Cambodia and Viet Nam demonstrated a declining trend for all age- and sex- groups, ordered youngest to eldest with distinct separation, except for female cases in Viet Nam, where the three youngest age groups plateaued while the older age groups declined. Case rates in the Philippines trended toward convergence with rates increasing in younger age groups and decreasing in older age groups. The ≥ 65 age group in the Philippines had rates similar to that of the 45–54 age group. Rates in China differed by sex. Male cases nearly maintained the order of youngest to eldest; female cases aged 15–24 years broke the order and were more similar to the 55–64 age group. The trends in Mongolia and Papua New Guinea were less distinct and did not follow the youngest to eldest order.
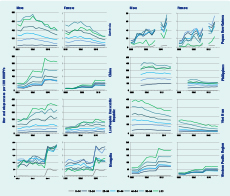
* Rates before 2013 include new cases only.
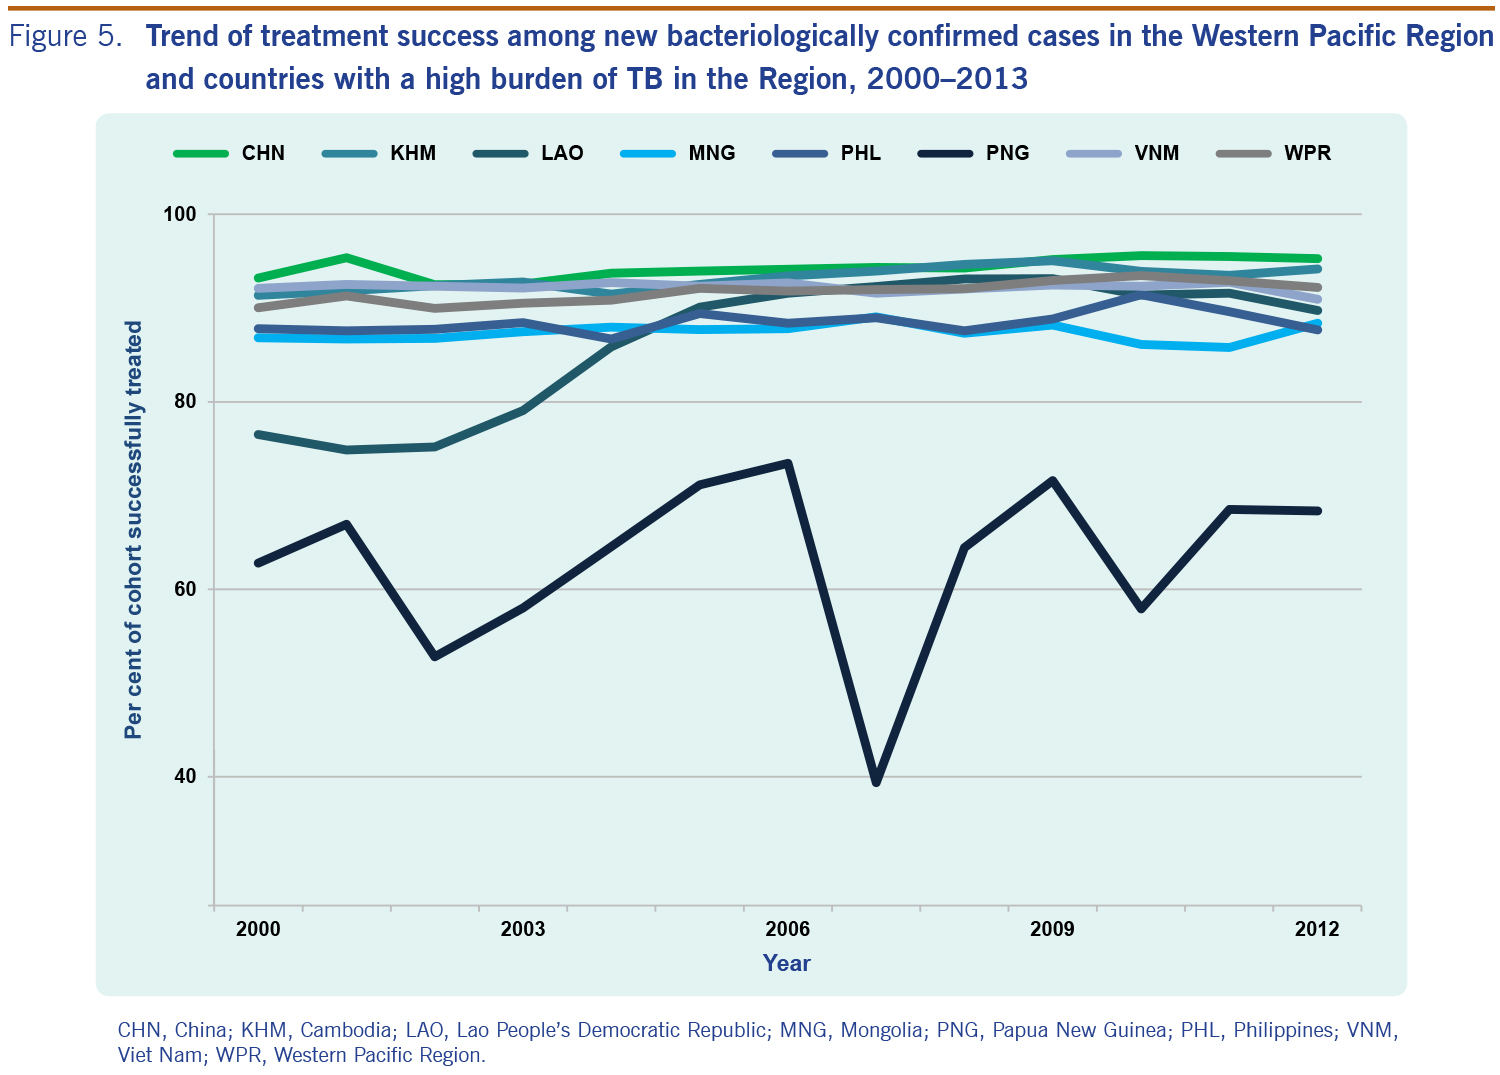
The overall trend of TB treatment success in the Western Pacific Region continues to be over 85% (Figure 5) since 1997. Across the Region, 16 countries and areas reached or maintained an 85% (or higher) treatment success in 2012. Among the seven countries with a high burden of TB, treatment success was highest in China (95%) followed by Cambodia (94%), Viet Nam (91%), the Lao People’s Democratic Republic (90%), Mongolia (88%) and the Philippines (88%). The treatment success rate of Papua New Guinea was the lowest at 68% with approximately one quarter of the 2012 cohort either lost to follow-up or un-evaluated. The proportion of 2012 notified cases that were not reported as being put on treatment was highest in Papua New Guinea, the Lao People’s Democratic Republic and Cambodia with 85%, 5.4% and 4.7%, respectively.
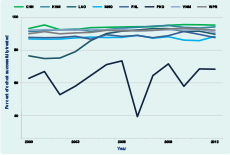
CHN, China; KHM, Cambodia; LAO, Lao People's Democratic Republic; MNG, Mongolia; PNG, Papua New Guinea; PHL, Philippines; VNM, Viet Nam; WPR, Western Pacific Region.
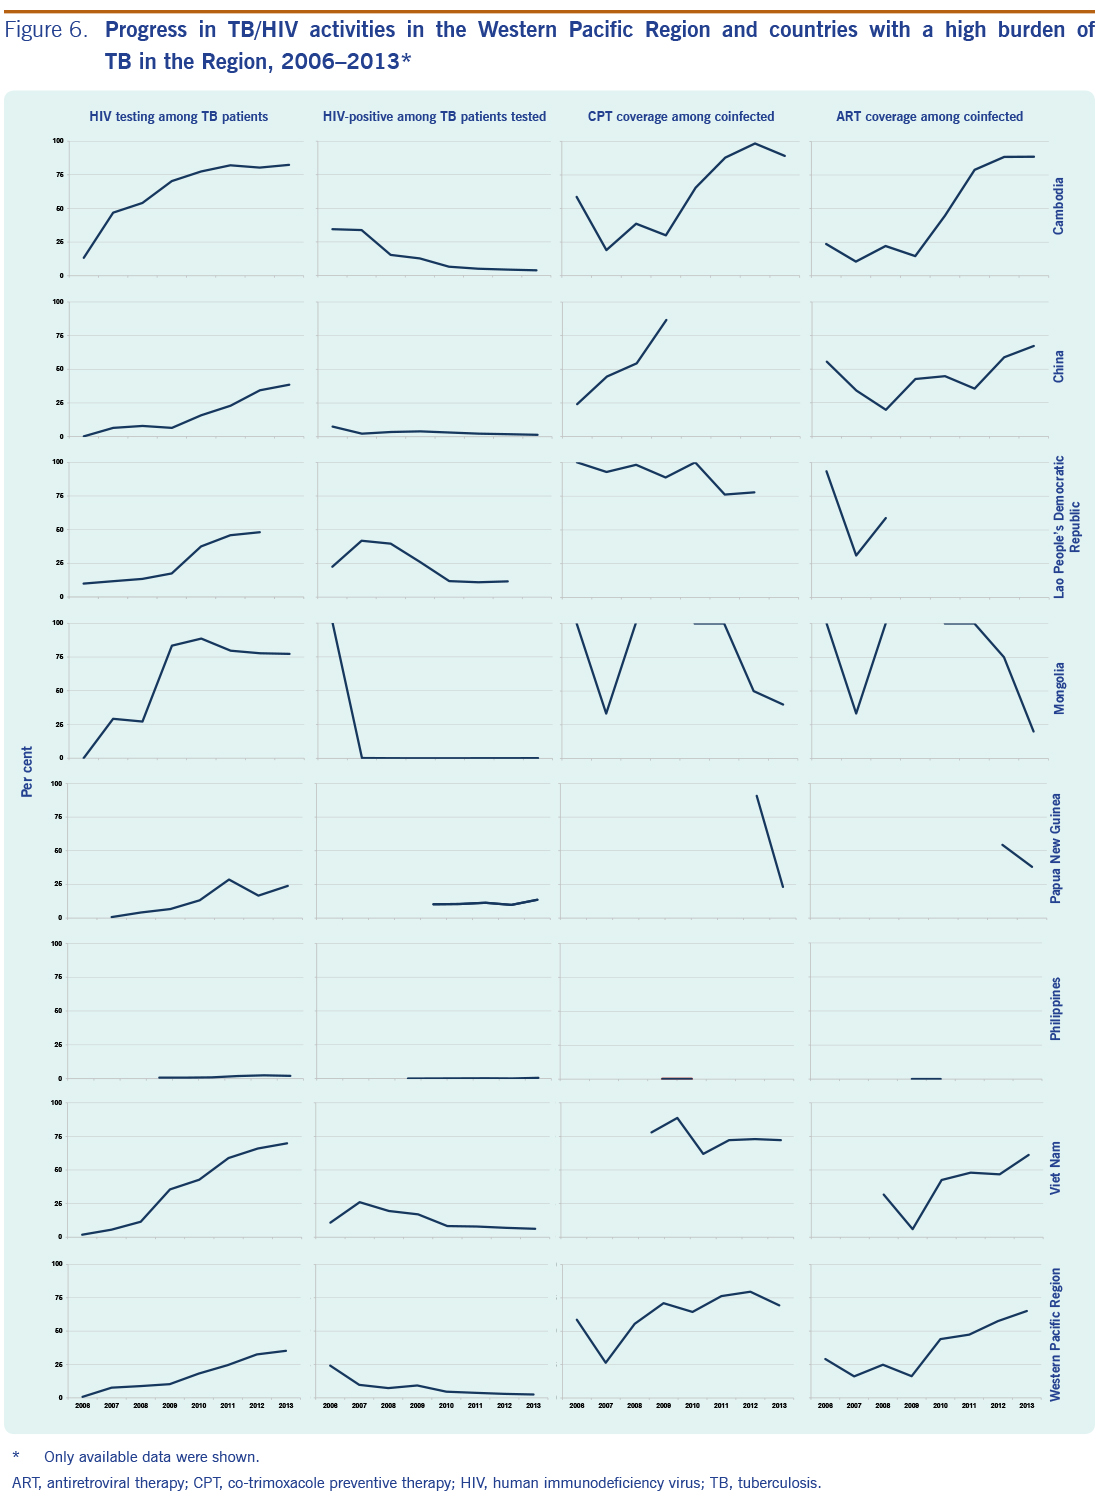
Figure 6 summarizes the four basic indicators (HIV testing, HIV positivity rate, CPT coverage and ART coverage) for the Region and seven countries with a high burden of TB in the Region. Overall, HIV testing in the Region had steadily increased from 0.72% in 2006 to 35% in 2013. The proportion of TB/HIV cases had steadily declined from 24% in 2006 to 2.5% (equivalent to 11 432 cases) over the same period. CPT coverage increased from 2007 to 2009, levelled off between 64% and 80%, and possibly declined in 2013. ART coverage had also increased, reaching the highest point in 2013 at 65%.
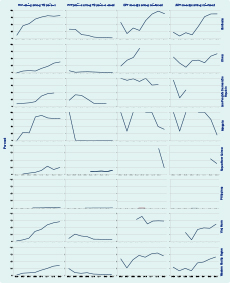
* Only available data were shown.
ART, antiretroviral therapy; CPT, co-trimoxacole preventive therapy; HIV, human immunodeficiency virus; TB, tuberculosis.
Cambodia and Viet Nam reported the most comprehensive data completeness and programmatic progress. The coverage of HIV testing, CPT and ART progressively increased with a steady decrease in the proportion of HIV-positive individuals among TB cases in these two countries. Mongolia also reported a high level of HIV testing with no more than five positive cases per year since 2006. HIV testing was the lowest (2.1%) in the Philippines in 2013, detecting the second lowest proportion of HIV-positive cases (0.52%) after Mongolia. The next lowest proportion tested was Papua New Guinea (24%) but with the highest proportion (14%) of HIV-positive cases among those TB cases tested.
The overall level of new and relapse TB notified cases (all forms) from countries and areas of the Western Pacific has held steady for the past several years (Figure 2). In contrast, the rate of new bacteriologically confirmed cases gradually declined by 1.9% from 2005 to 2010 but accelerated to 8.2% from 2010 to 2013. The difference in these trends suggests that true TB incidence is possibly declining while programme efforts for early case-finding, including clinically diagnosed cases, are increasing. Increased case-finding efforts can result in a lower proportion of cases with bacteriological confirmation as some cases are found before the bacterial load increases to a detectable level.6 The proportion of cases bacteriologically confirmed among all TB cases decreased from 52% in 2005 to 37% in 2013.
Two changes in the recording and reporting framework influence the last data point in this trend of bacteriologically confirmed TB cases. First, the trend-line previous to 2013 only included smear microscopy as a method of laboratory confirmation. Starting in 2013, any form of laboratory confirmation was included in this indicator, including more sensitive diagnostics. This may be responsible for the slight increase of TB cases in 2013. Second, clinically diagnosed TB cases were either disaggregated by smear-negative and smear-unknown or not done before 2013. This gave some information around the certainty of the cases diagnosed. From 2013 onwards, this disaggregation is no longer included in annual reporting. The proportion of non-bacteriologically confirmed cases who were not tested is unknown. Between 2008 and 2012, this proportion was small at the regional level (with a maximum of 1.4% cases who did not have a smear result in any given year). However, the proportion was high in some countries and areas (35%, 25% and 23% in Papua New Guinea, Guam and Republic of Korea, respectively). The changes in the recording and reporting framework also affected TB notification data disaggregated by age and sex. Prior to 2013, notifications by age and sex were further disaggregated by site of the disease (pulmonary or extrapulmonary) and by smear status (smear-positive and smear-negative/unknown/not done) for pulmonary cases. These data were only collected for new TB cases. Since the introduction of the revised recording and reporting framework, this further disaggregation was discontinued in favour of one table having age and sex data and including relapse cases. Besides restriction on more granular analysis, this also affects the time trend of notifications as relapse cases are now included. This also increases uncertainty around diagnosed cases since clinically diagnosed cases may not be actual TB cases.
TB control under stable conditions frequently results in TB case rates that increase with age as individuals have more time to be exposed to the disease and for the disease to develop.7 Most countries in Figure 3 follow this pattern. Slight deviations from this pattern may be attributed to inaccuracies in population estimates; however, the pattern in Mongolia showed rates in the 15–34 year age group were much higher than expected and warrants further investigation. The male-to-female ratio varies substantially among countries and areas in the Region. The reason for these differences is likely a combination of biological and social factors.8 However, despite the efforts taken to understand the role of gender in TB epidemiology,9,10 much is still unknown. In situations where the demographic composition, specifically age and sex, is changing over time, the crude TB notification rate may not present a clear picture of epidemiological trends. The TB rates may be decreasing in all age groups, but if the mean age of the population is increasing, thus moving a larger proportion of the population into older age groups where TB rates are highest, the crude trend may show no decline or even an increase. For this reason, examining age- and sex- specific case notification rates may provide more insight into the underlying epidemiology.
With the disaggregated view of TB notifications in Figure 4, it appears probable that TB incidence in Cambodia and Viet Nam is indeed declining. Both countries reported the age and sex breakdown only for bacteriologically confirmed cases, and the proportion of cases tested is continuously high. These reductions, in light of sustained programme performance, would be difficult to explain otherwise. WHO global estimates and other studies have come to similar conclusions.11,12
TB treatment success has remained high for six of seven high-burden countries in the Western Pacific Region since 2005. In addition to patient benefit, this high level of success will help drive the TB incidence downward if patients are put on treatment early. The trend for treatment success is erratic in the remaining high-burden country, Papua New Guinea, with a large proportion of cases not put on treatment and a large number of patients lost to follow-up or not evaluated. The high number of cases not put on treatment is also a concern in the Lao People’s Democratic Republic and Cambodia, although if these cases were included in the treatment cohort, treatment success would still be over 85%.
An estimated 32 000 (range: 29 000–36 000) people living with HIV develop TB every year in the Region.1 Although the HIV burden in the Region remains comparatively low, coinfection of HIV and TB poses a dangerous threat. Collaborative TB/HIV services are vital to save lives. HIV testing continued to increase gradually, but it was still below 50% in 2013. CPT coverage levelled off and perhaps began to decline, representing a possible risk for essential services. ART coverage increased but still shows major gaps in most countries in the Region.
Many countries reported case data stratified by age for bacteriologically confirmed cases only, although WHO has been requesting this information since 2006.13 This obscures the number of young children detected and poses a great limitation to the analysis of notifications by age and sex. Bacteriological confirmation is much rarer in young children due to difficulty in producing sputum. With the expanding coverage of central case-based recording and reporting systems, these data are becoming more available. Also, analysis of surveillance data has inherent limitations. While the primary aim of TB surveillance is to provide insights into the TB situation in a specific population, under-capturing systems often reflect more the fluctuating performance of the TB control programme than the epidemiology of TB in the population. Systems meeting minimum standards of quality for their TB surveillance systems14 provide more robust estimates of disease burden and can be used as a proxy for TB incidence, which has not yet been directly measured in any country. A careful assessment of programmatic progress and the quality of surveillance data for each country is needed when interpreting these findings.
This report provides a snapshot of the epidemiological and programmatic situation of TB in the Western Pacific Region based on the case notification data in 2000–2013. TB surveillance continues to be an important source of information for assessing the TB situation and measuring progress to inform decision-making. The WHO Regional Office for the Western Pacific will continue to conduct regional analyses on various topics related to TB epidemiology and programmatic progress such as the situation of drug-resistant TB, subnational data analysis and utilization, TB in low- and intermediate-burden countries, contact investigation and other forms of TB screening activities to stimulate the utilization of surveillance data for informed programme decision-making. WHO also will continue to provide support to countries for conducting epidemiological and programmatic assessments at national and subnational levels.
In response to calls for transparent and reproducible research,15,16 we have published the programme code to generate the entire contents of this article including all figures and tables by using R with the knitr package version 1.10.5 (Yihui Xie, 2015). Readers can download the code (available on request) and reproduce all figures and tables under an appropriate personal computing environment. For noncommercial purposes, readers may modify the code to produce figures and tables that are not presented in this article. For instance, readers may wish to produce tables and figures for countries or regions other than the WHO Western Pacific Region.
None declared.
None.
The authors are grateful to the national TB control programmes of the countries in the Western Pacific Region.