a Australian National University, National Centre for Epidemiology and Population Health, Research School of Population Health, Canberra, Australia.
b Research, Evidence and Information Programme, Public Health Division, Secretariat of the Pacific Community, Noumea, New Caledonia.
c Population Health Division, Australian Capital Territory Health, Canberra, Australia.
d Australian National University Medical School, Canberra, Australia.
Correspondence to Kerri Viney (email: kerri.viney@anu.edu.au or kerri.viney@hotmail.com).
To cite this article:
Viney K et al. The epidemiology of tuberculosis in the Pacific, 2000 to 2013. Western Pacific Surveillance and Response Journal, 2015, 6(3). doi:10.5365/wpsar.2015.6.1.001
Objective: Tuberculosis (TB) poses a significant public health challenge in the 22 Pacific island countries and territories. Using TB surveillance data and World Health Organization (WHO) estimates from 2000 to 2013, we summarize the epidemiology of TB in the Pacific.
Methods: This was a descriptive study of incident TB cases reported annually by Pacific island national TB programmes to WHO. We counted cases and calculated proportions and case notification rates per 100 000 population. We calculated the proportion of TB patients who completed TB treatment and summed estimates of national incidence, prevalence and mortality, provided by WHO, to produce regional incidence, prevalence and mortality rates per 100 000 population.
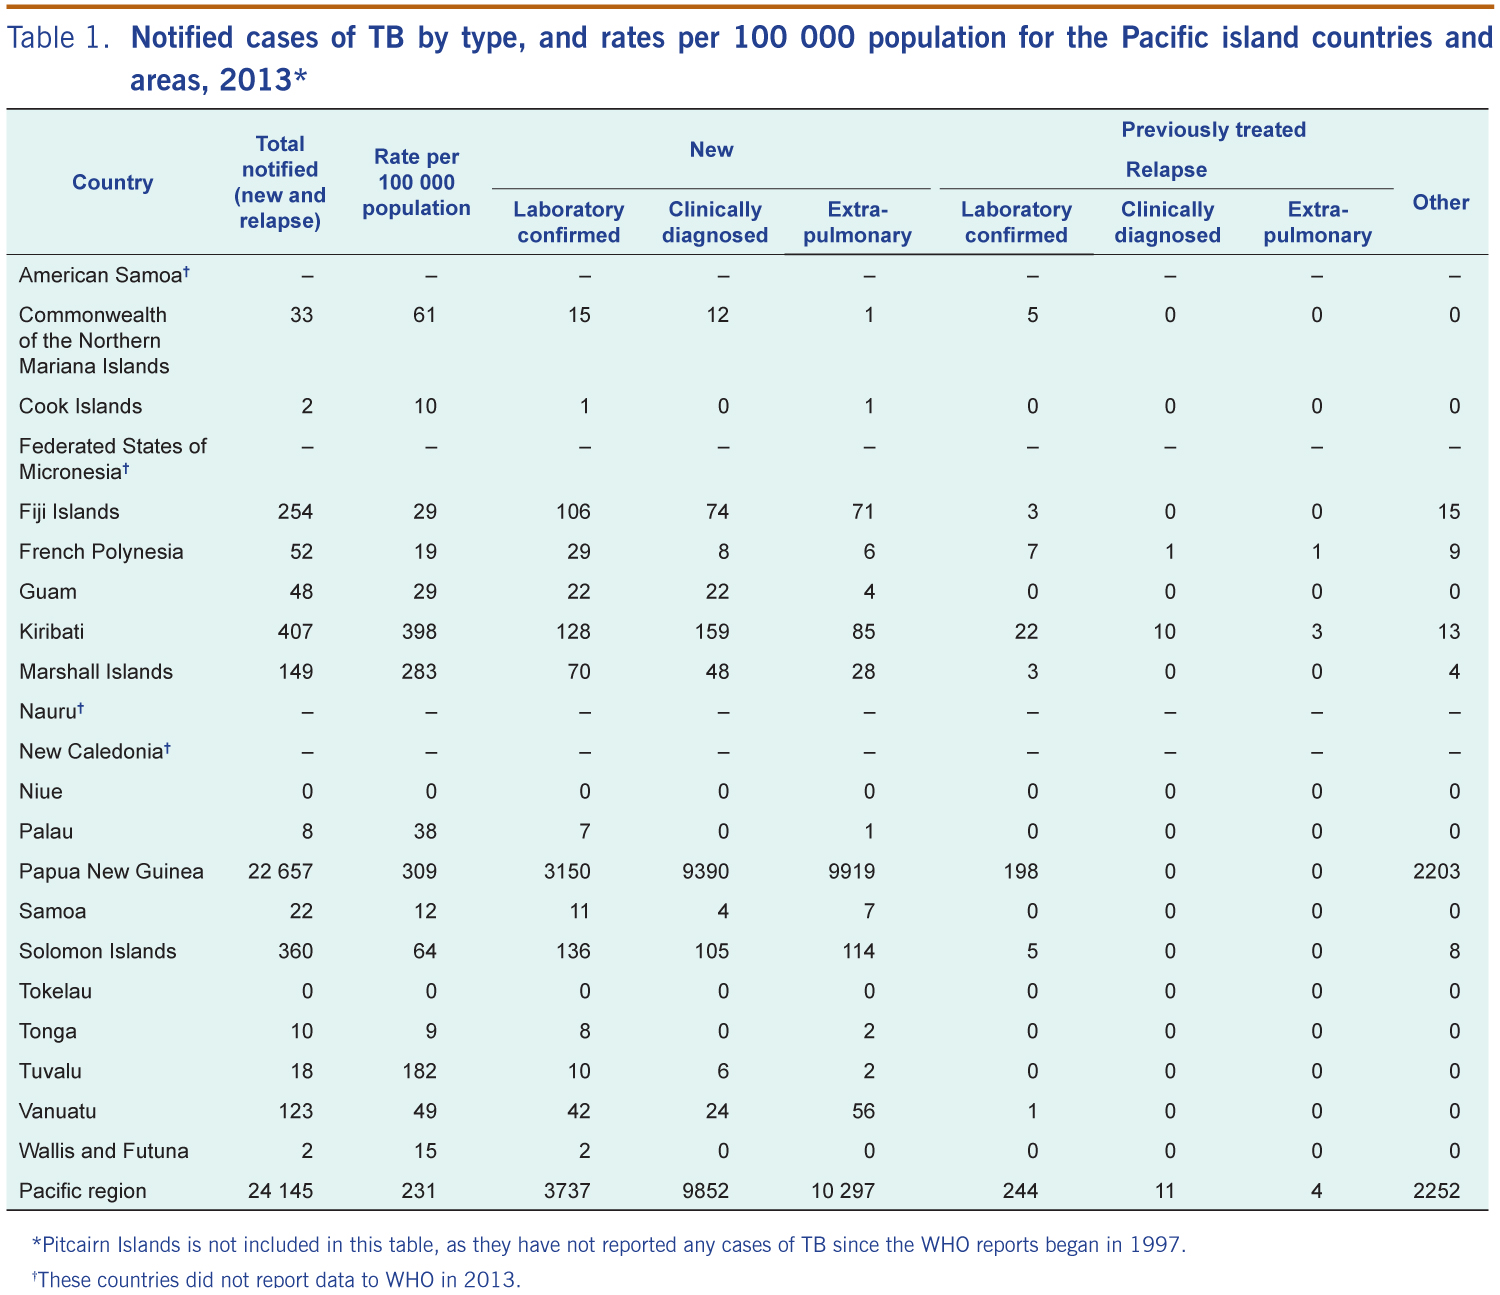
Results: Estimated TB incidence in the Pacific has remained high but stable from 2000 to 2013; estimated prevalence and mortality have fallen by 20% and 47%, respectively. The TB case notification rate increased by 58%, from 146 to 231 per 100 000 population in the same time period. In 2013, 24 145 TB cases were notified, most (94% or 22 657) were from Papua New Guinea. Kiribati had the highest TB case notification rate at 398 cases per 100 000 population. TB case notification rates were also high in Papua New Guinea, the Marshall Islands and Tuvalu (309, 283 and 182, respectively).
Discussion: TB in the Pacific is improving in some areas; however, high rates affect many countries and the estimated regional incidence rate is stable. To further reduce the burden of TB, a combination of dedicated public health and system-wide approaches are required along with poverty reduction and social protection initiatives.
Tuberculosis (TB), one of the world’s most important infectious diseases, continues to burden people in the Pacific. Annually, approximately 15 000–20 000 people are diagnosed with TB in the region, and 15% more go unreported.1,2 TB case notification rates vary greatly between Pacific island countries and territories.1,2 Further, some Pacific island countries and territories have managed to reduce the burden of TB in recent years, while in other countries the TB case notification rate has increased dramatically.1,2 Both epidemiological situations may represent improvements in TB case finding, prevention and care.
The Pacific region, as defined in this paper, comprises 22 countries and areas3 with approximately 10 million residents; about 7 million are in Papua New Guinea.4 The region includes thousands of islands scattered over a vast area of 8.5 million square kilometres and is divided into three subregions based on ethnic, linguistic and cultural differences: Melanesia, Micronesia and Polynesia.
The Pacific island countries and territories have mixed economies and are mostly classified as middle-income (US$ 1036 to US$ 4085 per capita).5 Health care is provided by governments and nongovernmental organizations with a small private sector contribution (excluding the contribution of traditional healers).6 Health systems are oriented towards primary health care but are often poorly funded and consequently struggle to meet population needs.6 The high cost of service provision to small and scattered population groups compounds these difficulties.6
Most Pacific island countries and territories have a dedicated national TB programme responsible for prevention, diagnosis and care. Due to their small size, Pitcairn Islands and Tokelau do not. Pacific island TB programmes aim for internationally recommended targets for TB elimination by 2050 as per the WHO Regional Strategic Plan to Stop TB in the Western Pacific: 2011–2015,7 the WHO Stop TB Partnership and the Millennium Development Goals (MDGs).8 Additional targets have been set for the global End TB Strategy designed for implementation after 2015.9,10
In 1995, WHO recommended the international TB control strategy, directly observed treatment short-course (DOTS),11 which was adopted by all Pacific island countries and areas in the subsequent years.2 By the year 2000, most had officially adopted this strategy and the associated standardized recording and reporting system. The six United States-affiliated Pacific island countries (American Samoa, Commonwealth of the Northern Mariana Islands, Federated States of Micronesia, Guam, Palau, and Republic of the Marshall Islands) are also aligned with the TB policies of the United States Centers for Disease Control and Prevention (CDC).12 All Pacific island countries and areas have a TB recording and reporting system using internationally accepted definitions.
There is limited published information on the epidemiology of TB in the Pacific, and progress towards international and regional TB targets requires further examination. WHO publishes annual global TB reports1 that report on global and regional TB trends and the epidemiology of TB in the 22 high-burden TB countries. However, they do not assess the epidemiology of TB in the Pacific islands as a whole. Therefore, we analysed this routinely collected TB data to better understand the epidemiology of TB in the Pacific and to assess progress towards TB targets as outlined in the Regional Strategic Plan.7
This was a descriptive study of TB surveillance data, assessing incident cases reported annually by Pacific island national TB programmes to WHO. We also described estimates of incidence, prevalence and mortality provided by WHO.1
The data source for this study was the annual TB surveillance data reported to WHO for the period 2000 to 2013.13 We chose the year 2000 as a baseline as many of the national TB programmes had adopted the DOTS strategy by this time and were using the associated recording and reporting tools. The year 2000 also serves as a baseline for selected TB indicators in the Regional Strategic Plan.7
The routinely collected TB data are collated and verified by Pacific national TB programme managers before being uploaded onto the WHO online TB data collection system. The reported variables cover clinical, microbiological, demographic and programmatic factors.13 Completeness and consistency of data are verified by WHO before public release. WHO also provides estimates of TB incidence, prevalence, mortality and case detection.13
Data were organized in Microsoft Excel and statistical analyses were carried out in Stata version 12 (Stata Corp 2011 College Station TX: StataCorp LP). We counted cases and calculated proportions and notification rates per 100 000 using population estimates provided to WHO by the United Nations Population Division. TB case notification rates comprised those who were registered as new or relapse unless otherwise stated. A new TB patient was defined as one who has never had TB or who has received less than one month of anti-TB drugs previously.14 A relapse TB patient was defined as one who was previously treated for TB, declared cured and has a recurrent episode of TB.14
Treatment success was calculated by summing TB cases who were cured and who completed treatment and dividing by the total number of notified cases for that particular year. The TB treatment outcomes of cured, treatment completed, failed, died and lost to follow-up were reported using WHO definitions.14
The case definitions used to categorize TB patients and their treatment outcomes changed in 2013;14 the revised definitions were used by Pacific island countries and territories to report to WHO in 2014. From 2013, TB patients were categorized as follows: bacteriologically or clinically diagnosed, further classified according to the anatomical site of disease, history of previous TB treatment, drug resistance and HIV status.13,14 Therefore, treatment success was calculated for patients with sputum smear-positive TB (until 2012) and those with bacteriologically confirmed TB for 2013, including those who were classified as new and relapse. Treatment completed was calculated for those with sputum smear negative and extrapulmonary TB until 2012 and for those with clinically diagnosed and extrapulmonary TB in 2013.
Country estimates for TB case detection, incidence, prevalence and mortality were provided by WHO; detailed methods for calculating these estimates are provided in the WHO annual global TB reports.13 WHO provides uncertainty intervals for TB case detection, incidence, prevalence and mortality; however, it is not recommended to sum these estimates. Therefore, uncertainty intervals are not reported.
This study used publicly available, routinely collected and anonymized surveillance data; therefore ethics approval was not required.
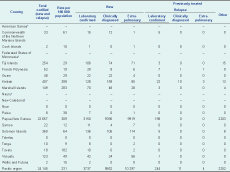
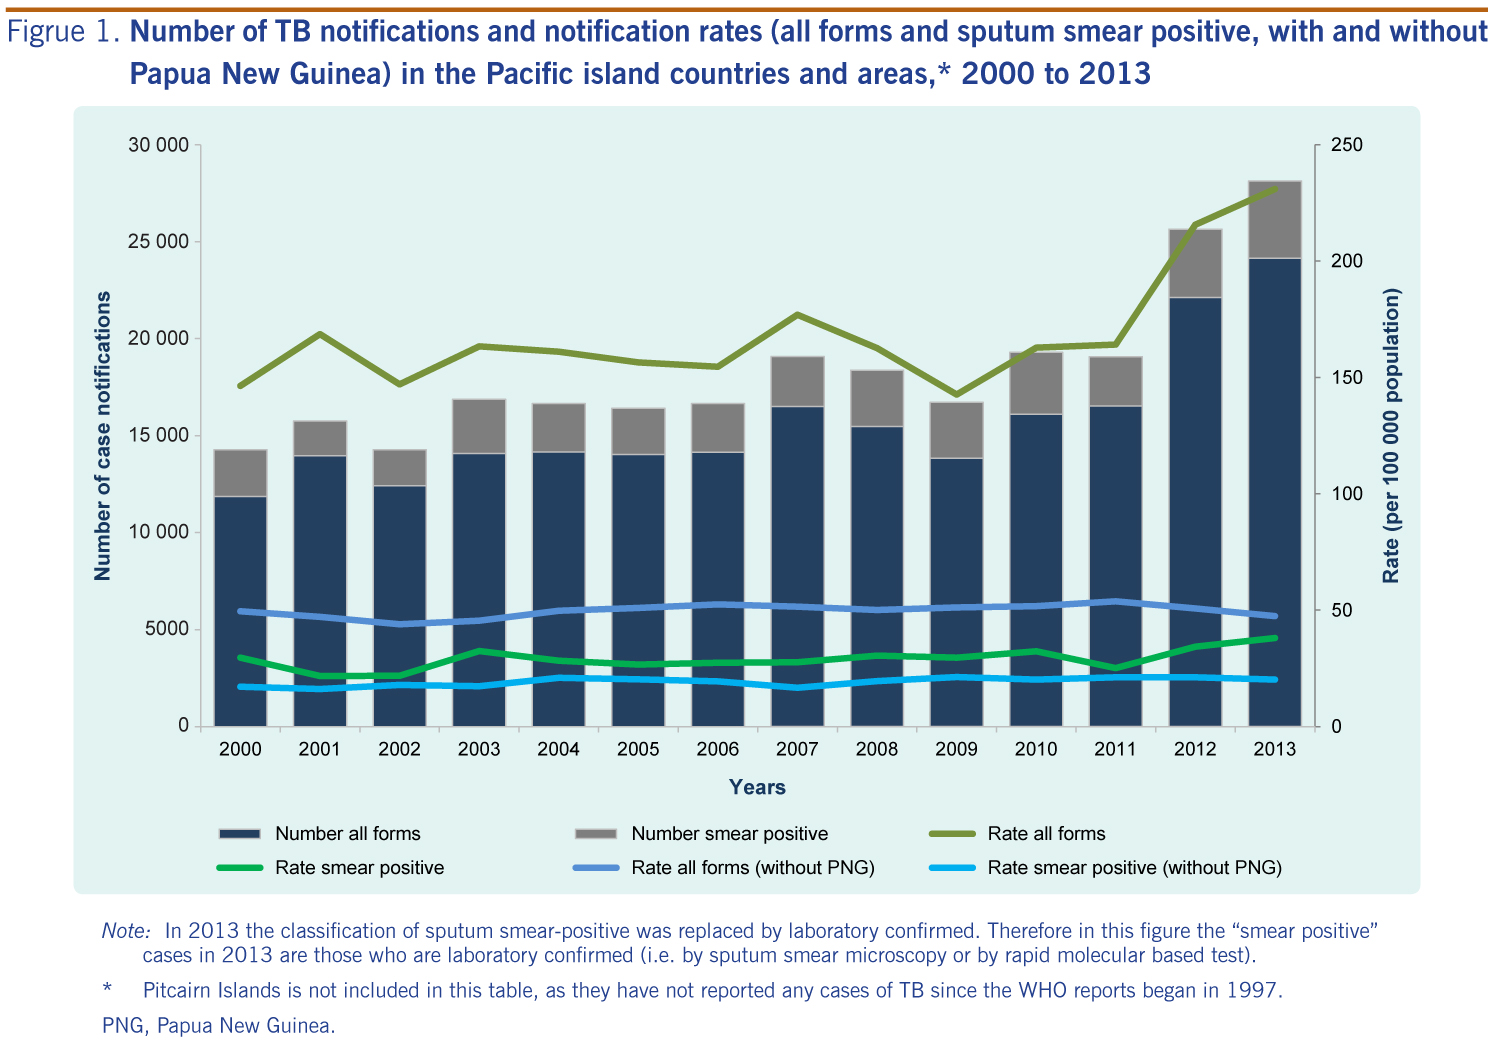
In 2013, 24 145 cases of TB (comprising new and relapse patients) were notified in the Pacific region. TB notifications in 2013 represented an 8% increase from 2012 with the majority being from Papua New Guinea (22 657; 94%). A further 3% (767) were from two other Pacific island countries: Kiribati (n = 407) and Solomon islands (n = 360) (Table 1).
* Pitcairn Islands is not included in this table, as they have not reported any cases of TB since the WHO reports began in 1997.
† These countries did not report data to WHO in 2013.
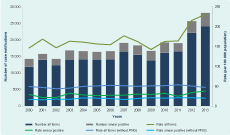
The highest case notification rate in 2013 was in Kiribati at 398 cases per 100 000 population. This was followed by Papua New Guinea, the Marshall Islands and Tuvalu with 309, 283 and 182 cases per 100 000 population, respectively (Table 1). The case notification rate for the whole region was 231 cases per 100 000 population (Figure 1). Almost all cases were classified as new (23 886; 99%), and 16% (n = 3981) of all cases were laboratory confirmed.
Note: In 2013 the classification of sputum smear-positive was replaced by laboratory confirmed. Therefore in this figure the “smear positive” cases in 2013 are those who are laboratory confirmed (i.e. by sputum smear microscopy or by rapid molecular based test).
* Pitcairn Islands is not included in this table, as they have not reported any cases of TB since the WHO reports began in 1997.
PNG, Papua New Guinea.
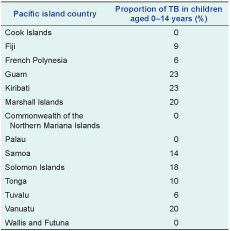
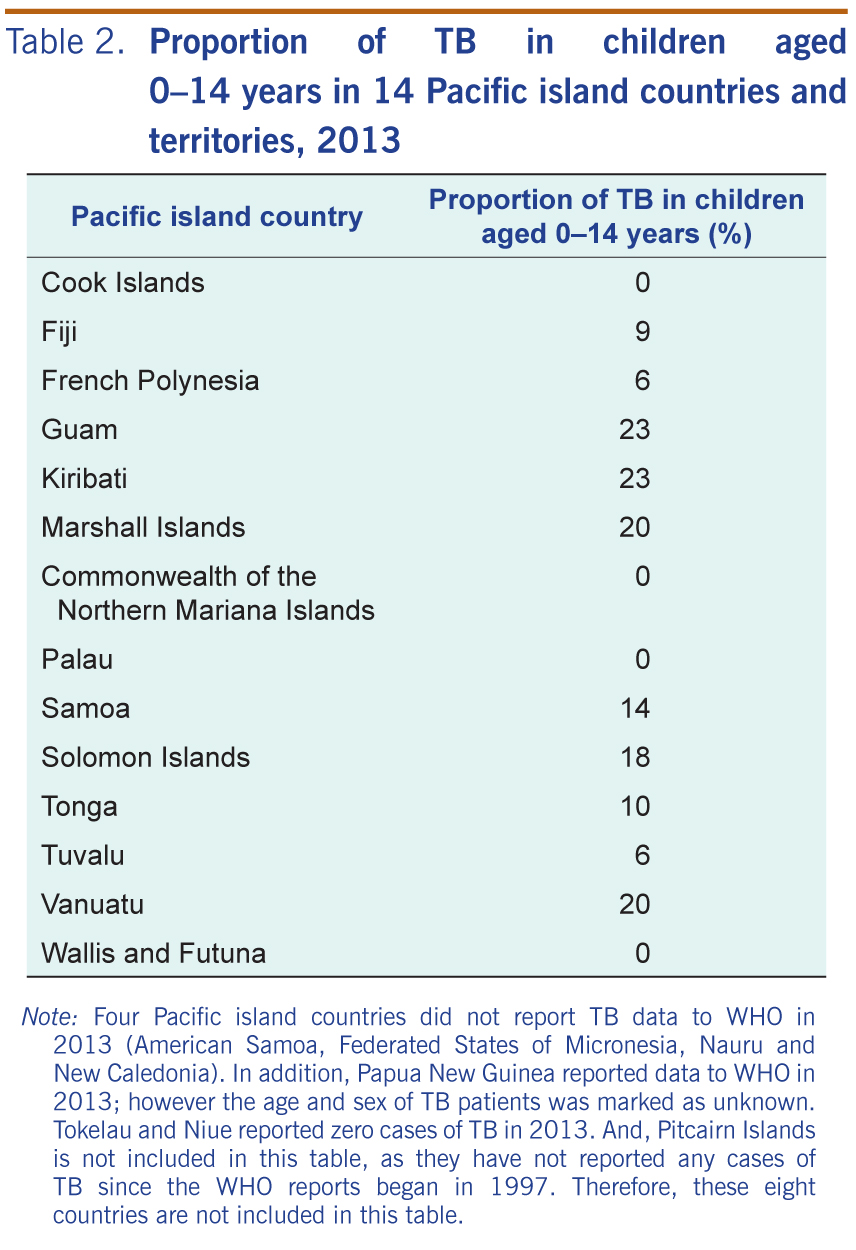
Fourteen Pacific island countries reported age and sex data to WHO for 1486 cases (6% of the total). Of these, 53% (n = 792) were male and 17% (n = 258) were children aged less than 15 years. Four countries reported 20% or more of their total TB caseload in children (Table 2).
Note: Four Pacific island countries did not report TB data to WHO in 2013 (American Samoa, Federated States of Micronesia, Nauru and New Caledonia). In addition, Papua New Guinea reported data to WHO in 2013; however the age and sex of TB patients was marked as unknown. Tokelau and Niue reported zero cases of TB in 2013. And, Pitcairn Islands is not included in this table, as they have not reported any cases of TB since the WHO reports began in 1997. Therefore, these eight countries are not included in this table.
TB case notifications almost doubled since 2000 when a total of 11 871 TB cases were notified (Figure 1). Accordingly, from 2000 to 2013 the TB case notification rate increased from 146 to 231 cases per 100 000 population (Figure 1). However, if Papua New Guinea data are excluded, the TB case notification rate per 100 000 population has fallen slightly over the same time period from 50 cases in 2000 to 47 cases in 2013 (Figure 1).
In 2013, a total of 6702 TB patients (28%) were tested for HIV; 5939 (89%) were from Papua New Guinea. Of all patients tested for HIV, 814 (12%) were HIV positive; 807 (99%) were from Papua New Guinea.
A total of 146 patients were diagnosed and treated for multidrug-resistant (MDR)-TB in the whole region in 2013; 84 (58%) were bacteriologically confirmed. Almost all of these patients were from Papua New Guinea (145; 99%) with one from the Marshall Islands. The number tested for MDR-TB was not reported. Also noteworthy was the report of six confirmed cases of extensively drug resistant (XDR)-TB, all from Papua New Guinea; a 50% increase on the four XDR-TB cases noted in 2012, the year extensive drug resistance was first reported for the Pacific region.
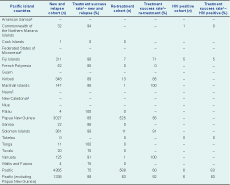
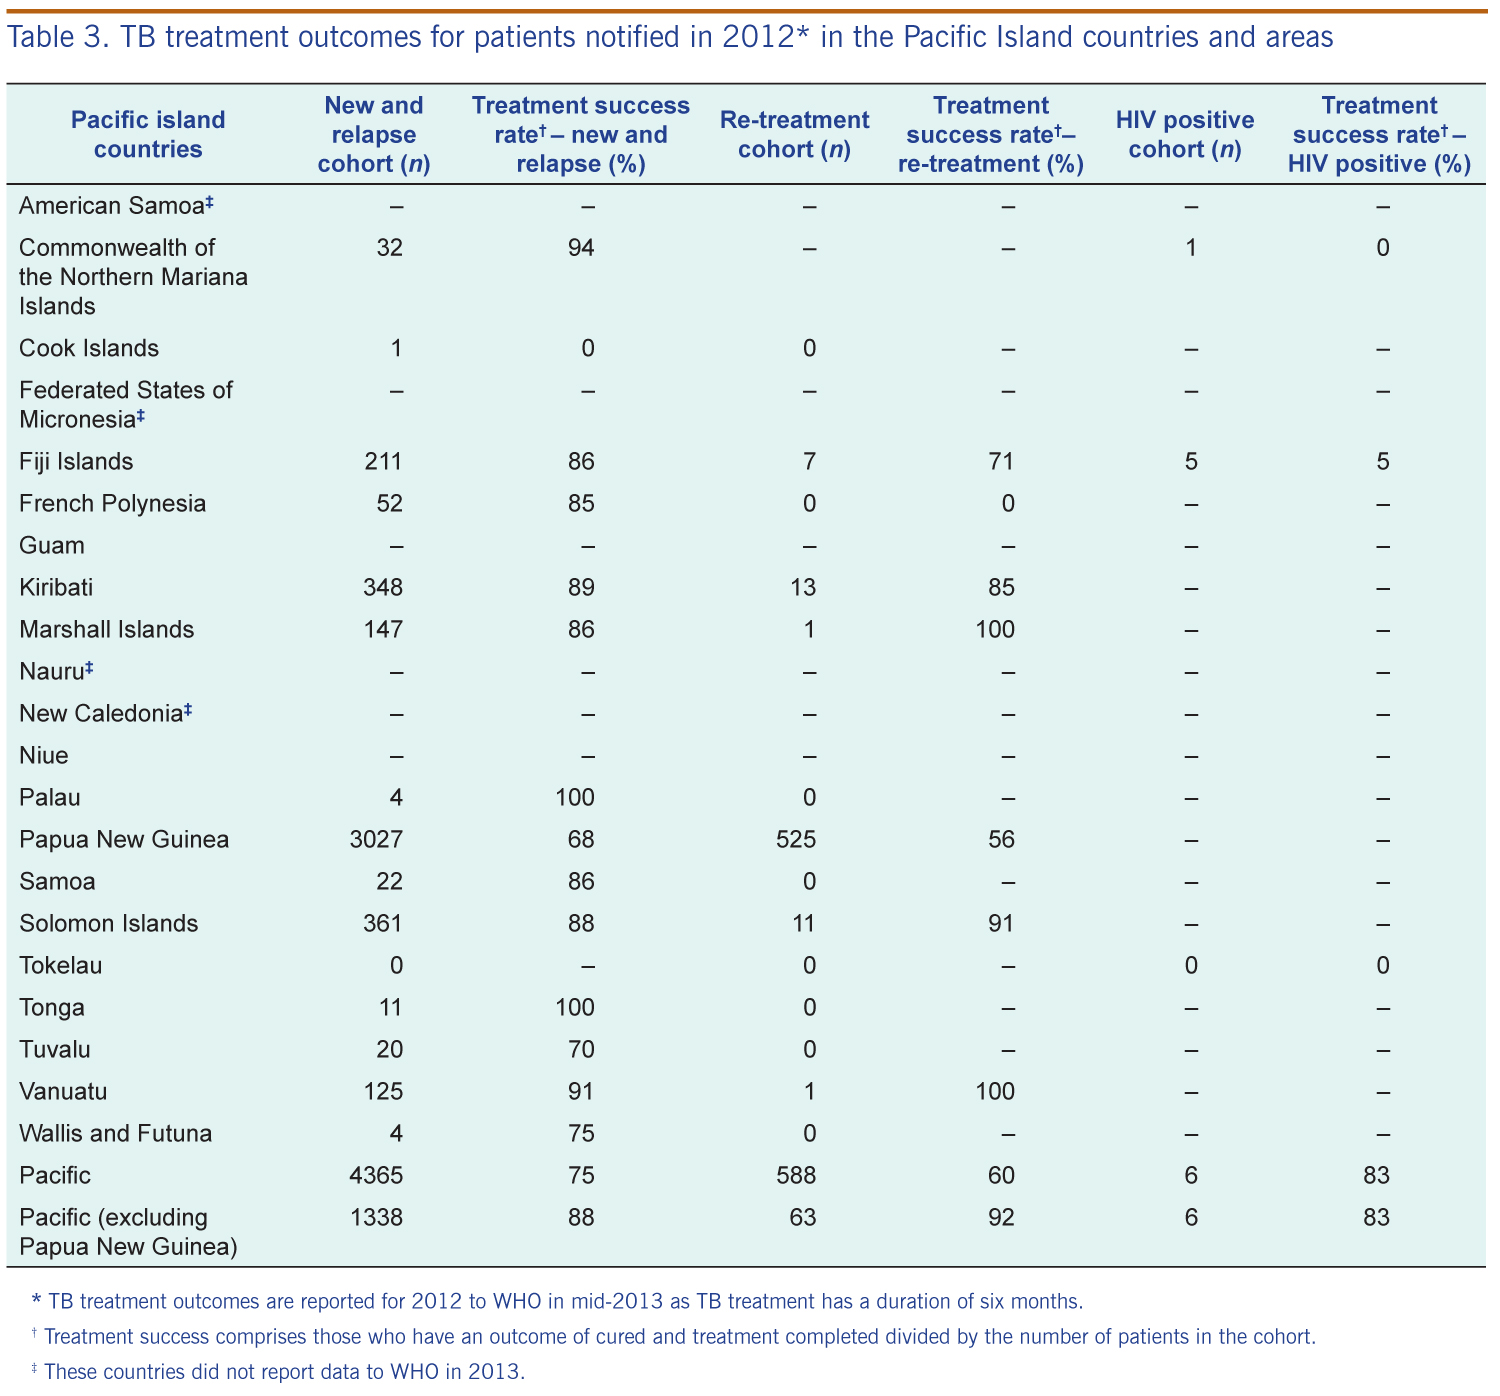
Information on TB treatment outcomes was available for only 4365 patients notified with TB in 2012 (20%) (Table 3). Of these 4365 TB patients, the treatment success rate for the whole region was 74% (range 68% to 100% for individual Pacific island countries and areas) (Table 3). Of the 894 patients with an unsuccessful TB treatment outcome, 5% died (n = 239), 2% had the TB treatment outcome of “treatment failed” (n = 73) and 15% were lost to follow-up (n = 652).
* TB treatment outcomes are reported for 2012 to WHO in mid-2013 as TB treatment has a duration of six months.
† Treatment success comprises those who have an outcome of cured and treatment completed divided by the number of patients in the cohort.
‡ These countries did not report data to WHO in 2013.
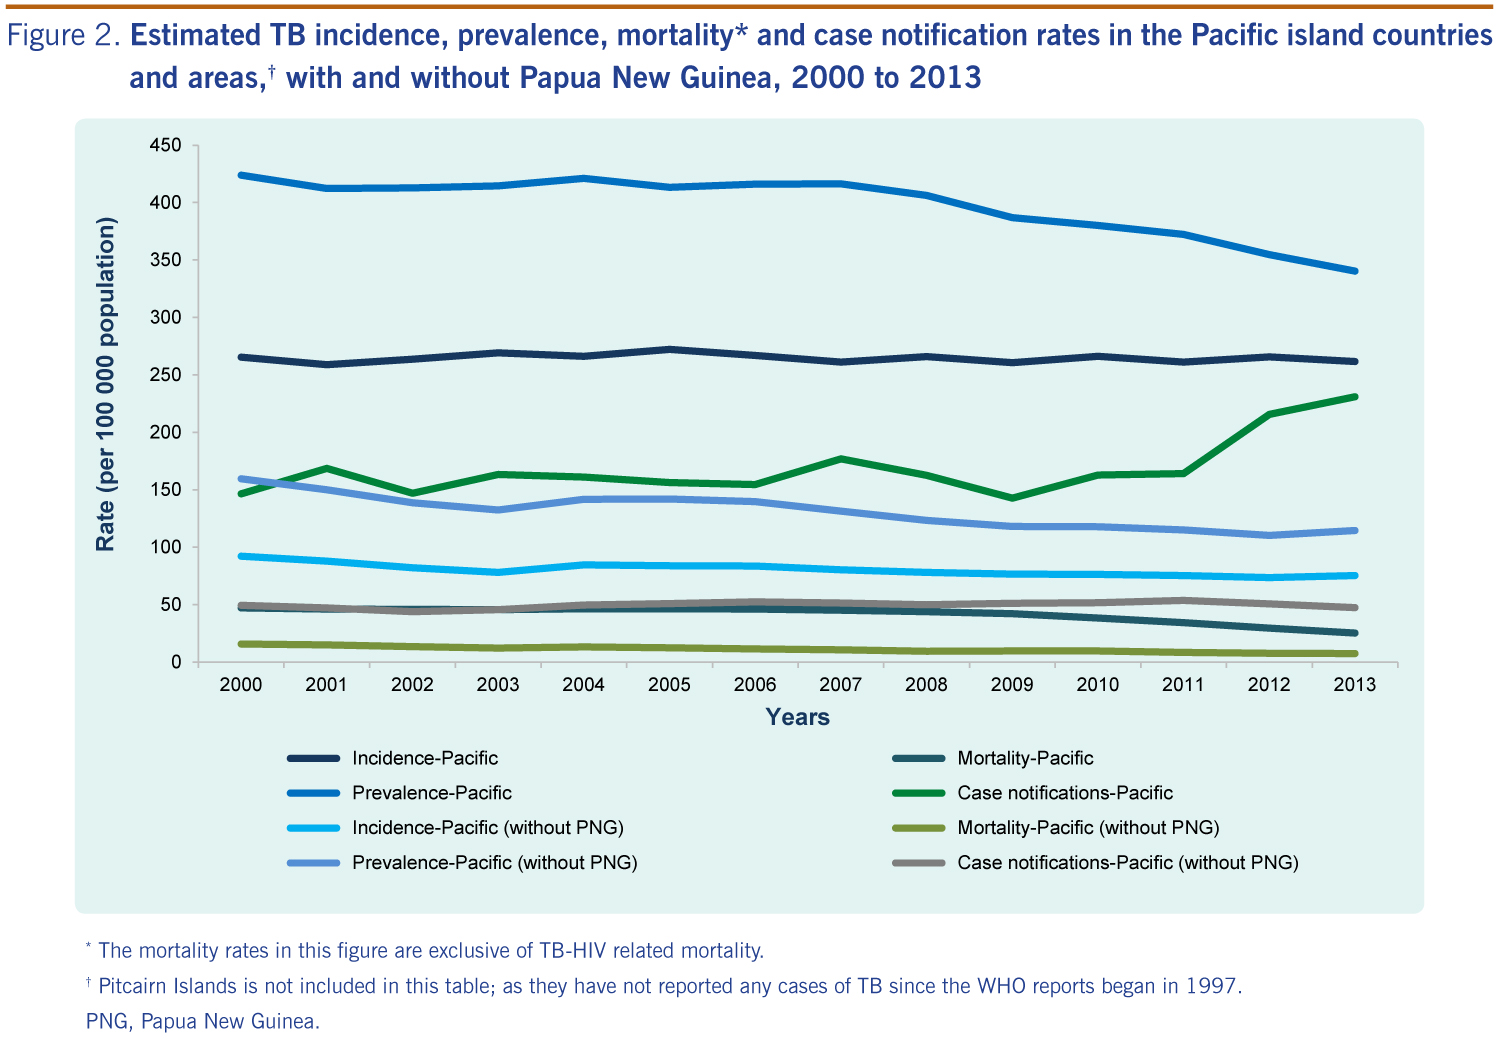
In 2013, the regional estimated TB incidence, prevalence and mortality rates were 262, 340 and 25 per 100 000 population, respectively (Figure 2). The highest estimated incidence and prevalence rates were in Kiribati at 498 and 752 cases per 100 000 population, respectively. The highest mortality rate was in the Marshall Islands at 40 cases per 100 000 population. Across the region, the average case detection rate was 85% (range 72% to 100% in individual Pacific island countries and areas). Since the year 2000, the estimated incidence rate has been stable (Figure 2). Prevalence and mortality rates both fell during the period 2000 to 2013 (Figure 2). The prevalence rate decreased by 20%, from 424 to 340 per 100 000 population and mortality fell by almost half (47%) from 47 to 25 per 100 000 population (Figure 2). When data from Papua New Guinea were excluded, estimated incidence, prevalence and mortality rates decreased by 18%, 28% and 52%, respectively.
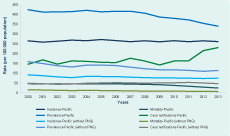
* The mortality rates in this figure are exclusive of TB-HIV related mortality.
† Pitcairn Islands is not included in this table; as they have not reported any cases of TB since the WHO reports began in 1997.
PNG, Papua New Guinea.
Globally, TB case notification and incidence rates have been falling; therefore, the MDG target for a reversal in TB incidence by 2015 has already been achieved.1 However, in the Pacific region, TB case notification rates have been increasing since 2000 due to increases in Papua New Guinea and in the Pacific subregion of Micronesia (most notably in the Marshall Islands and Kiribati). Across the Pacific, the estimated TB incidence rate has remained stable, and there have been impressive declines in TB prevalence and mortality rates. If data from Papua New Guinea are removed from the regional total, all three indicators have improved, indicating the influence of the data from Papua New Guinea on regional epidemiology.
The increase in TB notifications may be partly attributable to programmatic factors; DOTS was introduced in the region in 1998 but took several years to be uniformly implemented.2 Since 2000, some Pacific island countries and areas have introduced electronic recording and reporting systems, TB contact tracing and active TB case finding strategies, and more recently, new diagnostic technologies such as Xpert® MTB/RIF (a rapid molecular test) and liquid culture. Many of these interventions have been found to increase TB case detection.15–17 Other non-programmatic factors such as the ongoing process of urbanization and increasing rates of diabetes may also partly account for the increase in TB notifications, although we were not able to assess this in our study.
The largest increase in TB case notifications was recorded between 2011 and 2012: 16 541 and 22 130 cases, respectively, mostly due to a 38% increase in TB case notifications in Papua New Guinea.13 The increase is thought to be due to improved diagnostic services and strengthened recording and reporting practices made possible by a grant from the Global Fund to Fight AIDS, Tuberculosis and Malaria.18 From 2000 to 2013, the largest increase in TB case notifications, over 300%, was in the Marshall Islands.
Most Pacific island countries have a community HIV prevalence of less than 0.1% and very low rates of TB-HIV co-infection;13,19 Papua New Guinea has the highest HIV prevalence at 0.8%.20 Only 28% of TB patients notified in 2013 were tested for HIV, an improvement on 2012 when only 20% were. Due to this low proportion, the significance of HIV for TB in the region is therefore unclear. In Papua New Guinea, 25% of TB patients were tested for HIV in 2013 and 14% (807) were HIV positive. The small proportion tested for HIV implies uncertainty in estimation of HIV prevalence among TB patients in Papua New Guinea. Therefore, increased HIV testing is an important objective for national TB programmes, particularly in Papua New Guinea where the rate of HIV is higher than in other countries in the region.
Individual Pacific island countries and areas have very different burdens of TB; some countries have low and declining rates of TB and may therefore aim to eliminate TB. WHO recently identified a set of eight interventions designed for implementation by 30 countries with a low and declining incidence of TB.21 While the Pacific island countries and areas were not on this list, those with a low and declining TB burden may implement similar measures, including screening for active TB and latent TB infection in high-risk groups.21
Other countries such as Papua New Guinea, Kiribati and the Marshall Islands have a higher and increasing burden of TB, and a range of context-specific interventions will be important for TB prevention and care in these countries. Many interventions appropriate for Papua New Guinea were outlined during a recent programme review.18 These interventions include enhanced local ownership, improved health systems management, improved sputum-based diagnosis, retention of TB patients on treatment and better diagnosis and management of MDR-TB.18 Kiribati is scheduled for a national TB programme review in 2015. In the meantime, the Ministry of Health and Medical Services is implementing an active TB case finding programme (Personal communication, Dr Takeieta Kienene, Kiribati Ministry of Health and Medical Services).
Drug-resistant TB is an important TB control issue in the region,22 and to date, 221 people with MDR-TB have been detected in the Pacific.13 There were 146 patients with MDR-TB who started treatment in 2013 (of these, 84 were bacteriologically confirmed), but WHO estimated 1140 incident cases of MDR-TB.13 The majority of the region’s notified and bacteriologically confirmed MDR-TB patients (n = 73) are from Papua New Guinea where drug-resistant TB constitutes an urgent public health problem. MDR-TB has also been detected in a further nine Pacific island countries, including co-incidental outbreaks involving two different strains23 affecting a total of 42 patients in the Federated States of Micronesia (Personal communication, Dr Mayleen Ekiek, Federated States of Micronesia Ministry of Health and Social Affairs). Technical staff from the three main technical agencies in the region (i.e. CDC, the Secretariat of the Pacific Community and WHO) and other partners are collaborating on the development of interventions to prevent and minimize the impact of drug-resistant TB.
A high proportion of TB was detected in children in four Pacific island countries (i.e. Guam, Kiribati, the Marshall Islands and Vanuatu) with 20% or more of all TB occurring in paediatric patients. Age- and sex-specific data were incomplete for other countries, including Papua New Guinea, yet a recent programme review in Papua New Guinea found that the proportion of TB detected in children was 28%.18 A high proportion of paediatric TB may indicate that case detection in children is adequate (WHO estimates that paediatric patients should account for 5–20% of all TB case notifications in high burden settings);9 however, it also indicates transmission of TB within households and close contacts, and possibly, overdiagnosis of TB using clinical criteria alone. Further studies are needed to determine the burden and diagnostic practices of paediatric TB in the Pacific.
The case detection rate highlights that approximately 15% of all TB patients in the Pacific are never diagnosed. Globally, there are concerted efforts to ascertain and treat the 3 million cases undetected by national TB programmes.24 In the Pacific, active TB case finding will likely be a focus for selected national TB programmes in coming years by expanding access to TB care, including screening, diagnostic testing and treatment.24
There are several limitations to our study. We used routinely collected surveillance data which were incomplete. Data on age, sex and TB treatment outcomes were missing for over 80% of the 2013 TB cohort, introducing a potential for selection bias into our study. These estimates were affected by data from Papua New Guinea where age and sex data were reported as unknown, and TB treatment outcome data were not reported for all patients. In addition, four Pacific island countries did not report any data to WHO in 2013. These data may all be available at the country level and represent important data for evidence-led programming and policy-making. It is imperative that these data are reported to WHO on an annual basis as they represent one of the most comprehensive sources of information on TB trends and indicators at the regional level. Another limitation of this study is the limited scope. Detailed analyses in selected Pacific island countries were not possible. More detailed analyses may yield useful information for changes in local policy and practice.
In addition, individual Pacific island countries are at various stages of the epidemiological transition with different levels of income, development and TB burden.5,13 Therefore, recommendations based on the regionwide data may not suit specific country contexts. This represents another limitation of a regional analysis. We encourage staff from the Pacific island countries and areas with a significant burden of TB to strengthen their TB surveillance systems and subsequently analyse their own TB data to make specific policy recommendations about TB prevention and care at the national level.
TB case notifications are increasing in parts of the Pacific and there has been little change in the estimated TB incidence rate since the year 2000. Very high rates of TB were reported in Kiribati, Papua New Guinea, the Marshall Islands and Tuvalu. TB elimination remains unlikely across the region, although some Pacific island countries may achieve this target. To reduce the burden of TB in the region, Pacific island countries with a low and declining estimated incidence of TB may focus on early detection of active TB and latent TB infection and other key interventions recommended by WHO.21 In other Pacific island countries and areas with a high estimated incidence of TB, a combination of dedicated public health and system-wide approaches are needed along with initiatives aimed at reducing poverty. The region needs substantially improved surveillance of TB in all its forms to enable ministries of health and public health agencies to plan the most suitable responses.
None declared.
None.
We would like to acknowledge that these data have been downloaded from WHO website, available at: http://www.who.int/tb/country/data/download/en/. We also gratefully acknowledge the ongoing collaboration and contribution of the national TB programme managers to control TB in the Pacific region.