a NSW Ministry of Health, Sydney, New South Wales, Australia.
b Public Health Unit, Illawarra Shoalhaven Local Health District, New South Wales, Australia.
c Public Health Unit, Murrumbidgee and Southern NSW Local Health Districts, New South Wales, Australia.
d Communicable Disease Branch, Health Protection New South Wales Ministry of Health, Sydney, New South Wales, Australia.
e HIV and STI Branch, Centre for Population Health, NSW Ministry of Health, Sydney, New South Wales, Australia.
Correspondence to Michelle Cretikos (e-mail: mcret@doh.health.nsw.gov.au).
To cite this article:
Cretikos M et al. Testing-adjusted chlamydia notification trends in New South Wales, Australia, 2000 to 2010. Western Pacific Surveillance and Response Journal, 2014, 5(3). doi:10.5365/wpsar.2014.5.1.009
Introduction: Between 2005 and 2010, Australian notification rates for chlamydia infection increased by 64% from 203 to 333 per 100 000 population. Interpreting this trend is difficult without examining rates and local patterns of testing. We examined the effect of adjusting for local testing rates on chlamydia notification trends in New South Wales (NSW), Australia from 2000 to 2010.
Methods: We used testing data for NSW residents for Medicare Benefits Schedule items for chlamydia from 1 July 1999 to 30 June 2005 and 1 July 2007 to 30 June 2010. This data set excluded testing by public sector laboratories. We also obtained laboratory-confirmed genital chlamydia notifications in NSW residents for 1 July 1999 to 30 June 2010 and excluded notifications from public laboratories. We used negative binomial regression to assess trends in chlamydia notification rates by age and sex after adjusting for local government area (LGA)-level Medicare-funded testing rates, socioeconomic disadvantage, remoteness and Medicare provider density.
Results: Testing-adjusted rates of chlamydia notifications declined by 5.2% per annum (rate ratio [RR] = 0.95, 95% confidence interval (CI) = 0.93–0.96) for women overall, and 2.3% (RR = 0.98, 95% CI = 0.96–1.00) and 5.0% per annum (RR = 0.95, 95% CI = 0.93–0.98) for men in LGAs with moderate and high densities of Medicare providers, respectively. Notification rates remained stable for men in low Medicare provider density LGAs (RR = 1.01, 95% CI = 0.96–1.07).
Discussion: It is likely that increased testing for chlamydia has driven increases in chlamydia notification in NSW over the last decade. Notification data provide no evidence for a general increase in the prevalence of chlamydia in the NSW community for this period. Notification-based chlamydia surveillance should be routinely adjusted for local testing rates.
Chlamydia is a sexually transmitted infection caused by the intracellular bacterium Chlamydia trachomatis. Typically, infections are asymptomatic,1 resulting in a cycle of ongoing infection, transmission and reinfection.2 Chlamydia is a significant public health problem as a proportion of women with untreated infection may develop pelvic inflammatory disease, tubal infertility and ectopic pregnancies.3–5 Chlamydia infection also facilitates the transmission of HIV.6
Chlamydia is the most frequently notified condition in Australia with 74 305 cases of chlamydia notified in 2010 or 35.5% of all notifications nationally. Of these, 18 278 cases (24.6%) were notified from New South Wales (NSW). Between 2005 and 2010, Australian notification rates for chlamydia infection increased by 64% from 203 to 333 per 100 000 population. In 2010, notification rates were 1.4 times higher among females (384) relative to males (279) per 100 000 people overall. Chlamydia notifications are increasing most rapidly in people aged 15–19 years, with female and male notification rates in this age group growing by 75% and 114% between 2005 and 2010, respectively. Notifications in the 15–29 year age group accounted for approximately 80% of annual chlamydia notifications between 2005 and 2010.7
The rapid rise in chlamydia notifications has generated renewed public health focus on control strategies, including social marketing campaigns targeting young people and promoting safe sexual practices and screening for chlamydia by general practitioners and sexual health clinics.8,9 The increase in large-scale social marketing campaigns and promotion of screening presents a problem for notification-based chlamydia surveillance as variation in disease incidence cannot be distinguished from the underlying variation in rates of chlamydia testing.2,10 It is known that rates of chlamydia notifications are strongly associated with testing rates, as is the case for many notified conditions.11,12 When both testing and notification data are available, then notifications can be adjusted for area-level testing prevalence to assess trends in disease intensity and make comparisons to inform chlamydia epidemiology, surveillance and control.
The aim of the current study was to investigate the effect of chlamydia testing and area-level socio-demographic factors on trends in chlamydia notification over time among residents of NSW, Australia.
An ecological design was used to assess trends in chlamydia notifications over time by age and sex after adjusting for population testing rates in NSW using 2006 Australian Standard Geographical Classification (ASGC) Local Government Area (LGA) as the analysis unit. The LGA is an administrative boundary that in 2006 represented a median of around 20 000 residents. The LGA boundary for 2006 was used because LGA boundaries change over time and 2006 was the mid-point of the study period. The effects of socioeconomic disadvantage, medical provider density and remoteness on long-term trends were also examined.
The study population consisted of all persons aged 15 years and over in NSW between 1 July 1999 and 30 June 2010.
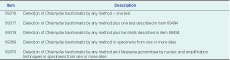
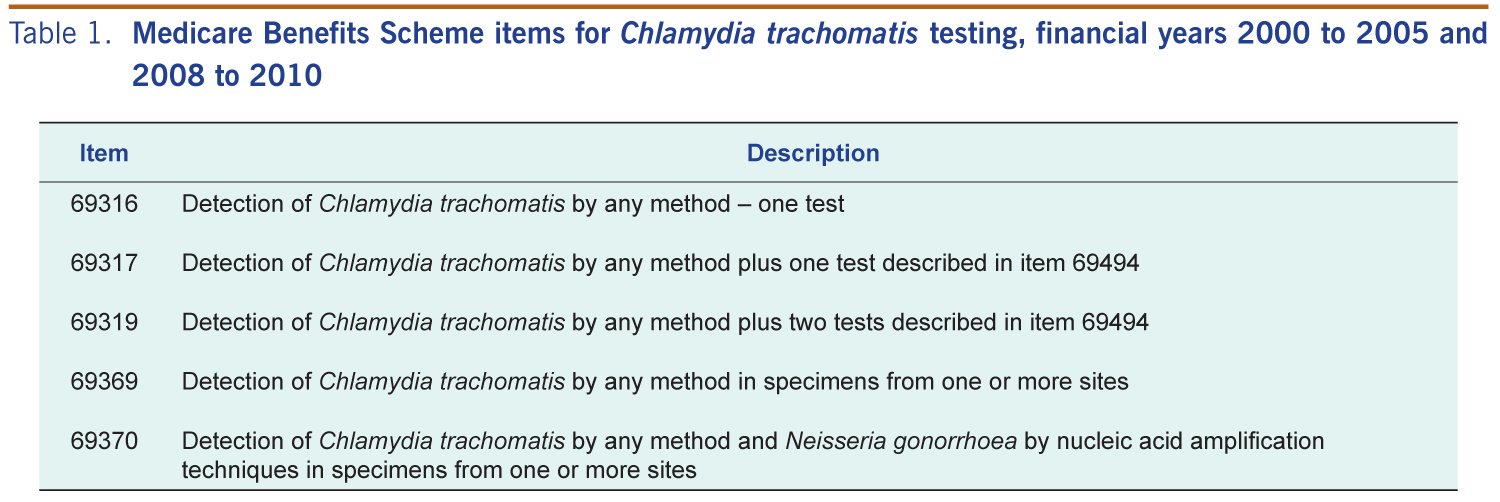
Chlamydia testing data were provided by the Commonwealth Department of Health and Ageing (DoHA) for Medicare Benefits Schedule (MBS) items 69316, 69317, 69319, 69369 and 69370 based on the patient’s LGA of residence at time of pathology testing (Table 1). This data set included all tests by private sector laboratories rebated by Medicare, the Australian Government universal health-care insurance, from 1 July 1999 to 30 June 2005 and 1 July 2007 to 30 June 2010 but excluded testing by public sector laboratories funded by the state health system over the same period. Data were not available for 1 July 2005 to 30 June 2007 because a common MBS item was used for all sexual health testing during this period and it was not possible to identify chlamydia tests.
Laboratories have been required to report all diagnoses of Chlamydia trachomatis infection in NSW since August 1998.13 Non-identifiable counts of laboratory-confirmed genital chlamydia notifications were provided by the NSW Ministry of Health for financial years 2000 to 2010 by financial year, sex, five-year age group, LGA of residence, test type and laboratory. To ensure consistency with the private sector laboratory testing data, the primary analysis was limited to notifications from private sector laboratories. A secondary analysis included all notifications to assess the sensitivity of observed trends and associations to the laboratory notification source (public or private).
Medical provider density was calculated for each LGA using counts of fulltime equivalent Medicare providers for financial years 2000 to 2010. An Australian financial year covers the period from 1 July to 30 June of the following calendar year. For each LGA, the total number of fulltime equivalent Medicare providers was divided by the total population aged 15 years and over and expressed as the number of providers per 10 000 population. The density distribution was divided into five equal parts. The bottom quintile was classified as “low access”, the top quintile as “high access” and quintiles two to four as “middling access”.
Area-level socioeconomic disadvantage was classified using the Index of Relative Socioeconomic Disadvantage (IRSD) from the 2006 Australian Census of Population and Housing. This index is a general socioeconomic index that summarizes a range of information about the economic and social conditions of people and households within an area.14 LGA IRSD scores were calculated as the population-weighted mean of their constituent Census Collection Districts scores and used to assign socioeconomic disadvantage across the entire study period. The IRSD distribution was divided into five equal parts. The bottom quintile was classified as “high disadvantage”, the top quintile as “low disadvantage” and quintiles two to four as “middling disadvantage”.
Remoteness was defined for LGAs using 2006 ASGC Remoteness Areas.15 This classification defines the accessibility/remoteness of geographic areas based on their road network distance to goods, services and opportunities for social interactions.16 Study LGAs were classified as either metropolitan, inner regional, or outer regional, remote and very remote.
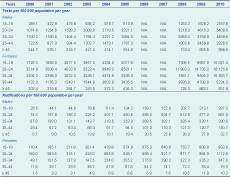
Age-specific annual testing and notification rates per 100 000 population were calculated by financial year, sex, medical provider density, relative socioeconomic disadvantage and remoteness for ages 15–19, 20–24, 25–34, 35–44 and 45+ years using Australian Bureau of Statistics midpoint estimated resident populations. Summary rates were also calculated by the direct method and used the 2001 Australian population as the standard.
Associations between annual age-specific testing and notification rates were assessed using scatter plots and Spearman’s rank-order correlation coefficients (ρ). Trends over time and group differences in chlamydia notifications were estimated as rate ratios using negative binomial models to account for extra Poisson variation observed in the data. The initial model included age, sex, trend over time and their interactions. Backward elimination was used to reduce this to a baseline model including significant interactions and main effect terms only. The logarithm of the age-specific testing rate per 100 000 population was then added to estimate testing-adjusted trends and group differences. Finally, medical provider density, relative socioeconomic disadvantage and remoteness were added to the testing-adjusted models to assess associations between these variables and notification rates after adjusting for chlamydia testing. The final model was fit separately for males and females due to interactions between sex and other variables. Data analysis was undertaken in SAS Version 9.2 using the GENMOD procedure. Statistical significance was evaluated using a Type I error rate of 0.05 for main effects and 0.01 for interactions.
The Executive Committee of the NSW Population and Health Services Research Ethics Committee determined that ethical review was not required.
From 1 July 1999 to 30 June 2005 and 1 July 2007 to 30 June 2010, 1 007 540 Medicare-rebated chlamydia tests were performed for NSW residents. Over the same periods, 81 435 cases of Chlamydia trachomatis infection were notified to NSW public health units: 61 773 (75.9%) from private sector laboratories and 19 662 (24.1%) from public sector laboratories. The proportion of private/public laboratory notifications remained consistent at around 75% of all notifications from private laboratories over time. The proportion of notifications that were identified through nucleic acid amplification techniques such as polymerase chain reaction (PCR) rose dramatically from 58% in 1999–2000 to 99.7% in 2009–2010. The proportion of notifications resulting from a PCR test reached 97% by 2002–2003.
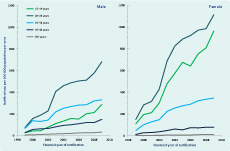
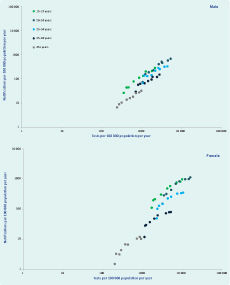
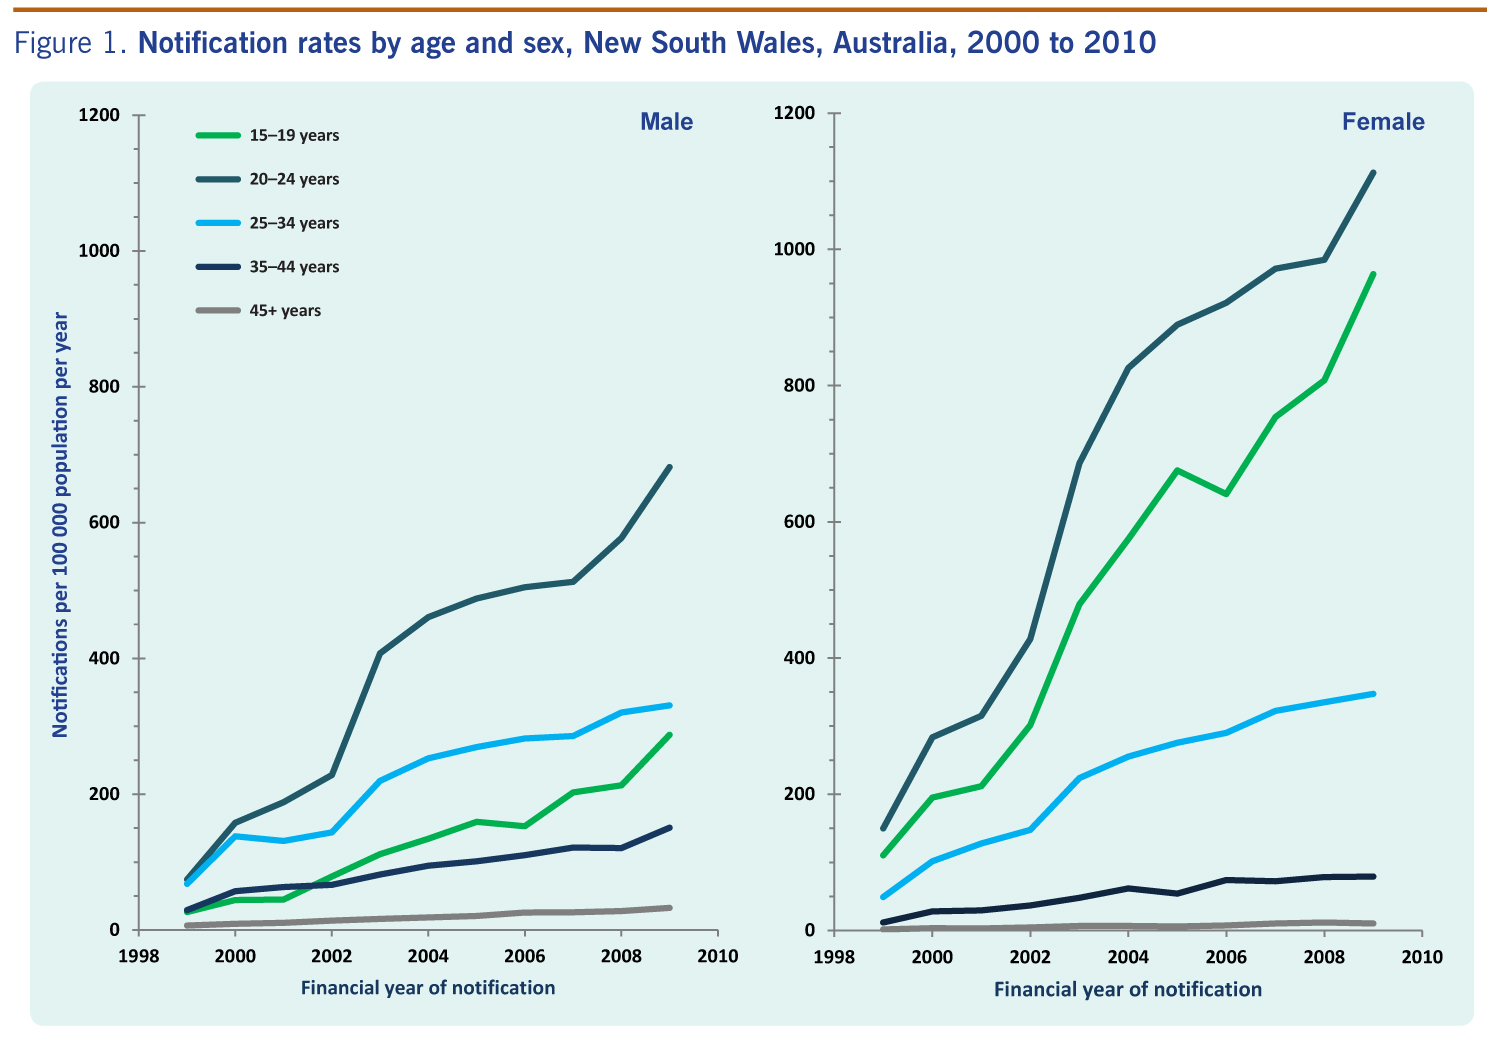
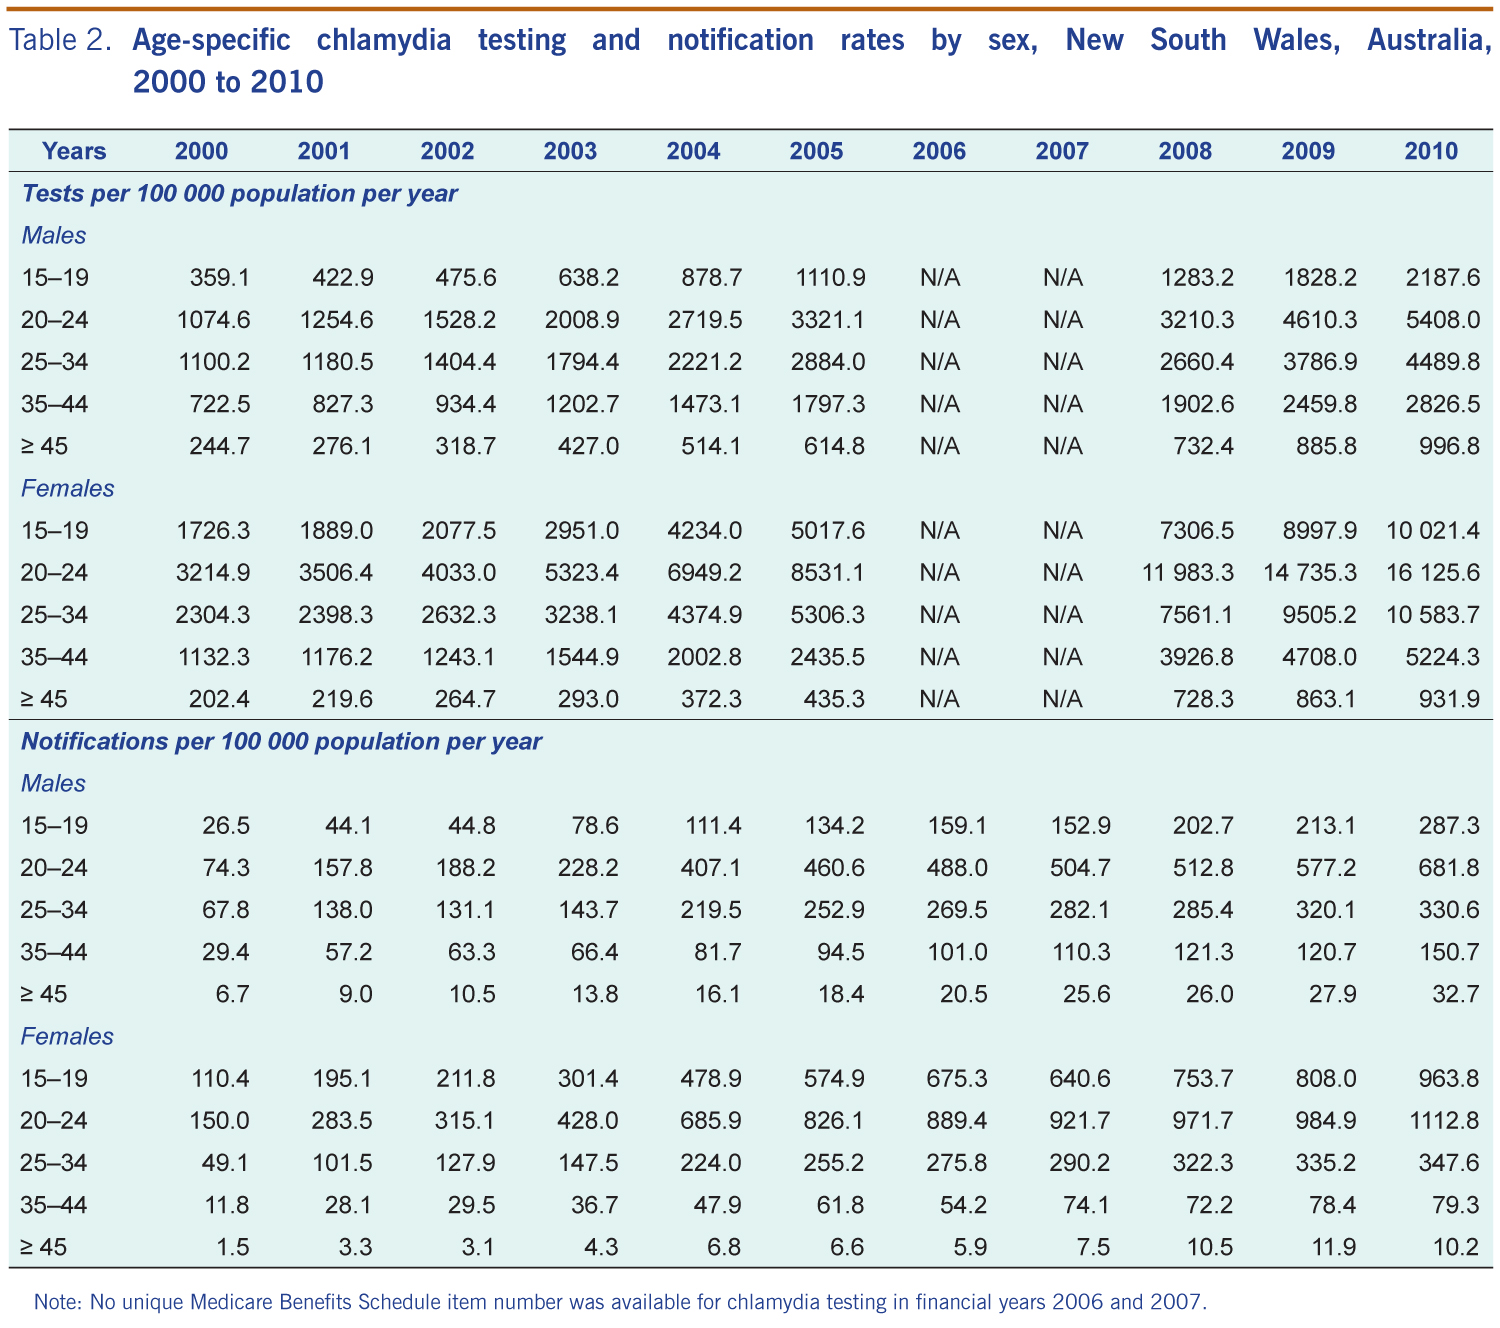
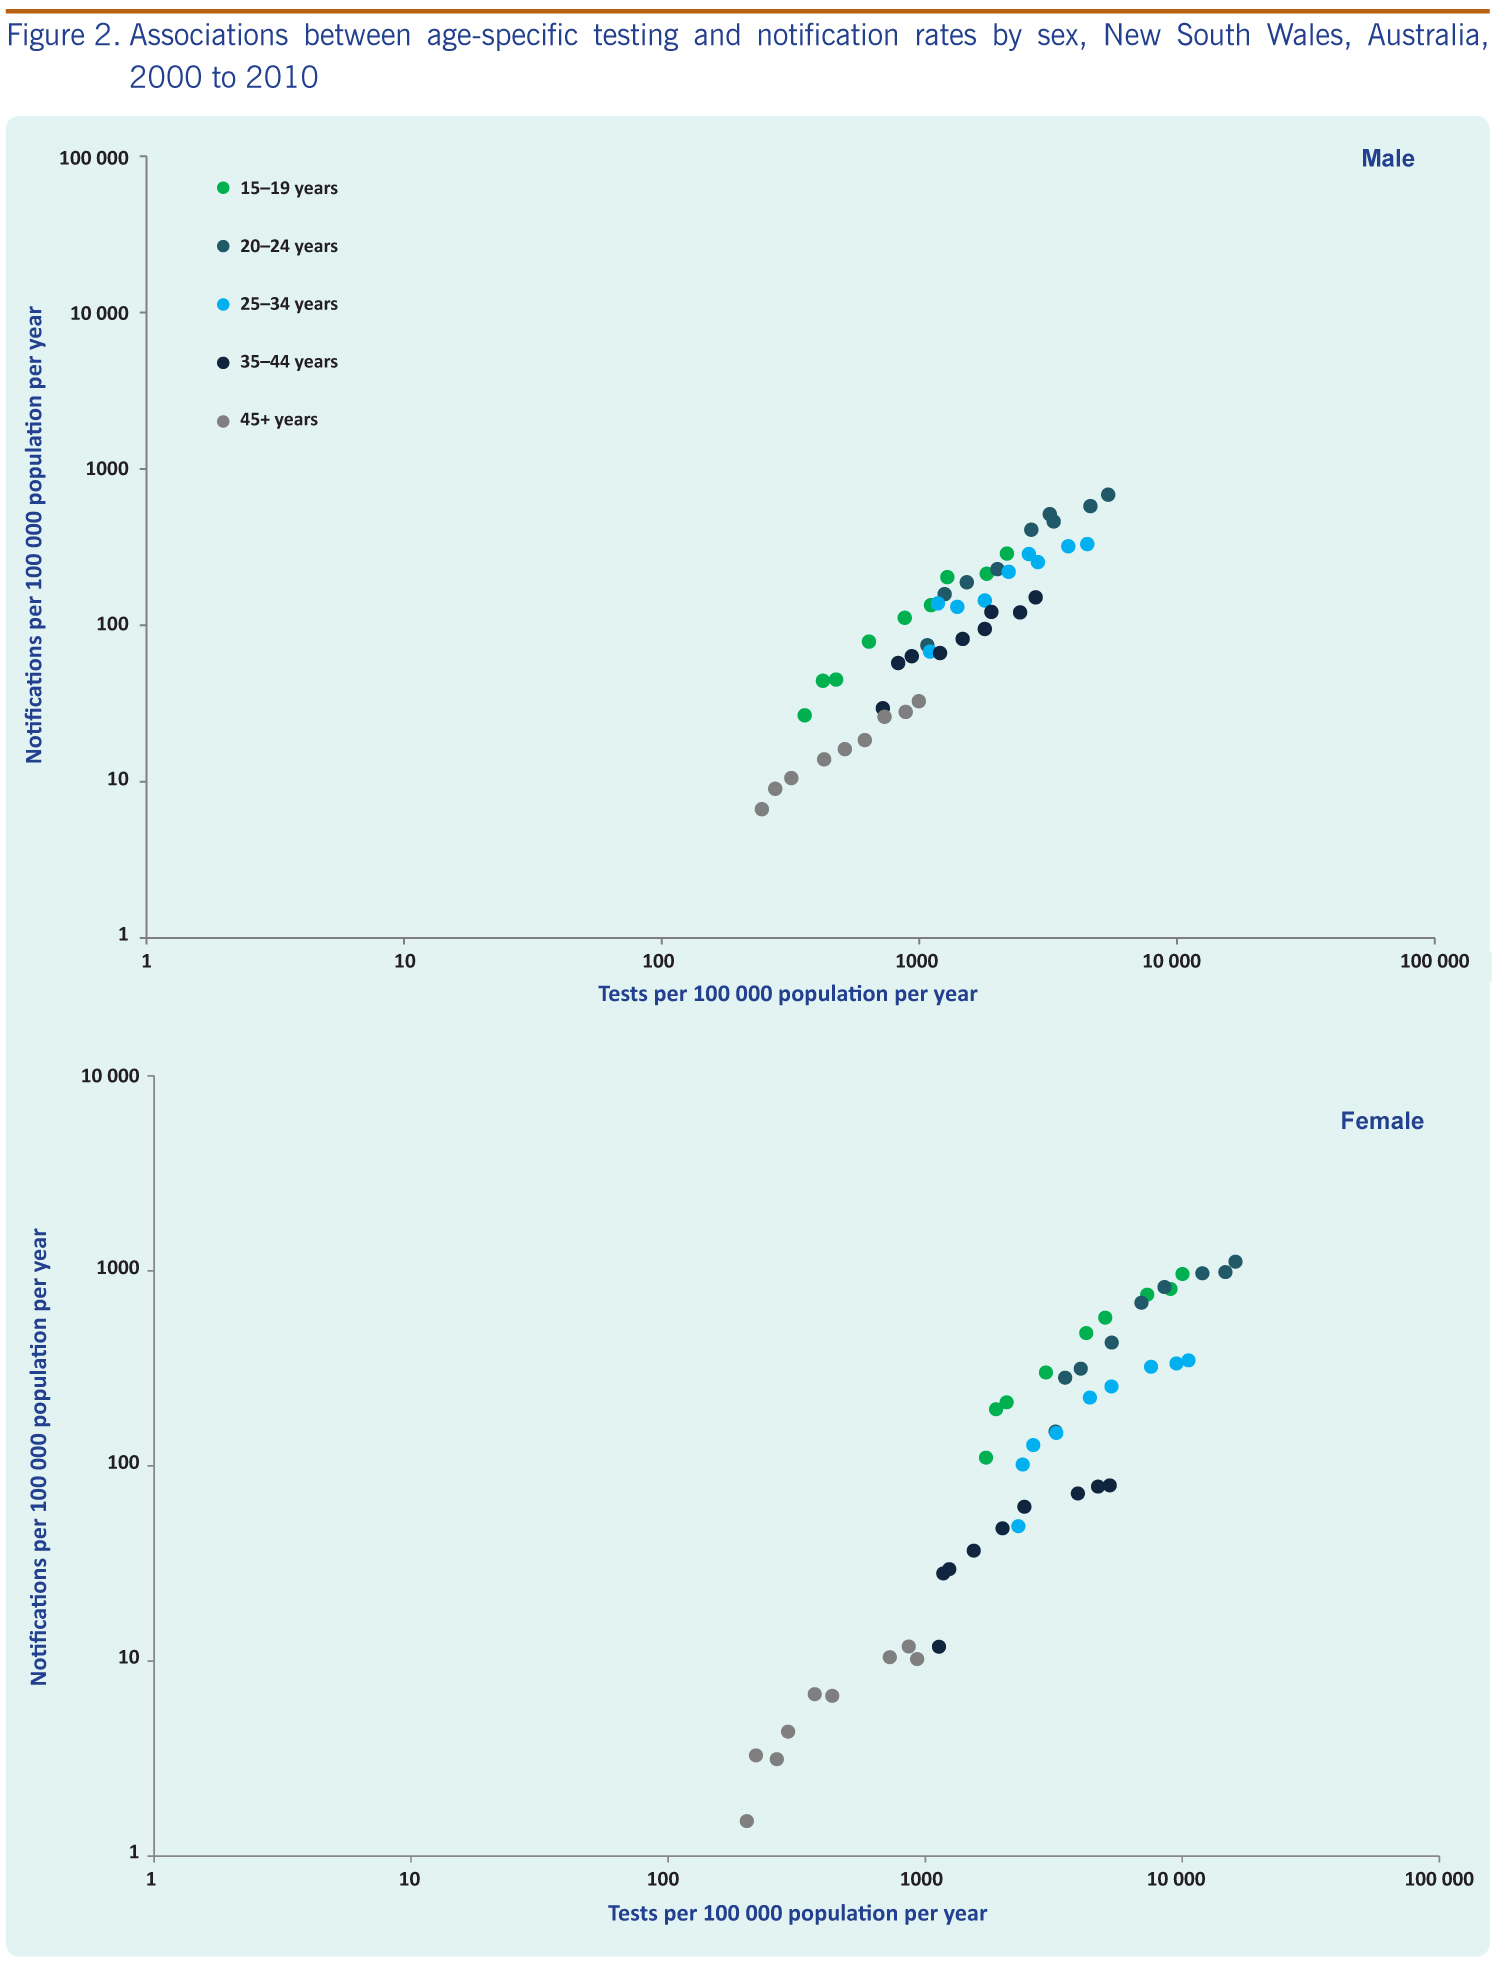
In unadjusted analyses over both study periods, notification rates increased on average by 13% (95% confidence interval [CI]: 10%–16% per annum; however, this trend varied by age and sex (Figure 1). Notification rates increased significantly in both males (11.3%) and females (15.7%) with the greatest increases in the 20–24 year age group for both sexes. The same pattern was seen for annual testing rates in both sexes and age groups over time (Table 2). Although the relative increases in rates of testing were similar for males and females, absolute testing rates increased to 16 126 tests per 100 000 person years in females aged 20–24 years in 2009 compared to a maximal testing rate of 5408 per 100 000 person years among men aged 20–24 years. A strong log-linear relationship between age-specific testing and notification rates was observed for both males and females with 87% of variability in notification rates explained by annual testing rates for both groups (ρ = 0.93, P < 0.001, Figure 2).
Note: No unique Medicare Benefits Schedule item number was available for chlamydia testing in financial years 2006 and 2007.
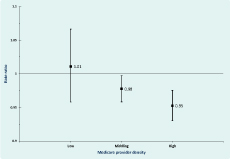
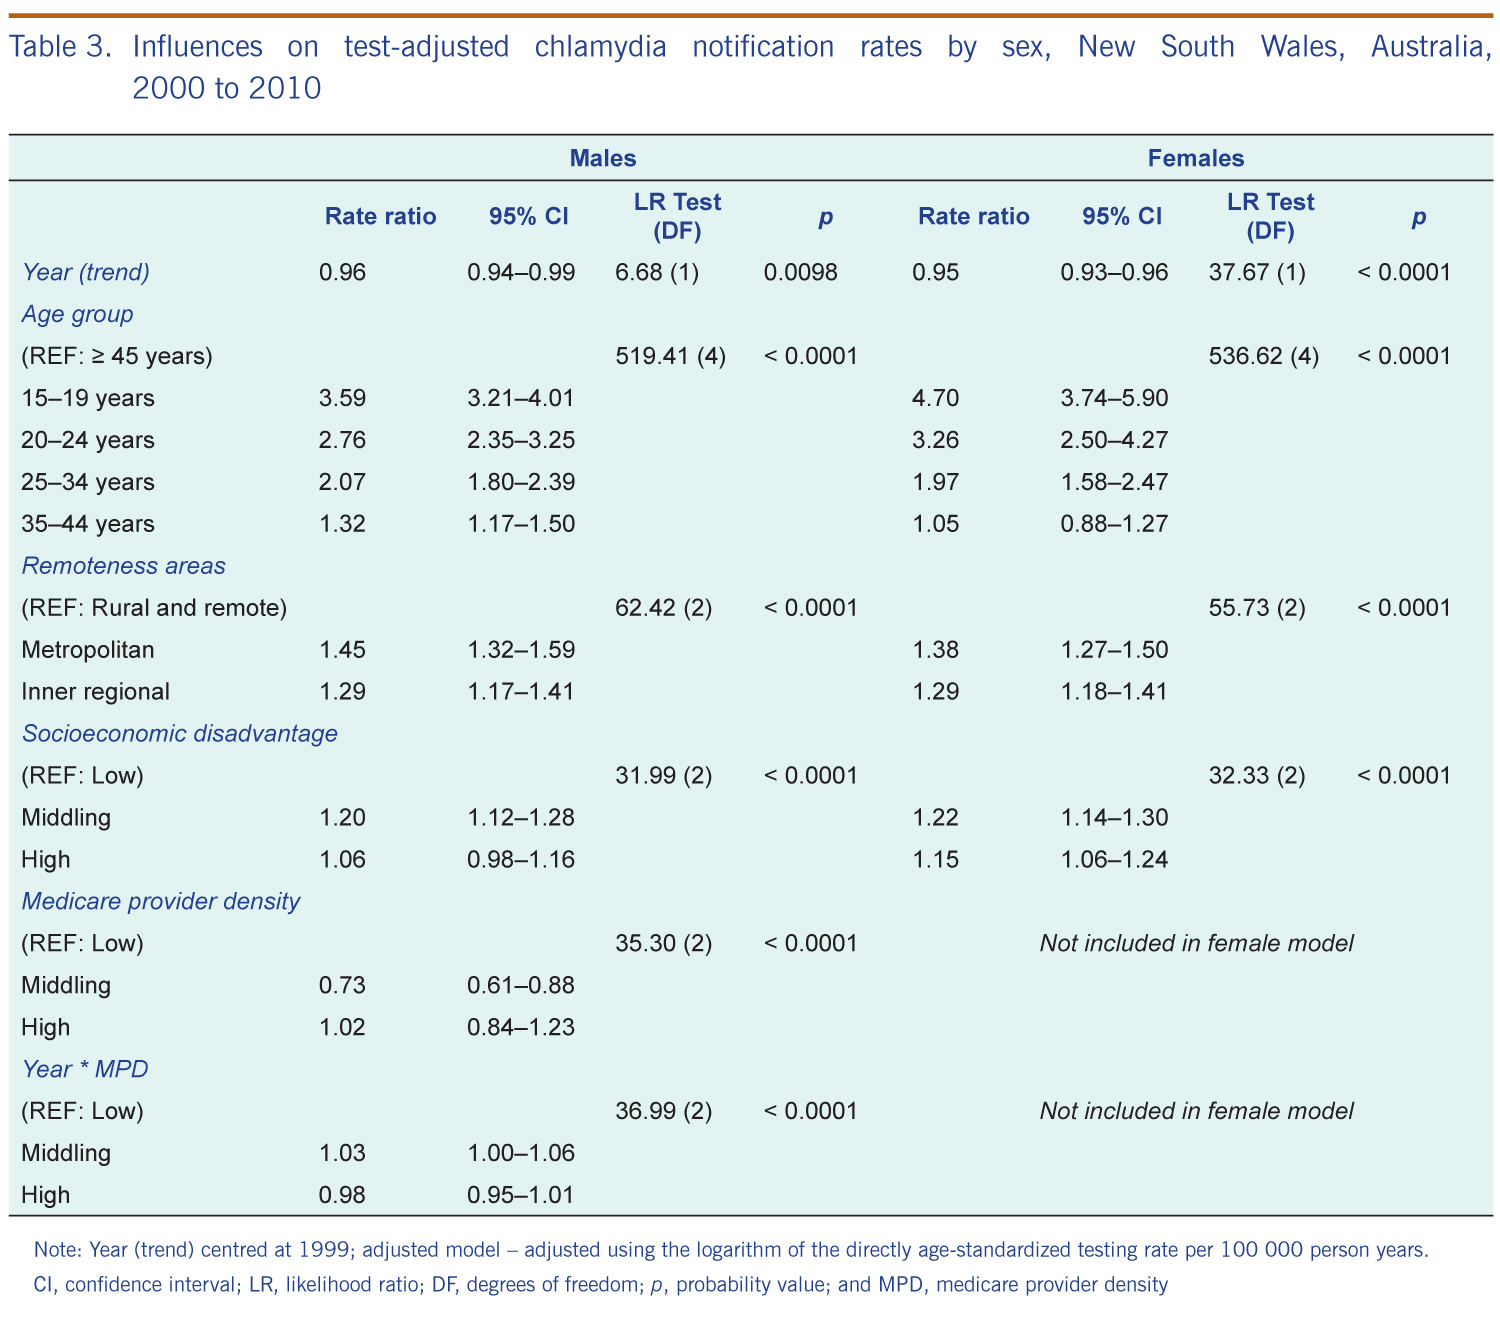
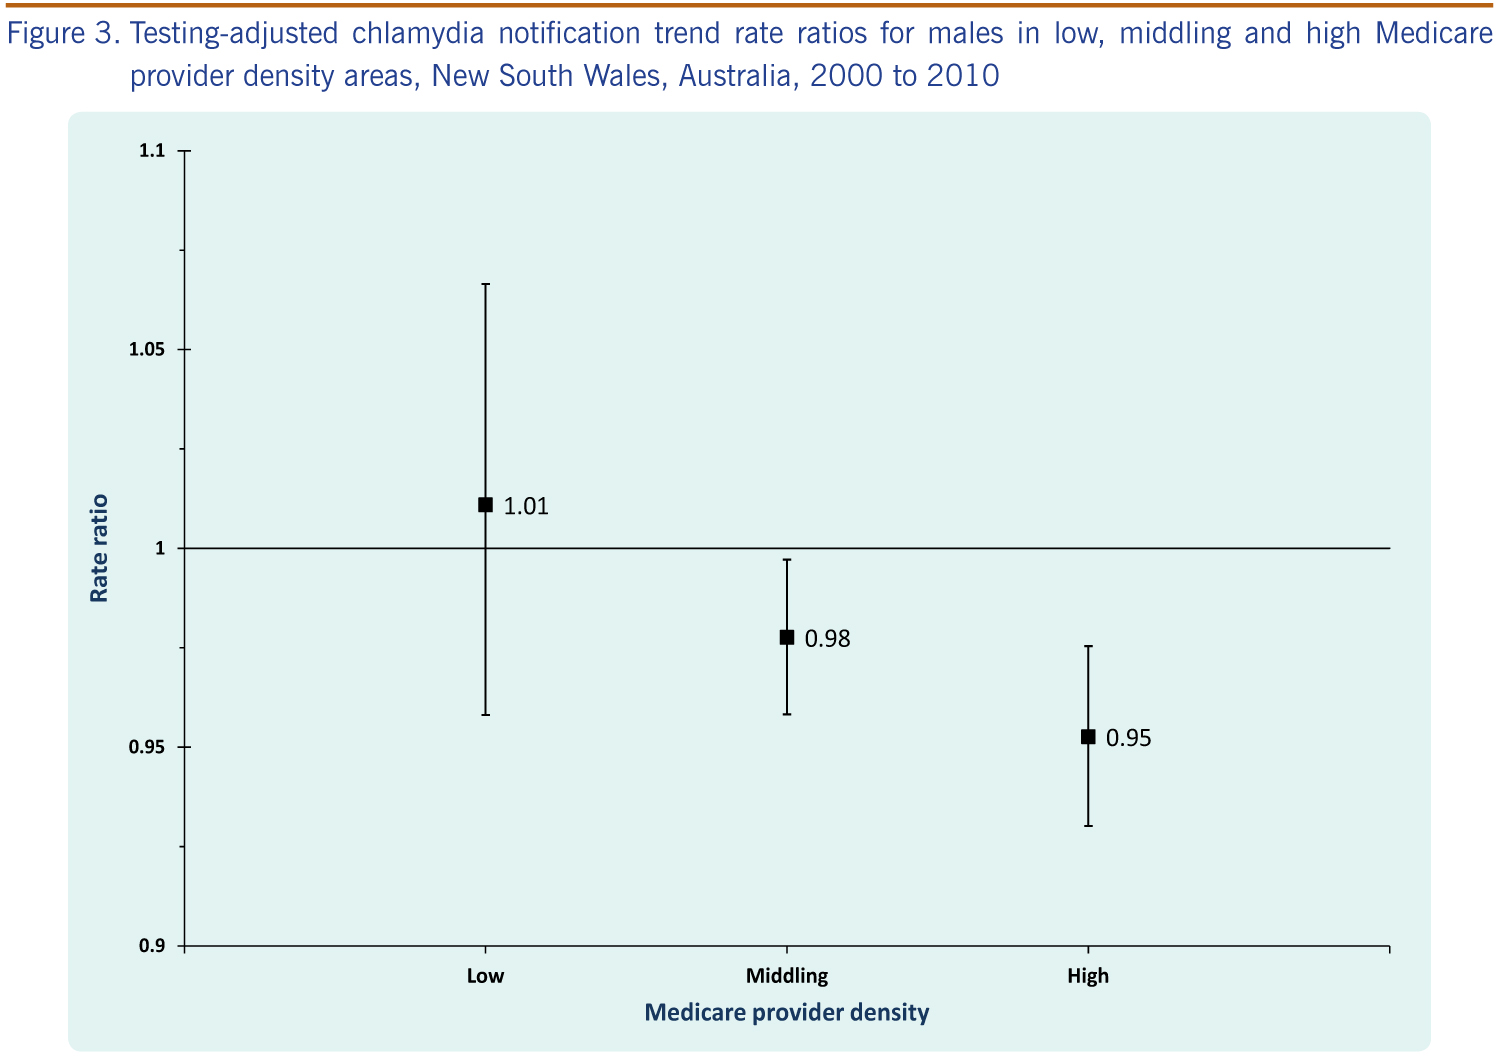
After adjusting for chlamydia testing rates, socioeconomic status, remoteness and Medicare provider density, chlamydia notification rates decreased on average by 3.9% (CI: 0.09–6.9) for males and 5.5% (CI: 3.7–7.3) for females per annum over the study period. Significant effect modification of the trend over time by Medicare provider density was found in males but not females (Table 3). Notification rates reduced by 2.3% (CI: 0.2–4.4) and 5.0% (CI: 2.5–7.5) per annum for males in middling and high Medicare provider density areas, and there was a non-significant increase in chlamydia notifications of 1.1% (CI: −4.4 to 6.7) per annum for males in low Medicare provider density areas (Figure 3).
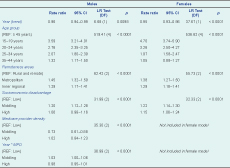
Note: Year (trend) centred at 1999; adjusted model – adjusted using the logarithm of the directly age-standardized testing rate per 100 000 person years.
CI, confidence interval; LR, likelihood ratio; DF, degrees of freedom; p, probability value; and MPD, medicare provider density
After adjusting for chlamydia testing rates, socioeconomic status, remoteness and Medicare provider density, increasing age was associated with decreasing notification rates in both males and females. Chlamydia notification increased at a similar rate with increasing urbanization for both males and females: notification rates were 45% and 38% higher for males and females living in metropolitan areas and 29% higher for both sexes living in inner regional areas compared to those living in outer regional, remote and very remote areas, respectively. For both males and females, chlamydia notifications were highest and of a similar magnitude for areas of middling socioeconomic disadvantage (Table 3).
The results of sensitivity analyses for trend over time by sex and age when all chlamydia notifications were included were consistent with the findings derived from private notifications only.
Socioeconomic disadvantage was very sensitive to source of notification data. The rate-ratios for males from areas with middling (RR = 1.32, CI: 1.24–1.41) and high (RR = 1.23, CI: 1.14–1.33) socioeconomic disadvantage increased and were both statistically significant when estimated from all notifications compared to private notifications only. By comparison, female rate-ratios increased differentially for areas of high (RR = 1.39, CI: 1.29–1.51) and middling (RR = 1.35, CI: 1.26–1.45) socioeconomic disadvantage, indicating increased notification risk with increasing socioeconomic disadvantage.
Remoteness was also sensitive to notification source and became non-significant for both males (LR = 3.75, DF = 2, P = 0.15) and females (LR = 0.23, DF = 2, P = 0.89) when rate ratios were derived using all notifications. This likely reflects a public testing bias as cross tabulations of notification source by remoteness indicated that the percentage of notifications from private providers decreased with increasing remoteness.
We found that testing-adjusted chlamydia notifications have declined for all NSW women and for NSW men in areas of high and middling Medicare provider density over the last decade. Age gradients in chlamydia notification remain after adjusting for differences in testing rates. These findings are consistent regardless of the laboratory notification source. Further, we found that testing-adjusted notification rates increase with increasing urbanization but only for tests conducted by private laboratory providers. This indicates that public laboratories may provide an important testing function in non-metropolitan areas of NSW.
Our findings suggest that notification trends and between-area comparisons are likely confounded by underlying patterns of testing, which may vary markedly depending on the local availability of medical providers and local patterns of practice.17–20 Given the prevalence of chlamydia, the rapid increase in testing seen over time (including the increased use of nucleic acid testing) and variations in patterns of testing by age and sex, it is essential to incorporate information on community testing rates to understand patterns of chlamydia-related disease in the community when using notification-based data.
Testing-adjusted rates may be used to assess trends in disease intensity and make comparisons that inform chlamydia epidemiology, surveillance and control. It has been previously recommended that spatiotemporal surveillance methods should be routinely used for surveillance of trends in bacterial sexually transmitted infections.21 Our results suggest that such surveillance must adjust for underlying testing rates to ensure any differences detected between or across areas reflect changes in disease intensity rather than differences in testing patterns.
There is strong evidence that chlamydia notification rates are highly correlated with rates of testing. This highlights the need to incorporate the proportion positive for chlamydia in routine surveillance reports as is done in other countries such as the United States.22,23 This level of correlation is to be expected given that chlamydia is estimated to be prevalent in approximately 4–5% of 15–24 year olds.24–26
We only identified one other Australian study that had examined the pattern of chlamydia notifications adjusted for changes in the level of testing for chlamydia in the community over time.27 This study from Western Australia found that between 2009 and 2011, the chlamydia testing rate increased 6%, while the test positivity rate increased 20% and the notification rate increased 25%. From 2011 to 2012, the testing rate increased 5%, while the test positivity rate decreased 7% and the notification rate remained stable. This study did not adjust for the effects of Medicare provider density, socioeconomic status or remoteness.
A 2007 to 2010 collaborative Australian study examined chlamydia testing and positivity rates through sentinel health services that target at-risk populations.28 This study found modest increases in chlamydia prevalence in young heterosexuals between 2006 and 2010, but the findings were limited as the study populations were at-risk groups attending services such as sexual health centres.29
Community levels of testing for chlamydia within general practice are still considered suboptimal, with less than 10% of the target group screened at least once a year in 2007–2008.17 This indicates that chlamydia testing should still be promoted in this age group.17,30 A recent mathematical model estimates that up to 40% of the population aged under 25 years would need to be screened (and treated if necessary) on an annual basis to reduce the community prevalence of chlamydia within the next 10 years.31
There are currently two large-scale studies under way in the Australian primary care context that are trialling a multifaceted testing intervention aimed at increasing chlamydia testing.32 Implementation of such interventions is likely to result in a continued rise in the number of chlamydia notifications each year, given that we found no evidence of a threshold effect for chlamydia testing in NSW.12 If the overall trend in incidence of chlamydia in the community is to be monitored using notification-based data, it is important to routinely adjust for location-specific levels and patterns testing.
This is the first Australian study to examine the association between the rates of chlamydia notification and rates of chlamydia testing, after adjusting for a range of demographic and local-level contextual effects, over the period of a decade. We used the best available information to conduct an analysis of testing and notification rates using comparable data; however, our study was limited by the use of private laboratory data only. A sensitivity analysis demonstrated that the main findings were unlikely to be biased by the source of laboratory notification. It is likely that people who experience socioeconomic disadvantage are more dependent on public sexual health clinics or public hospitals for testing for sexually transmitted infection.
Our study was a community-based study that was not able to examine for potential effects or trends over time within high-risk groups such as sex workers or men who have sex with men. Given the largely asymptomatic nature of chlamydia, particularly in women, and that 80% of notifications are from the age group targeted by screening programmes,7 we assumed the majority of testing was performed as a routine screen, as recommended.9,30 We could not determine whether the test had been performed in symptomatic or asymptomatic patients or whether the patient had known risk factors for chlamydia infection apart from age. It is known that general practitioners will preferentially test patients who report symptoms or risk factors such as a recent change in sexual partner.20 Testing is also still conducted more frequently in women, likely due to increased opportunities for testing.18,20
We could not adjust for possible inconsistencies in the data related to the change in Medicare items for chlamydia tests and the interruption in the availability of data relating to chlamydia testing during 2006 and 2007. The break and then change in the Medicare items used for chlamydia may have taken some time to adopt; therefore, the information around the time of introduction of the new Medicare items in 2006 may be incomplete. Our data may also have been affected by a change in the type or sensitivity of the tests performed, especially given the rapid increase in the proportion of notifications resulting from PCR tests between 2000 and 2003.
Our findings do not rule out increases in the prevalence of chlamydia in at-risk population groups, increases in the prevalence of chlamydia over time in particular areas of NSW or within shorter time periods than the full decade that we examined. A final limitation is that Medicare captures data on the number of tests performed rather than the number of unique individuals tested. Repeat testing of some individuals may have affected the outcomes of the study.
Additional research is needed to better understand the rates of infection and reinfection with chlamydia in both the community and in priority subgroups, as well as the effect of community-based interventions designed to interrupt transmission.
We have highlighted that there is substantial variation in rates of testing and rates of notification at the local level and in various age-groups, and this variation is affected by socioeconomic status and location remoteness. Future studies are needed to better understand the drivers for these variations in testing patterns and practice. We also need to better understand the rates of testing for symptomatic versus asymptomatic infection (i.e. true screening rates).
Future surveillance should routinely incorporate chlamydia testing data from both private (Medicare-funded) and public laboratory data to reduce possible bias in relation to socioeconomic status and location. Information derived from rates of notification of chlamydia should be more carefully interpreted to take account of the inherent limitations of these data, given that rates of notifications are biased by rates of presentation to medical professionals and rates of testing – including over time, by location and by patient (including by age and sex).
Finally, further work is required to better understand the relationship between test-adjusted notification rates and rates of admission to hospital for chlamydia-related complications such as pelvic inflammatory disease and ectopic pregnancy.
Increased testing is likely to be driving increasing chlamydia notification rates in young people in the general community in NSW over the longterm, given the relatively high prevalence of chlamydia infection in young people. Notification data to 2010 provide no evidence for increasing chlamydia prevalence in the general community in NSW after adjusting for increasing rates of testing. Differences between groups, especially local contextual variables such as socioeconomic status and remoteness, are sensitive to source of notification data, but trends over time by age and sex are consistent across notification types. Comprehensive data on testing rates over time and by location should inform routine chlamydia surveillance at all levels of government for the general community as well as priority population groups.
None declared.
None.
We acknowledge the assistance of the Commonwealth Department of Health and Ageing as well as the New South Wales Ministry of Health, Local Health Districts and Public Health Laboratories.