a World Health Organization Representative Office, Phnom Penh, Cambodia.
b World Health Organization Regional Office for the Western Pacific, Manila, Philippines.
c National Centre for Tuberculosis and Leprosy Control, Ministry of Health, Phnom Penh, Cambodia.
Correspondence to Man Kai Wong (e-mail: Alyssa.mkw@gmail.com).
To cite this article:
Wong MK et al. The association between household poverty rates and tuberculosis case notification rates in Cambodia, 2010. Western Pacific Surveillance and Response Journal, 2013, 4(1):25–33. doi:10.5365/wpsar.2013.4.1.002
Introduction: Poverty is a risk factor for tuberculosis (TB); it increases the risk of infection and active disease but limits diagnostic opportunities. The role of poverty in the stagnant case detection in Cambodia is unclear. This study aims to study the relationship between district household poverty rates and sputum-positive TB case notification rates (CNR) in Cambodia in 2010.
Methods: Poisson regression models were used to calculate the relative risk of new sputum-positive TB CNR for Operational Districts (ODs) with different poverty rates using data from the National Centre for Tuberculosis and Leprosy Control and the National Committee for SubNational Democratic Development. Models were adjusted for other major covariates and a geographical information system was used to examine the spatial distribution of these covariates in the country.
Results: The univariate model showed a positive association between household poverty rates and sputum-positive TB CNRs. However, in multivariate models, adjusting for major covariates, household poverty rates showed a significantly negative association with sputum-positive TB CNRs (relative risk [RR] = 0.95 per 5% increase in poverty rate). The negative association was stronger among males than females (RR = 0.93 versus 0.96 per 5% increase in poverty rate). Similar spatial patterns were observed between household poverty rates and other covariates, particularly OD population density.
Conclusion: Household poverty rate is associated with a decrease in sputum-positive TB CNR in Cambodia, particularly in men. The potential of combining surveillance data and socioeconomic variables should be explored further to provide more insights for TB control programme planning.
The links between poverty and tuberculosis (TB) cases have been documented for decades in many parts of the world.1–3 While poverty may lead to higher case notification rates (CNR) due to the higher prevalence of active TB cases among poorer populations, it is also thought that poverty may lower CNR as a result of reduced access to TB diagnosis and poor diagnostic capacity in such populations.
Cambodia is currently identified by the World Health Organization (WHO) as one of the 22 countries in the world that carry the highest TB burden with approximately 61 000 new TB cases per year and an incidence rate of 424 cases per 100 000 population in 2010.4 It is estimated that 64% of Cambodians are infected with latent or active TB, and a substantial number of cases remain undetected.5 In 1994, the WHO’s global TB control strategy (the DOTS strategy) was introduced and has reached almost 100% coverage and 90% treatment success rate for all forms of TB. However, the case detection rate (CDR) for all forms of TB has stagnated at around 65%. Since 2005, the country began to explore active case finding (ACF) initiatives to increase overall case notification in which the providers visit target populations in teams and use screening tools to identify TB suspects, followed by diagnostic tools to identify the TB patients on the spot.6 The ACF initiatives try to complement case-finding through passive case finding efforts, wherein people with symptoms visit health facilities and the health workers use screening tools to identify TB suspects.
Given the strong links between poverty and TB burden, many efforts had been made in developing countries to target poor and vulnerable groups.7 However, TB incidence is only estimated for the national level, while the number of cases diagnosed and CNRs are often the only measures available at provincial and district levels. The CNR does not reflect the actual number of active TB cases but rather the number of cases diagnosed and put on treatment; the CNR can be greatly affected by access to services, which, in turn, is often affected by poverty. Provincial and district TB control authorities often rely heavily on TB case notification data to find the missing cases, but they may not be aware of the population to target within their geographical areas to maximize their efforts.
Using a cross sectional analysis approach, this study aimed to assess the link between household poverty level and sputum-positive TB CNR in Cambodia in 2010. The study also explored the potential of using a geographical information system (GIS) to characterize the spatial distribution of poverty and other TB risk factors with the distribution of TB.8–10 The results would add to our current knowledge about the association between poverty and TB CNRs in Cambodia. The information could also be used to aid national officials in designing and scaling-up TB services to target specific vulnerable populations and proactively seek to serve the most disadvantaged.
We performed cross-sectional ecological analyses using operational districts (ODs) as the unit of analysis. An OD is the basic organizational and reporting unit in the Cambodian health system, providing services through health centres and district referral hospitals. There are 77 ODs in Cambodia, spread over 24 provinces, each serving an average population of 180 000 (range: 35 500–525 500). The ODs are formed by combining several communes, which are the lowest level administrative units in Cambodia each consisting of three to 30 villages. According to the 2008 census, there were 1621 communes and 14 073 villages in Cambodia.
The number of newly diagnosed sputum-positive TB cases (including new and previously treated TB cases) in 2010 was obtained from the National TB Registry maintained by the National Centre for Tuberculosis and Leprosy Control (CENAT). The registry consists of the number of different types of TB cases diagnosed, put on treatment and reported by all OD TB coordinators. CNRs were computed based on the number of cases and the population of the ODs projected for the year, based on figures from the latest census (2008). Case count by age group was only available for new sputum-positive TB cases (not including previously treated TB cases), therefore, CNRs for different groups were not computed.
Household poverty data was obtained from the Commune Database maintained by the National Committee for SubNational Democratic Development that contains core information regarding demographic, socioeconomic and physical assets of each commune in Cambodia (n = 1620). These data are collected by Village Chiefs and Commune Clerks annually and are compiled at the commune level. Household poverty rates (% of population living at or below poverty line) for each commune were derived based on the poverty line and the per capita consumption expenditure per day for the year. We estimated the OD poverty rates by spatially matching communes with ODs and averaging all the commune poverty rates in the same OD.
Population density in each OD was calculated from the population projected for 2010 divided by the area of each OD (in square kilometres) that were obtained from the WHO Western Pacific Regional Office MapServer for Public Health Mapping.
Other factors potentially associated with TB disease burden were selected from the Cambodia Demographic and Health Surveys (DHS) that are nationally and regionally representative household surveys that provide a wide range of monitoring and impact evaluation indicators. Because subregional estimates in the DHS surveys were not based on representative samples, we used the regional (provincial) estimates in this study and applied the same proportions to all the ODs in the same province.
Patient diagnostic rate (PDR) was an indicator proposed to assess case detection; it is the rate at which prevalent cases are detected by control programs and is calculated using the number of reported cases per 100 000 per year divided by the prevalence per 100 000.11 In this study, prevalence is obtained from the Second National TB Prevalence Survey (2011) conducted by the CENAT with major support from the Japan International Cooperation Agency.12 The denominator represents the population that had TB at the time and the numerator represents those actually detected and notified by the National TB Control programme.
Data on all new and previously treated sputum-positive TB cases and OD household poverty rates were linked to their respective geo-coded OD data using the join attrition function in Arc Map GIS software V.9.3.1 (Environmental System Research Institute, Redlands, CA, USA). Similarly, OD population density, all basic vaccination coverage, distance to health care facilities and HIV prevalence were also mapped with sputumpositive TB CNR using classifications that are the same as those defined in this study.
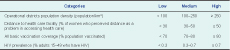
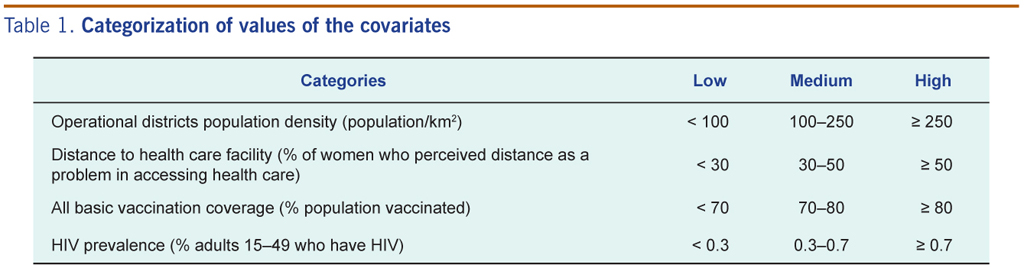
Using multiple Poisson regression models, the logarithm of the number of new sputum-positive TB cases notified in each OD was modelled as a function of household poverty with the logarithm of the OD population as an offset. The household poverty rates were transformed into both continuous and categorical variables in increments of 5%. Relative risks (RR) of new smear-positive TB case notification rate were estimated from the models using the lowest poverty category as the referent group. A univariate model was used to assess the effect of household poverty rates on new sputum-positive TB CNRs, followed by a multivariate model adjusting for (1) OD population density; (2) HIV prevalence; (3) distance to health facility (% of women who perceived distance to health facility as a problem in accessing health care); and (4) all basic vaccination coverage (proportion vaccinated). All covariates were identified a priori and included in the model as tertile discrete continuous variables shown in Table 1. SAS 9.2 (SAS Institute Inc., Cary, North Carolina) was used for all analyses.
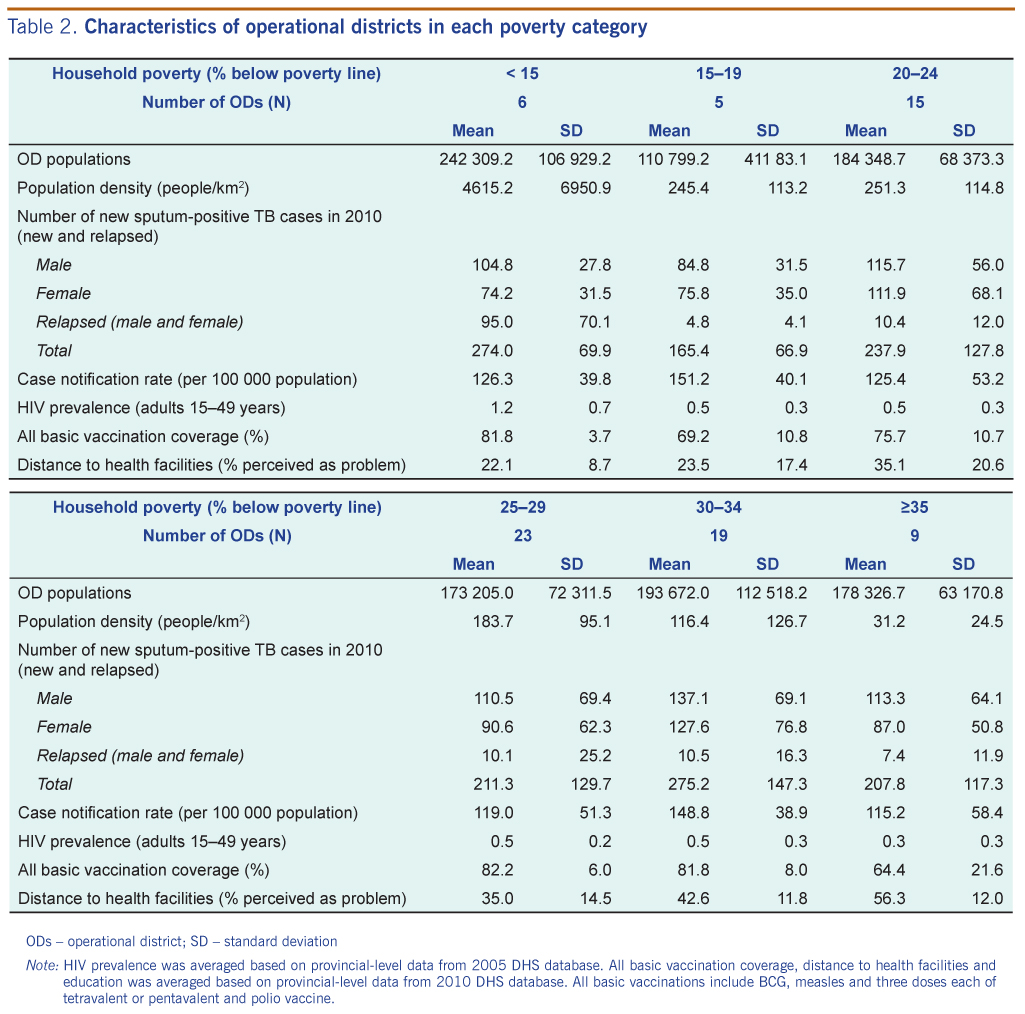
All 77 ODs were included in the continuous and categorical analyses. Table 2 shows the summary characteristics of ODs in each poverty category.
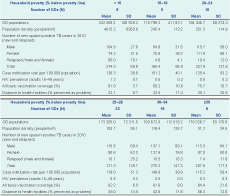
ODs – operational district; SD – standard deviation
Note: HIV prevalence was averaged based on provincial level data from 2005 DHS database. All basic vaccination coverage, distance to health facilities and education was averaged based on provincial level data from 2010 DHS database. All basic vaccinations include BCG, measles and three dose of each of tetravalent or pentavalent and polio vaccine.
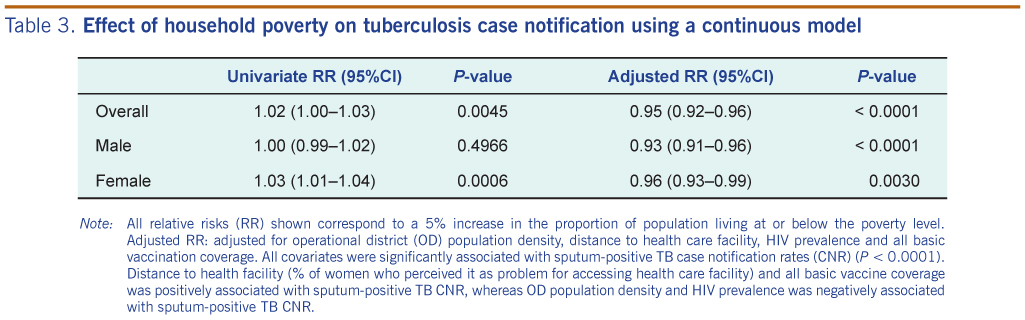
The continuous univariate model showed an overall positive association between household poverty rates and sputum-positive TB CNRs (Table 3). A 5% increase in household poverty rates was associated with a 2% increase in TB CNRs (RR = 1.02; 95% confidence interval [CI] = 1.00, 1.03). A significant association was seen among females (RR = 1.03; 95% CI = 1.01, 1.04 per 5% increase in poverty rate) while the association was nil for males (RR = 1.00). After adjusting for OD population density, distance to health facility, HIV prevalence and all basic vaccination coverage, the continuous adjusted model showed an overall negative association between household poverty rates and sputum-positive TB CNRs. The model suggested that a 5% increase in household poverty rates was associated with a 5% decrease in sputum-positive TB CNRs (RR = 0.95; 95% CI = 0.92, 0.96). A stronger negative association was seen among males (RR = 0.93; 95% CI = 0.91, 0.96 per 5% increase in poverty rate) than females (RR = 0.96; 95% CI = 0.93, 0.99 per 5% increase in poverty rate).
Note: All relative risks (RR) shown corresponds to a 5% increase in the proportion of population living at or below poverty level. Adjusted RR: adjusted for operational district (OD) population density, distance to health care facility, HIV prevalence and all basic vaccination coverage. All covariate were significantly associated with sputum-positive TB case notification rates (CNR) (P < 0.0001). Distance to health facility (% of women who perceived as problem for accessing health care facility) and all basic vaccine coverage was positively associated with sputum-positive TB CNR, whereas OD population density and HIV prevalence was negatively associated with sputum-positive TB CNR.
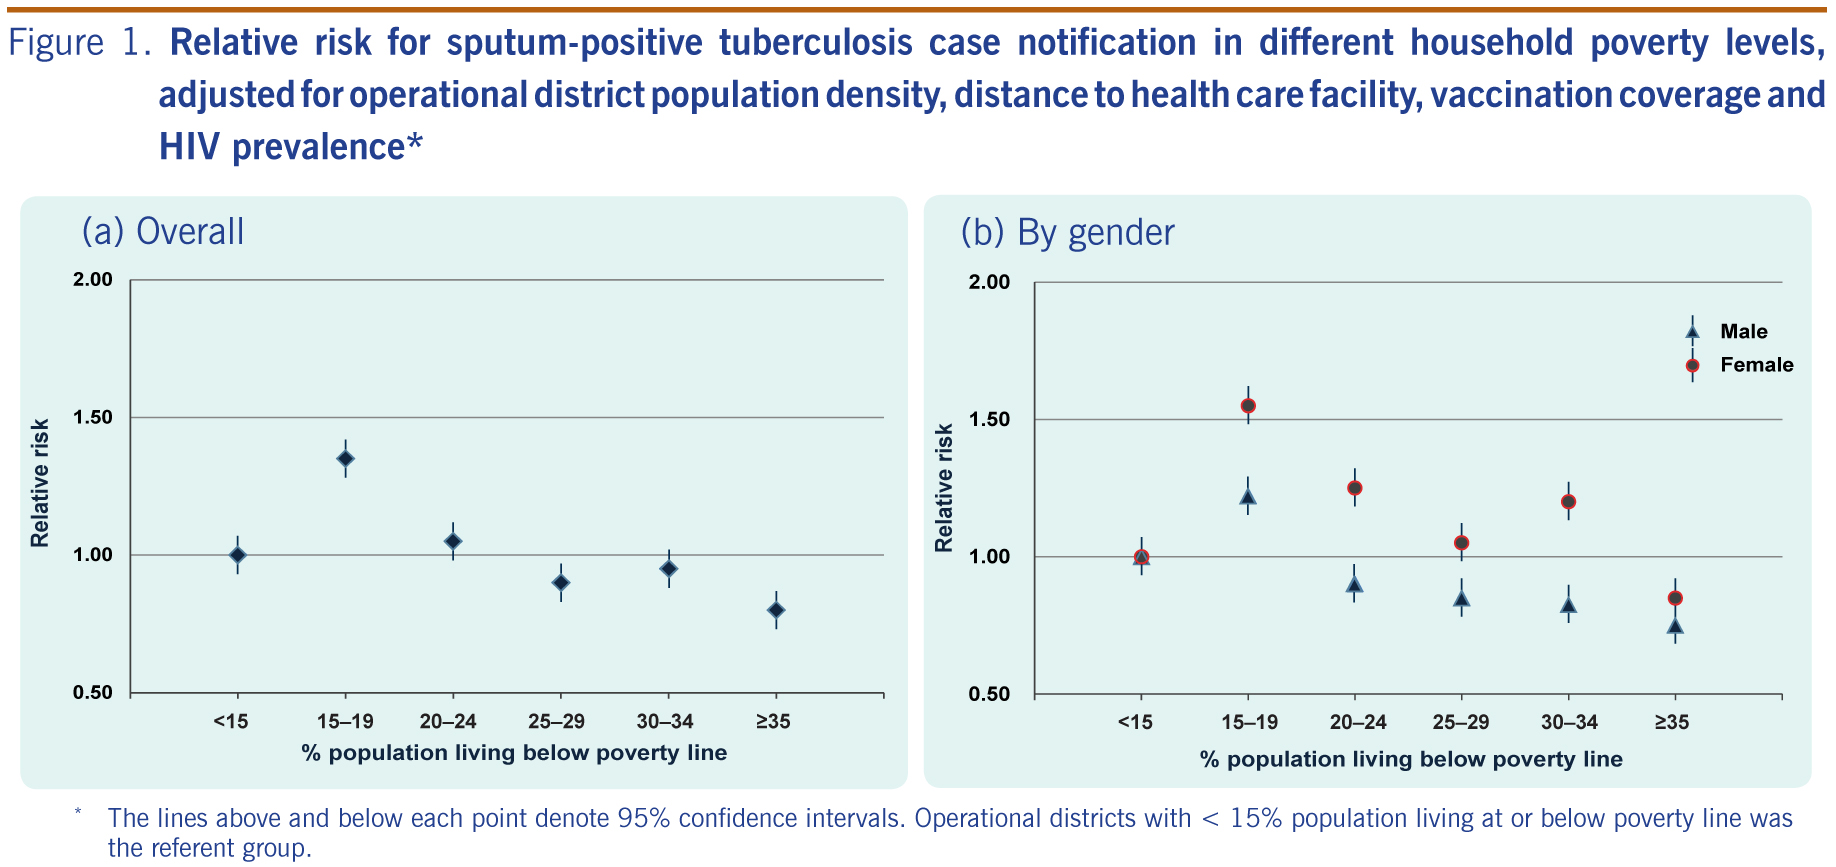
In the categorical analysis (Figure 1), ODs with 15%–20% of the population living below the poverty line were associated with the highest sputumpositive TB CNRs (RR = 1.35; 95% CI = 1.23, 1.48 per 5% increase in poverty rate) after adjusting for OD population density, distance to health care facility, vaccination coverage and HIV prevalence. Subsequent increase in poverty rates resulted in lowerRRs. A similar trend of decrease in RRs across the poverty level was observed in both males and females, although the RR of sputum-positive TB CNR was higher for females than males across all poverty categories.
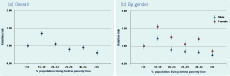
* The lines above and below each point denote 95% confidence intervals. Operational districts with < 15% population living at or below poverty line was used as referent group.
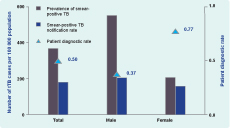
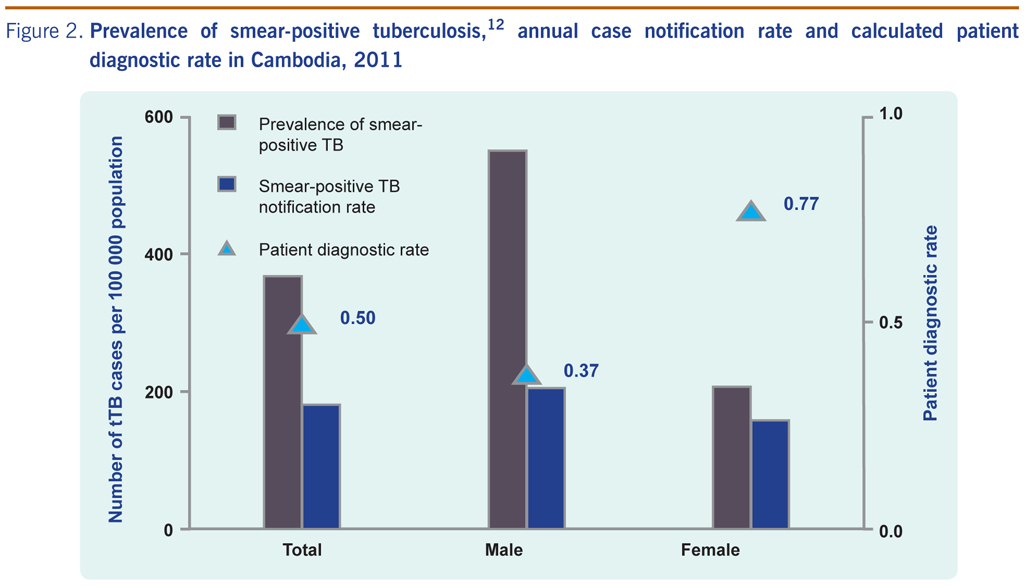
The patient diagnostic rate (PDR) for the overall population was 0.5; the PDR for males were much lower than for females (0.37 versus 0.77) (Figure 2).
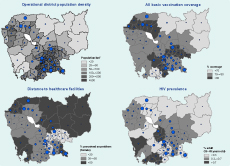
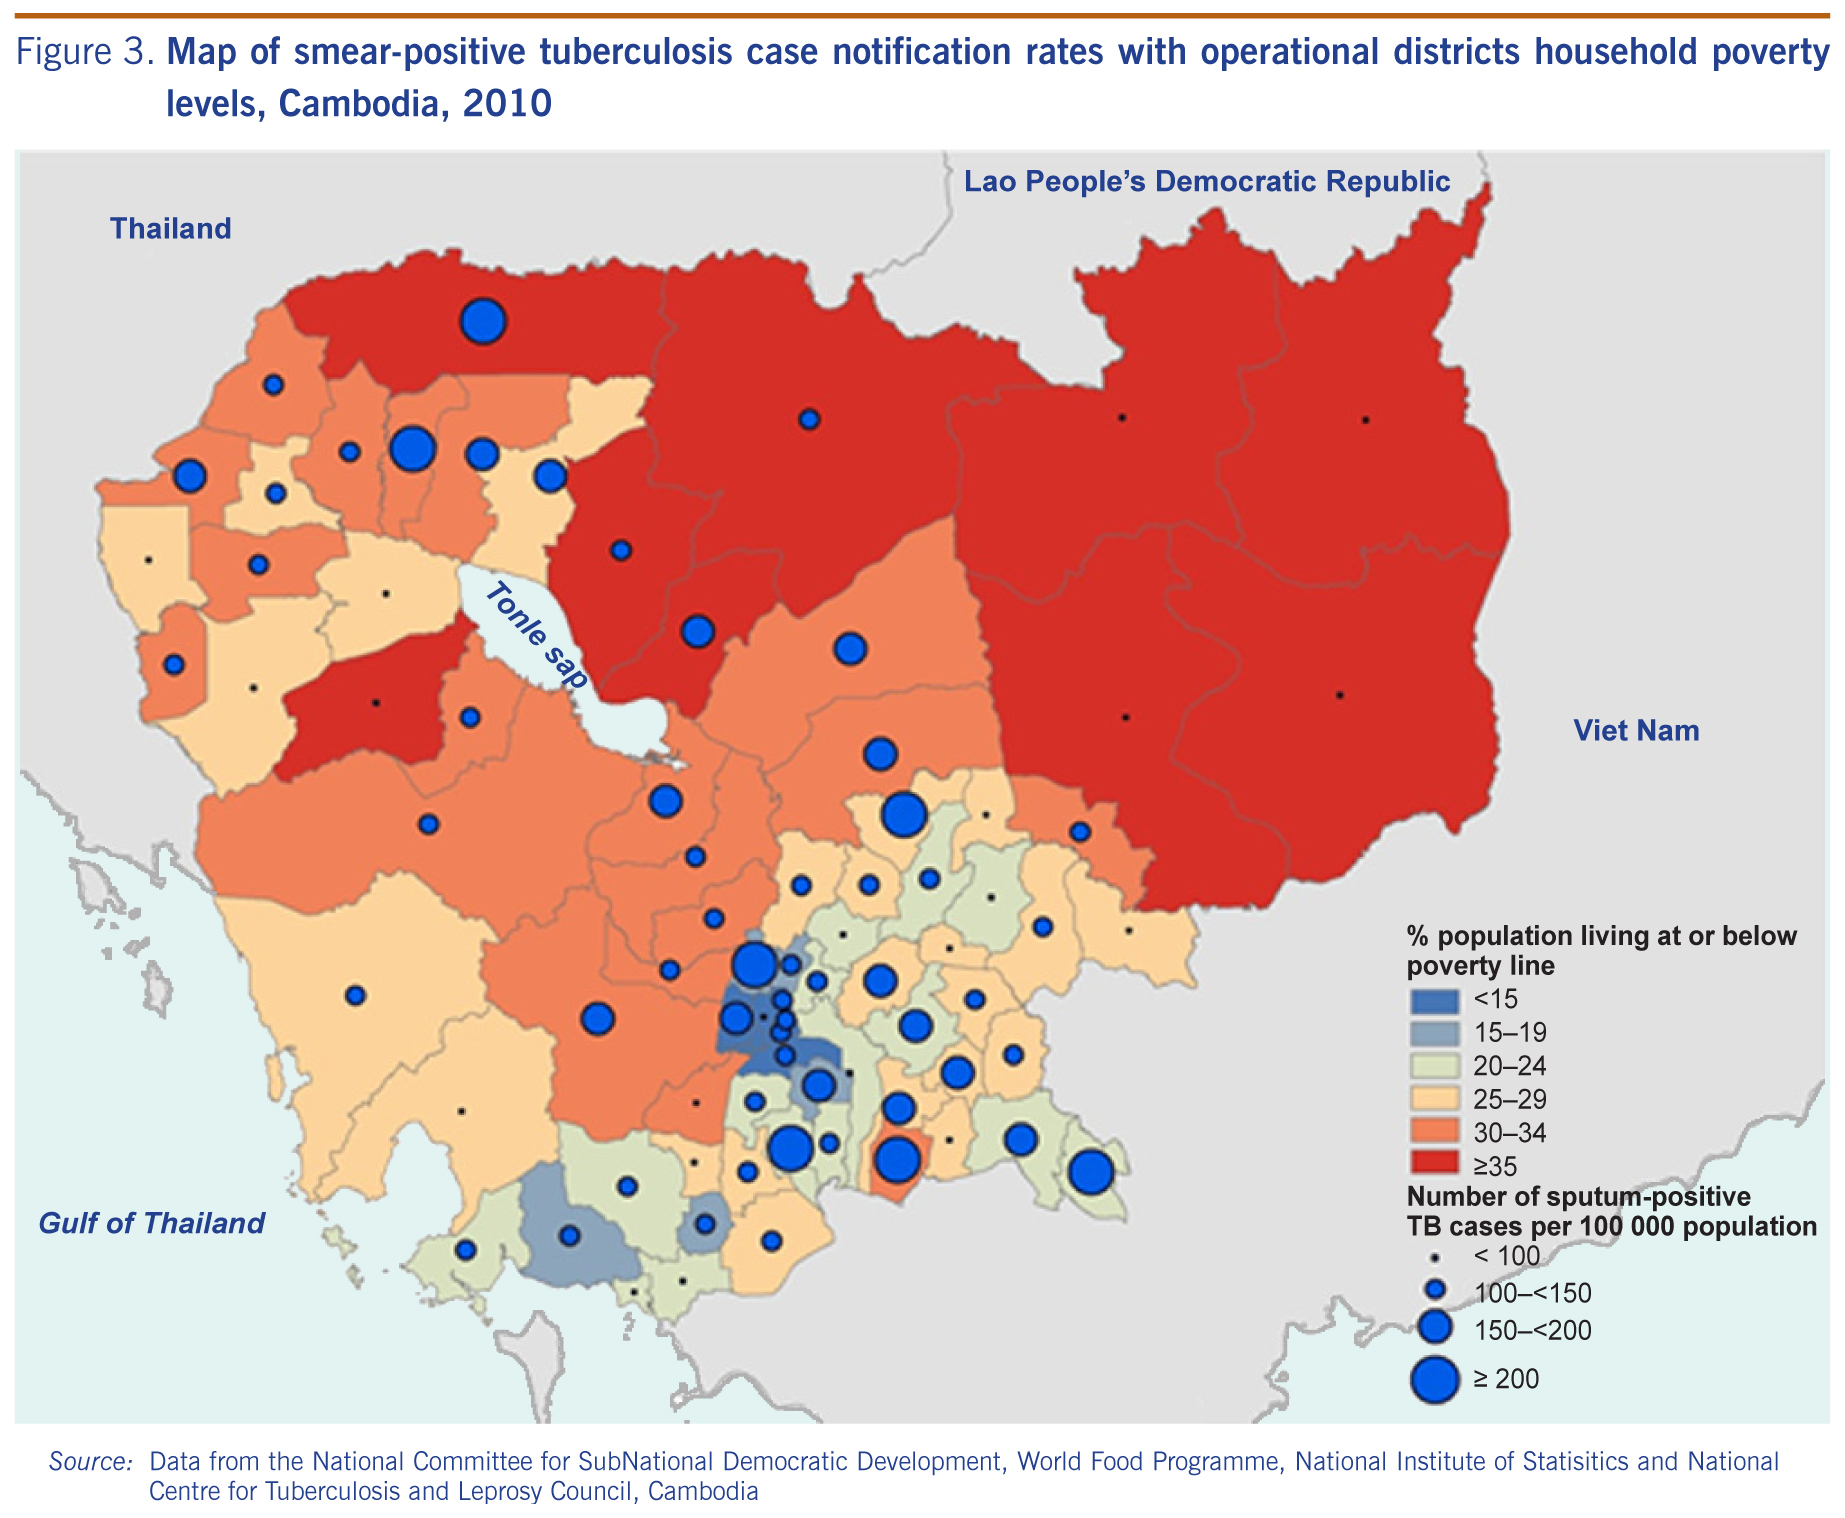
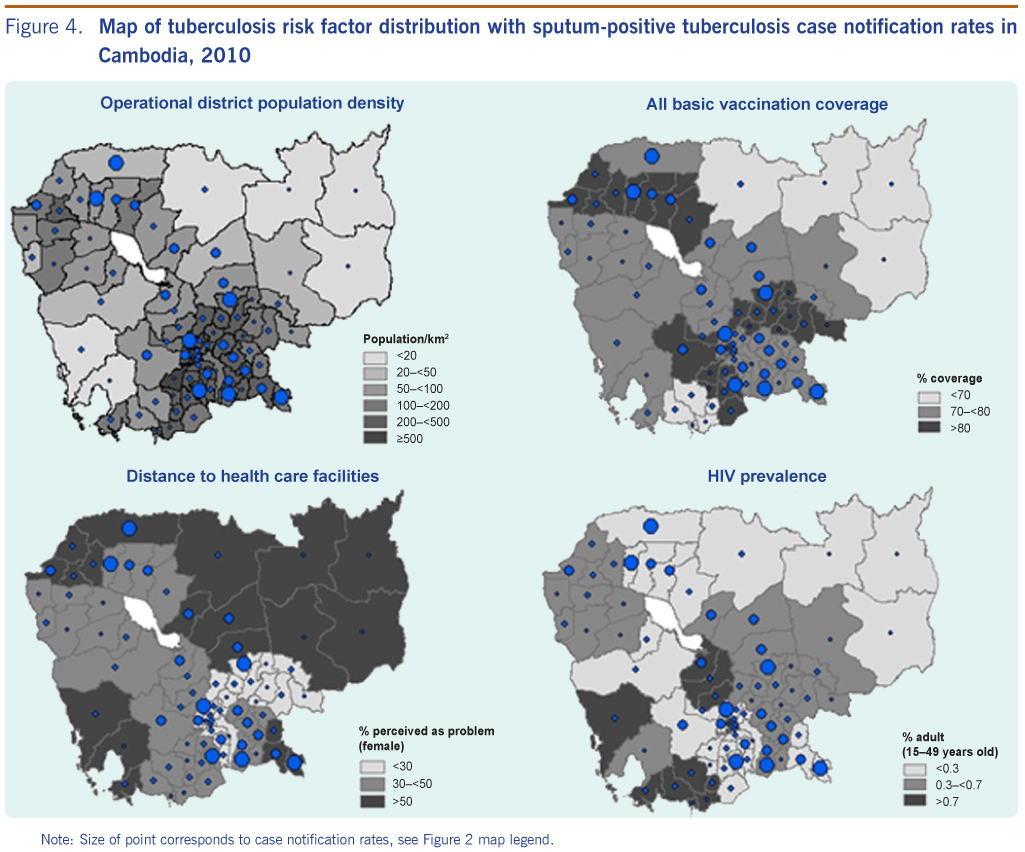
Although the highest household poverty rates are found in the northeastern part of Cambodia, the region accounts for some of the lowest sputum-positive TB CNRs (Figure 3). The same region was also showed to have the lowest vaccination coverage and the worst physical barrier of distance to health care facilities (Figure 4). The southern part of the country, which is less poor than the rest of the regions, showed much higher sputumpositive TB CNRs. There were notable links between the map of OD population density (the top left of Figure 4) and the map of household poverty rate (Figure 3) where ODs with higher population density were often areas of lower poverty. Clusters of ODs with a high HIV prevalence were observed near the central region and along the coastal regions.
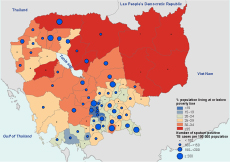
Source: Data from the National Committee for SubNational Democratic Development, World Food Programme, National Institute of Statisitics and National Centre for Tuberculosis and Leprosy Council, Cambodia
Note: Size of point corresponds to case notification rates, see Figure 2 map legend.
Our findings suggest that there was an overall negative association between household poverty and sputum-positive TB CNR in Cambodia in 2010 after adjustment for covariates like population density, distance to health care facilities, all basic vaccination coverage and HIV prevalence. The negative association was more apparent in males than females. Without adjusting for these variables, household poverty was positively associated with sputum-positive TB CNR, as seen in the univariate model in Table 3. Given the widely documented positive associations between poverty and TB disease burden,13,14 we have several possible explanations for the differing findings in our study.
TB case notification (i.e. number of cases notified per 100 000 population per year) is dependent on the actual prevalence and incidence of the disease, as well as the level of case detection (i.e. proportion of incident cases put on treatment by the national programme). Although the poverty rate may be positively associated with TB prevalence and incidence rates, it may not be positively associated with CNR if the CDR is low. CDR (and hence the CNR) could be low due to poor geographical access to TB care, high costs associated with seeking care and poor awareness about TB disease and TB services.
In Cambodia and in most countries of the world, TB prevalence among males is significantly higher than among females.15 The latest prevalence survey in Cambodia indicated that the male to female ratio of smear-positive cases was 1.82.12 However, PDRs calculated using figures from the same survey indicated that females were more likely to have been diagnosed, treated and reported than males by the programme (Figure 2). This matches with the findings of our study results, as seen in Table 3,which illustrates that the reduction in sputum-positive TB CNR among females was not as significant as among males as poverty increases (RR of 0.96 versus 0.93 per 5% increase in poverty rate). Given that the negative association is stronger in males than in females, a greater proportion of males with active TB disease may remain undetected, especially in higher poverty regions. This could be driven by the difference in health seeking behaviours between males and females since females tend to visit government health care facilities more often as a result of their closer association with these facilities during pregnancy and childbirth. Males may be seeking care in private clinics or may be more negligent of their symptoms and diseases compared to females.
A GIS provided an effective platform for the convergence of disease-specific information in this study. It allowed for visual assessment of the distribution of TB risk factors and TB CNRs, revealing trends and interrelationships that would be more difficult to discover in tabular format. In the long-term, GIS data should be used by policy-makers to easily visualize problems in relation to existing health services and socio-demographic features so that resources can be geo-targeted to achieve maximal health outcomes.
A major limitation of this study is the reliance on ecological-population level data that is subject to ecological fallacy and Modifiable Areal Unit Problem. Exposure levels represent average levels for each population group in this study, thus findings between average exposure and TB case notification in this study do not imply that such a relationship would be present at the individual level. The association found in one aggregation level may change if the underlying data is aggregated differently. Using ODs as the unit of analysis may not give accurate results as these districts are too large and TB and poverty rates are heterogeneously distributed within ODs. In addition, it is difficult to control for potential confounders and to establish a correct temporal sequence between the exposure and outcome. The finding from this study may serve as preliminary investigation to stimulate additional research.
Given the widely studied links between age and TB risk, the inability to adjust for age distribution was also a limitation of our model. Age-specific CNRs were not available in an aggregated electronic database and were therefore excluded as outcome variables in our analysis. In addition, we could not adjust for OD age distribution because ODs are only used by the health ministry, while census data are collected at the provincial level. The validity of measurements is the other major limitation in this study. Household poverty rates were calculated based on standardized survey instruments administered by different village chiefs and commune clerks. It is not known whether the instruments were validated or if the survey responses were confirmed by a second representative. OD household poverty rates were calculated by averaging all the administrative district poverty rates, some of which had a wide variance. Furthermore, all covariate measures (except population density) were obtained from the DHS survey, which was only representative at the provincial level, not the OD level. ODs in the same province were assumed to have the same HIV prevalence, vaccination coverage and access problem, which may not accurately reflect the level of variance among all the ODs. Distance to health care facilities was a measure of perceived barrier among women; it was not an actual measure of distance and may not reflect the experience of men. HIV prevalence data was extracted from the 2005 DHS survey but other risk factors were extracted from the 2010 DHS survey. This is because HIV prevalence testing was not conducted in the 2010 DHS survey. While HIV prevalence in Cambodia is relatively low, we did observe a slight decrease in national HIV prevalence from 2005 to 2010. However, the extent to which this may have affected our results is unknown.
Although historically TB has been associated with poverty, few analytical studies from developing countries have tried to quantify the relative impact of poverty on TB case notification rates, explore the causal mechanism underlying this association and help programs to geo-target areas with high poverty rates. This study is an example of using routinely collected data for research purposes. Despite the limitations inherent in these data sources, the findings are still valuable as it enhance our knowledge of disease control at a district level. Further studies are still needed to identify possible explanations for the observed association in Cambodia. These studies should strive to conduct more disaggregated analysis using smaller geographical units provided better data on poverty rate and case notification rate could be available. The results of such targeted studies will better reflect the true determinants of TB burden and guide the National TB Programme to implement more effective TB control interventions.
None declared.
None.
We would like to thank the Cambodia National Centre for Tuberculosis and Leprosy Control for providing case notification and prevalence data and the World Food Programme (Cambodia) staff for spatially matching communes with operational (health) districts.