a Victoria Infectious Diseases Reference Laboratory, North Melbourne, Victoria, Australia.
b Communicable Disease Prevention and Control Unit, Victorian Government Department of Health, Melbourne, Victoria, Australia.
c World Health Organization Collaborating Centre for Reference and Research on Influenza, North Melbourne, Victoria, Australia.
d The Australian National University, Canberra, Australian Capital Territory.
Correspondence to James Fielding (e-mail: james.fielding@mh.org.au).
To cite this article:
Grant K et al. Continued dominance of pandemic A(H1N1) 2009 influenza in Victoria, Australia in 2010. Western Pacific Surveillance and Response Journal, 2011, 2(3):10-18. doi:10.5365/wpsar.2011.2.2.009
The 2010 Victorian influenza season was characterized by normal seasonal influenza activity and the dominance of the pandemic A(H1N1) 2009 strain. General Practice Sentinel Surveillance rates peaked at 9.4 ILI cases per 1000 consultations in week 36 for metropolitan practices, and at 10.5 ILI cases per 1000 in the following week for rural practices. Of the 678 ILI cases, 23% were vaccinated, a significantly higher percentage than in previous years. A significantly higher percentage of ILI patients were swabbed in 2010 compared to 2003–2008, but similar to 2009, with a similar percentage being positive for influenza as in previous years. Vaccination rates increased with patient age. Melbourne Medical Deputising Service rates peaked in week 35 at 19.1 ILI cases per 1000 consultations. Of the 1914 cases of influenza notified to the Department of Health, Victoria, 1812 (95%) were influenza A infections – 1001 (55%) pandemic A(H1N1) 2009, 4 (< 1%) A(H3N2) and 807 (45%) not subtyped; 88 (5%) were influenza B; and 14 (< 1%) were influenza A and B co-infections. The World Health Organization Collaborating Centre for Reference and Research on Influenza tested 403 isolates of which 261 were positive for influenza, 250 of which were influenza A and 11 were influenza B. Ninety-two per cent of the influenza A viruses were pandemic A(H1N1) 2009, and following antigenic analysis all of these were found to be similar to the current vaccine strain. Three viruses (0.9%) were found to be oseltamivir resistant due to an H275Y mutation in the neuraminidase gene.
Victoria is Australia’s second most populous state with a temperate climate and an annual influenza season that usually occurs between May and September. Given the wide clinical spectrum and variable levels of diagnostic testing for influenza, several surveillance programmes that target different populations are used to monitor activity of influenza and influenza-like illness (ILI) in Victoria. A sentinel general practice (GP) programme for the surveillance of ILI in Victoria has been coordinated by the Victorian Infectious Diseases Reference Laboratory (VIDRL) in partnership with the Victorian Government Department of Health since 1993. Laboratory testing of a sample of ILI cases from the surveillance programme commenced in 1998.1 VIDRL also monitors diagnoses of ILI made by the locum medical practitioners through the Melbourne Medical Deputising Service (MMDS). The Department of Health coordinates the surveillance of all laboratory-confirmed influenza in Victoria, a prescribed group B notifiable disease under the Victorian Public Health and Well-being Act 2008 and Public Health and Well-being Regulations 2009. The department also investigates notified institutional outbreaks of respiratory illness under the auspices of this legislation.
The objectives of the influenza surveillance system are to: monitor the epidemiology of laboratory-confirmed influenza in Victoria;
Victoria was the first Australian jurisdiction to report widespread transmission – particularly among schoolchildren – when pandemic influenza A(H1N1) 2009 emerged in mid-2009. While notification data suggested unprecedented levels of disease in the community, ILI data suggested a season characterized as higher than normal seasonal activity.2 The pandemic strain continued to be dominant around the world into the 2009/2010 northern hemisphere influenza season and there was considerable interest in the epidemiology of a likely second southern hemisphere pandemic wave during the 2010 influenza season. Here we summarize the epidemiological findings from the Victorian influenza surveillance system during the 2010 season.
In 2010, 61 GPs from 23 metropolitan practices and 26 GPs from nine rural practices participated in the VIDRL GP Sentinel Surveillance (GPSS) programme (Figure 1), which is approved for continuing professional development points by the Royal Australian College of General Practitioners and the Australian College of Rural and Remote Medicine for participation. The GPSS programme for 2010 operated from 3 May to 24 October (weeks 19–43) inclusive.

The 87 participating GPs reported total number of consultations per week and age, sex and vaccination status of any patients presenting with ILI. GPs submitted the data weekly by fax or online submission (http://www.victorianflusurveillance.com.au). A case of ILI was defined as fever, cough and fatigue/malaise.3 ILI rates were calculated as the number of ILI patients per 1000 consultations and were compared to previously established activity thresholds (normal seasonal activity, higher than expected activity and epidemic activity) for Victorian influenza seasons.4
GPs were requested to collect nose and throat swabs, sent in the same viral transport medium, from patients presenting within four days or less since the onset of symptoms. Patients were chosen at the discretion of the GP. Data collected on swabbed patients included: age, sex, symptoms (fever, cough, fatigue, myalgia, other), vaccination status (for pandemic H1N1 vaccine and seasonal vaccine), date of vaccination/s and Aboriginal and/or Torres Strait Islander status. RNA was extracted from clinical specimens and real-time polymerase chain reaction (PCR) used to detect the presence of influenza A virus matrix gene. Influenza positive samples were confirmed as positive or negative for pandemic A(H1N1) 2009 in a second real-time PCR that incorporated primers and probes specific for the hemagglutinin gene of the pandemic A(H1N1) 2009 virus. Influenza B viruses were identified by a separate PCR.
The MMDS is the largest medical locum service in Australia and has contributed to Victorian influenza surveillance since 2003. It provides a 24-hour medical service to patients in their own homes or aged care facilities. Weekly rates of influenza-related diagnoses by MMDS clinicians per 1000 consultations were calculated from records returned from the MMDS clinical database using the search terms “influenza” and “flu.” To avoid inclusion of those immunized prophylactically, records that contained the terms “Fluvax,” “at risk” and “immunization” were excluded from the rate calculation.
Under the Victorian Public Health and Well-being Act 2008 and Public Health and Well-being Regulations 2009 medical practitioners and pathology services are required to notify laboratory-confirmed influenza cases to the Department of Health within five days of a positive test result. Records of all laboratory-confirmed influenza cases with a 2010 notification date were extracted for analysis from the Department of Health Notifiable Infectious Diseases Surveillance database on 17 May 2011.
The Victorian Department of Health investigates notified respiratory outbreaks in institutional settings under the Victorian Public Health and Well-being Act 2008 and Public Health and Well-being Regulations 2009. An outbreak is defined as three or more cases of newly acquired influenza-like illness within 72 hours in residents or staff of a setting or facility.
Seven laboratories referred specimens and isolates collected in Victoria during 2010 to the WHO Collaborating Centre for Reference and Research on Influenza, Victoria, Australia (WHO Collaborating Centre), although the selection method varied by laboratory. Tissue culture was attempted for all of the specimens/isolates received. Viruses that were successfully cultured were analysed by haemagglutination inhibition assay to determine antigenic similarity to the current vaccine strains and by sequencing and a neuraminidase inhibition assay to determine antiviral susceptibility.
Data from the surveillance systems were analysed descriptively using Microsoft Excel software. The chi-squared test was used to compare proportions in Stata version 10.0 statistical software, with P < 0.05 considered significant.
For the 25 week surveillance period, an average of 93% (81/87) of GPs submitted tally sheets to VIDRL each week. GPs reported having conducted 172 411 consultations (121 270 metropolitan and 51 141 rural) and identified 678 ILI cases (527 metropolitan and 151 rural) during the season, corresponding to metropolitan and rural rates of 4.4 and 3.0 ILI cases per 1000 consultations, respectively.
Among the 678 ILI cases reported by GPs, the median age was 33 years (range: 1–91 years) and 50% were female. Twenty-three per cent of ILI cases were vaccinated in 2010. Of those vaccinated in 2010, 26% received the seasonal vaccine only, 38% had both the seasonal vaccine, which included the pandemic strain, and the monovalent pandemic vaccine, and 15% had the pandemic monovalent pandemic vaccine only. The remaining 20% were reported as vaccinated, but the vaccine was not specified.
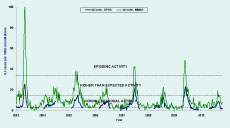
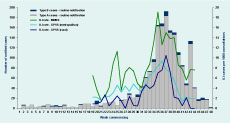
ILI rates in 2010 were low compared to previous years and fell within the range of normal seasonal activity (Figure 2). The combined ILI rate began to increase in week 32 (week commencing 2 August) peaking at 9.4 ILI cases per 1000 consultations in week 36 for metropolitan practices, and at 10.5 ILI cases per 1000 in the following week for rural practices (Figure 3). Rates had declined to baseline levels by week 41.


GPs swabbed a total of 478 (71%) ILI patients in 2010, of which 170 (36%) tested positive for influenza. In 2010, 166 (98%) of influenza positive swabs were influenza A and the remainder were influenza B. Of the 166 influenza A viruses detected, 148 (89%) were pandemic A(H1N1) 2009 influenza, seven (4%) were subtype A(H3N2) and the remaining 11 (7%) were not further subtyped (Table 1).

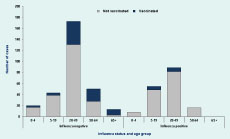
Among the influenza-positive patients, 155 (91%) were reported as not vaccinated and 13 (8%) were vaccinated with the pandemic and/or seasonal vaccine(s) (Table 1). Higher proportions of swabbed ILI patients who tested negative for influenza were reported as vaccinated. Three patients (one influenza positive and two influenza negative) were reported as receiving an unspecified influenza vaccine and the vaccination status of 11 patients (two influenza positive and nine influenza negative) was unknown. Of the 94 patients reported as vaccinated, 42 (44%) had received the seasonal vaccine, 26 (28%) the pandemic vaccine, 23 (25%) both vaccines and 3 (3%) had an unspecified vaccine. Excluding those with unknown vaccination status, the proportion of vaccinated influenza-positive patients (7%) was significantly lower than the proportion of vaccinated influenza-negative patients (27%; P < 0.001). The proportion of swabbed patients that were vaccinated with either vaccine increased with age, particularly among those that tested negative for influenza (Figure 4).

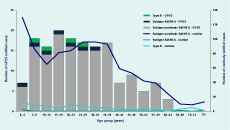
The median age of pandemic A(H1N1) 2009 cases identified from the GPSS was 26 years (range: 1–63 years), compared to 18 years for both influenza A(H3N2) (range: 4–34 years) and influenza B (range: 7–28 years), although there were relatively few cases of the latter two infections. Most cases (75%) identified from the GPSS were aged from 5 to 39 years (Figure 5).

A total of 441 patients were diagnosed with “flu” or “influenza” by the MMDS during the 2010 surveillance season, corresponding to an overall rate of 8.4 ILI cases per 1000 consultations. Like the GPSS ILI rate, the MMDS rate, with a peak of 19.1 ILI per 1000 consultations, was low compared to previous seasons (Figure 2). The peak occurred in week 35 (week commencing 23 August) before the peaks of the GPSS ILI rate and cases of laboratory-confirmed influenza notified to the Department of Health (Figure 3).
Excluding notifications of cases associated with the GPSS and outbreaks, there were 1914 cases of influenza routinely notified to the Department of Health in 2010. Of these, 1812 (95%) were influenza A infections, 88 (5%) were influenza B and 14 (1%) were influenza A and B co-infections.
The number of routinely notified cases of laboratory-confirmed influenza, particularly influenza A, increased from week 31 in a pattern that was generally consistent with GPSS ILI rates (Figure 3). Notified cases of both influenza A and influenza B influenza peaked in week 37 (week commencing 6 September), the same week as the GPSS rural ILI rate peak and one week after that of the GPSS metropolitan ILI rate.
Of the 1812 influenza A cases, 1001 (55%) were pandemic A(H1N1) 2009, 4 (< 1%) were A(H3N2) and 807 (45%) were not subtyped. The median ages for influenza cases were 28 years (range: 0–95 years) for routinely notified pandemic A(H1N1), 21 years (range: 0–94 years) for A(H3N2) and 24 years (range: 0–80 years) for influenza B cases. The highest proportion of notified cases of pandemic A(H1N1) 2009 was in the 0–4 years age group (13%) while those aged 5–39 years accounted for 61% of the routinely notified cases (Figure 5). Overall, there was a 1:1 male-to-female ratio among the routinely notified cases.
Four cases aged 1 month, 27, 50 and 68 years, notified in weeks 34, 33, 35 and 39, respectively, were reported to have died as a result of influenza A virus infections (three due to pandemic A(H1N1) 2009 and the other not subtyped).
Six respiratory outbreaks were notified to the Department of Health in 2010: one in week 26 (week commencing 21 June), one in week 35 (23 August), one in week 38 (13 September), one in week 41 (4 October) and two in week 44 (25 October). Four of the six outbreaks occurred in aged care facilities, one outbreak occurred in an assisted residential service, and one in a military facility. There were between three and 24 cases associated with each outbreak, corresponding to attack rates of 10%–45%. Of the four outbreaks in aged care facilities, all were caused by influenza A virus, of which two were influenza A (not further subtyped), one was due to a mixed infection [non-H1N1 and pandemic A(H1N1) 2009], and one was due to A(H3N2). The outbreaks in the assisted residential service and the military facility were typed as pandemic A(H1N1) 2009.
Of the 403 specimens and three isolates received at the WHO Collaborating Centre from Victoria, 261 (64%) yielded an influenza-positive isolate following cell culture. Of these, 250 (96%) were influenza A and 11 (4%) were influenza B. The majority (n = 231; 92%) of the influenza A viruses were pandemic A(H1N1) 2009, with 17 (7%) A(H3N2); two specimens contained mixed viral populations of pandemic A(H1N1) 2009 and A(H3N2) viruses. Following antigenic analysis, all of the pandemic A(H1N1) 2009 strains were found to be similar to the current vaccine strain A/California/7/2009 (apart from two low reactors). All A(H3N2) strains were similar to the current vaccine strain A/Perth/16/2009 (apart from two low reactors) and all influenza B strains were of the B/Victoria/2/87 lineage and similar to the current vaccine strain B/Brisbane/60/2008 (apart from one low reactor). All (n = 261) of the Victorian influenza-positive isolates and 45 clinical specimens were tested for susceptibility to the neuraminidase inhibitors oseltamivir and zanamivir. Three viruses were found to be oseltamivir resistant due to a H275Y mutation in the neuraminidase gene. Two of the resistant strains came from otherwise healthy patients that were not under oseltamivir treatment,5 while the third was isolated from a hospitalized child undergoing oseltamivir treatment.
The 2010 influenza season in Victoria was characterized by dominance of the pandemic A(H1N1) 2009 strain, which, as a seasonal second wave, was not only mild in magnitude as measured by ILI activity rates in comparison to the first wave (also in-season) in 2009 but also compared to previous seasons back to 2003. Almost 90% of GPSS swabs that tested positive for influenza were typed as pandemic A(H1N1) 2009, with the remainder comprised of influenza A(H3N2), influenza A (not subtyped) and influenza B. This distribution was generally consistent among notified cases to the Department of Health for which typing data were available. Pre-pandemic H1N1 influenza strains were not detected in 2010, suggesting the pandemic A(H1N1) 2009 strain has displaced seasonal A(H1N1).
Although ILI and influenza activity was lower, the dominance of pandemic A(H1N1) 2009 resulted in similarities between the 2009 and 2010 seasons, particularly the concentration of cases among children and young adults, the relatively low number of overall deaths and few reported ILI or influenza outbreaks in aged care facilities.2 Furthermore, the proportion of GPSS ILI cases that were swabbed was approximately 70%, compared to 35%–50% from 2003 to 2008, (P < 0.001) but similar to 2009 (68%), indicating heightened doctor and/or patient concern with respect to confirmation of pandemic influenza infection. The proportion of GPSS swabs positive for influenza was 36%, similar to the 39% in 20092 and the average of 36% for the years 2003 to 2007.6
Each of the surveillance systems indicated that the 2010 influenza season, effectively the second pandemic A(H1N1) 2009 influenza wave, was considerably milder in terms of influenza cases and ILI activity compared to the first season in 2009. This trend was noted in other southern hemisphere countries,7 but contrasts with the northern hemisphere and previous pandemics in which a mild first wave was followed by a second of generally greater activity and severity.8–10 The concurrent emergence of pandemic A(H1N1) 2009 globally resulted in an out-of-season first wave followed by an in-season second wave in the northern hemisphere. That the first wave in the southern hemisphere was in-season and followed by pandemic and seasonal influenza vaccination programmes may have induced sufficient levels of population immunity – suggested by serosurveys to be in the range of 16% to 26.7%11–15 – to help explain the difference in the relative magnitudes of the waves in each hemisphere. Also, 23% of ILI cases were vaccinated in 2010, which is significantly higher than the 13%–17% observed from 2005 to 2009 (P < 0.02).
The 2010 trivalent southern hemisphere influenza vaccine contained the pandemic A(H1N1) 2009 strain (A/California/7/2009) as well as A/Perth/16/2009 (H3N2) and B/Brisbane/60/2008. Antigenic analysis by the WHO Collaborating Centre indicated good matching with circulating strains in Victoria to those in the vaccine, suggesting the seasonal vaccine was effective during the 2010 season. This inference was supported by the significantly higher percentage of vaccinated influenza-negative ILI patients compared to those that tested positive for influenza. Using a test-negative case control study design, the GPSS data were used to demonstrate a statistically significant protective effect of the 2010 seasonal trivalent influenza vaccine against pandemic A(H1N1) 2009 infection. The vaccine effectiveness estimate was 79% (95% C.I.: 33%–93%) after adjusting for age and month of specimen collection.16
As observed in previous years, the MMDS ILI rate peaked slightly earlier than the corresponding GPSS rate, which in turn preceded the peak in notified cases of laboratory confirmed influenza. Thus, although less specific, the ILI systems provided a more timely indication of influenza activity than notifiable disease data.
Given their varied source populations (e.g. those that seek health care from GPs and locums and the hospitalized young or elderly17 that make up a higher proportion of notified cases) the surveillance systems assist in providing comprehensive influenza and ILI surveillance in Victoria. However there are several limitations of the surveillance. In 2010 there was no systematic or timely hospital (emergency department and inpatient) or mortality surveillance. The Influenza Complications Alert Network will commence in five Victorian hospitals in 2011 and thus provide more clinical and burden of disease data associated with hospitalized influenza. A further limitation of the system is the use of different ILI case definitions by the GPSS and the MMDS. Although it is difficult to speculate about the relative sensitivity and specificity of each system, it is comparison of ILI rate trends over time – rather than absolute values between each system – that best informs the level of ILI activity.
Victorian influenza surveillance system reports are available at https://www.victorianflusurveillance.com.au/.
None declared.
VIDRL receives support for its influenza surveillance programme from the Victorian Government Department of Health. The Melbourne WHO Collaborating Centre for Reference and Research on Influenza is supported by the Australian Government Department of Health and Ageing.
We gratefully acknowledge the ongoing support of general practitioners and their practice staff participating in the GPSS and Ms Josie Adams, Executive Director, for the continued involvement of MMDS in influenza surveillance in Victoria. We also thank private pathology providers who assisted with transport of respiratory specimens from metropolitan and rural general practices.
Laboratory testing was conducted by the Viral Identification Laboratory at VIDRL, and public health follow-up was undertaken by the Investigation and Response Section, Communicable Disease Prevention and Control Unit in the Department of Health. Staff of the WHO Collaborating Centre for Reference and Research on Influenza provided influenza strain identification data to the weekly VIDRL surveillance report.