a Emerging Diseases Surveillance and Response, Division of Health Security and Emergencies, World Health Organization Regional Office for the Western Pacific, Manila, Philippines.
Correspondence to Jeffrey Partridge (e-mail: partridgej@wpro.who.int).
To cite this article:
McCallum L and Partridge J. Epidemiological characteristics of the influenza A(H1N1) 2009 pandemic in the Western Pacific Region. Western Pacific Surveillance and Response Journal. 2010, 1(1):5-11. doi:10.5365/wpsar.2010.1.1.008
The first laboratory-confirmed cases of infection with pandemic influenza A(H1N1) 2009 in the Western Pacific Region were reported on 28 April 2009. By 11 June 2009, the day the pandemic was declared by the World Health Organization, nine Western Pacific Region countries and areas had reported laboratory-confirmed pandemic influenza A(H1N1) 2009 cases. From April 2009 to July 2010, more than 250 000 cases and 1800 deaths from laboratory-confirmed pandemic influenza A(H1N1) 2009 were reported from 34 countries and areas in the Region. By age group region-wide, 8.6%, 41.9%, 48.3%, and 1.2% of cases were in the < 5 years, 5–14 years, 15–64 years, and 65+ years age groups, respectively; the overall crude case fatality ratio in the Western Pacific Region was 0.5%. The pandemic demonstrated that region-wide disease reporting was possible. Countries and areas of the Western Pacific Region should take this opportunity to strengthen the systems established during the pandemic to develop routine disease reporting.
In mid-March 2009, the Mexico Ministry of Health identified an unusual increase in influenza-like illness (ILI). In mid-April 2009, the United States of America’s Centers for Disease Control and Prevention identified a novel influenza A(H1N1) virus from two people in California. By the end of the third week in April, patients with influenza-like or pneumonia-like symptoms in Texas and Mexico were confirmed as cases of infection with the same novel influenza A(H1N1) virus.1 Within days, cases of novel influenza A(H1N1) infections were reported from Canada, Spain, the United Kingdom, Israel, and New Zealand. Thus began the event that on 11 June 2009 was declared a pandemic by the World Health Organization (WHO).
The Western Pacific Region of WHO includes 37 countries and areas that span from the Northern Hemisphere, through the tropics and subtropics, to the Southern Hemisphere, and contain approximately 3.5 billion people, nearly half of the world’s population. From April 2009 to July 2010, more than 250 000 cases and 1800 deaths from laboratory-confirmed pandemic influenza A(H1N1) 2009 were reported from 34 countries and areas in the Region.2 This paper summarizes the available epidemiological and virological data on the influenza A(H1N1) 2009 pandemic from the Western Pacific Region.
A descriptive epidemiological study was conducted using data from multiple sources. Countries and areas included in the study were those with available data as of 31 October 2010. ILI and severe acute respiratory infection (SARI) case and death data were obtained from WHO.3 The date of first reported case for each of the Western Pacific Region countries and areas was determined from the WHO Western Pacific Regional Office media releases.4 Media reports included data reported to WHO by countries and data abstracted from Ministry of Health web sites.
Virological data were extracted from the Global Influenza Surveillance Network’s (GISN) database, FluNet.5 FluNet was created in 1996 and has been used since then as a global tool for influenza virological surveillance. The data are provided remotely by National Influenza Centres of the Global Influenza Surveillance Network and other national influenza reference laboratories collaborating actively with GISN, or are uploaded from WHO regional databases. Systematic sampling of ILI or SARI cases identified from country surveillance systems can approximate influenza disease trends.
Dates were reported as the first day of the corresponding epidemiological week where specific dates were not available. Pandemic peak for each country or area was determined from the number of confirmed cases reported through the International Health Regulations system or as reported on Ministry of Health web sites. The pandemic peak was defined as the week where the largest number of cases was reported from a country or area. Country data were excluded in the time-course analyses if no cases were reported as of mid-March 2010 or if it was unclear when the first cases were identified or reported.
Searches of Promed6 and Scopus,7 references from relevant articles or referrals from researchers identified additional data. Search terms were “pandemic influenza” and “influenza A(H1N1),” and the search was then narrowed by including either seroprevalence studies or studies reporting case fatality ratios.
For data presentation and comparison, countries and areas in the WPR were divided into four groups based on location and climate: the Northern Hemisphere (China, Japan, Mongolia and the Republic of Korea), the Tropical Zone (countries with data included Brunei Darussalam, Cambodia, Hong Kong [China], the Lao People's Democratic Republic, Malaysia, the Philippines, Singapore and Viet Nam), the Pacific Islands (Cook Islands, the Federated States of Micronesia, Fiji, Guam, Kiribati, the Marshall Islands, Papua New Guinea, Samoa, Solomon Islands, Tonga and Vanuatu), and the Southern Hemisphere (Australia and New Zealand).
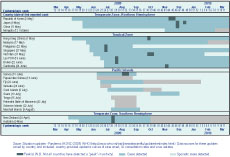
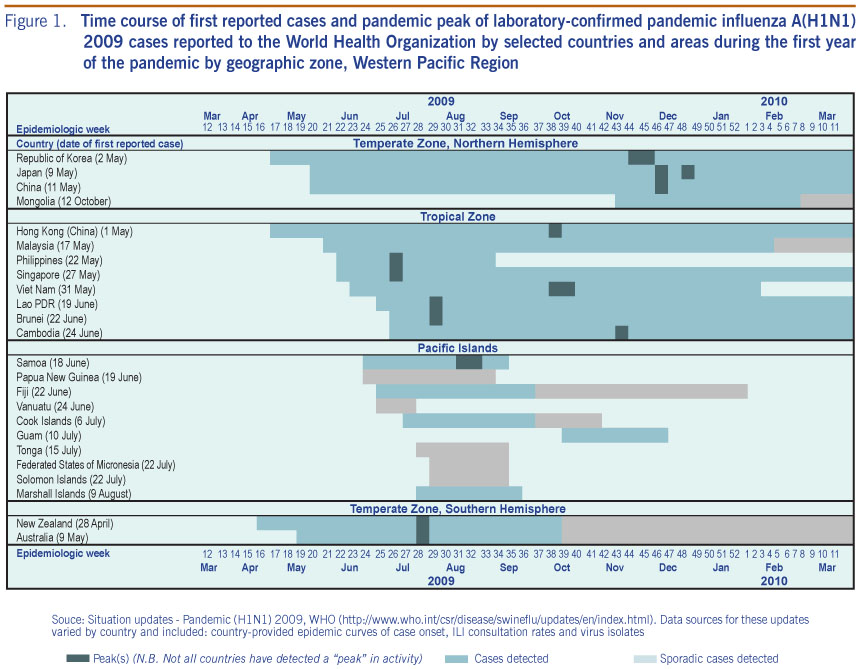
Data on date of first reported case were available for 24 countries and areas of the Region. The first laboratory-confirmed cases from the Region were reported from New Zealand in the Southern Hemisphere on 28 April 2009 followed closely by countries and areas in the Tropical Zone and Northern Hemisphere, Hong Kong (China) on 1 May 2009 and the Republic of Korea on 2 May 2009, respectively (Figure 1). The first confirmed case from the Pacific Islands was reported from Samoa on 17 June 2009.
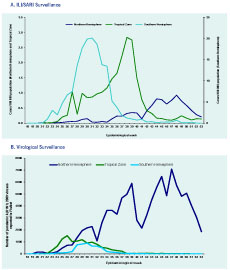
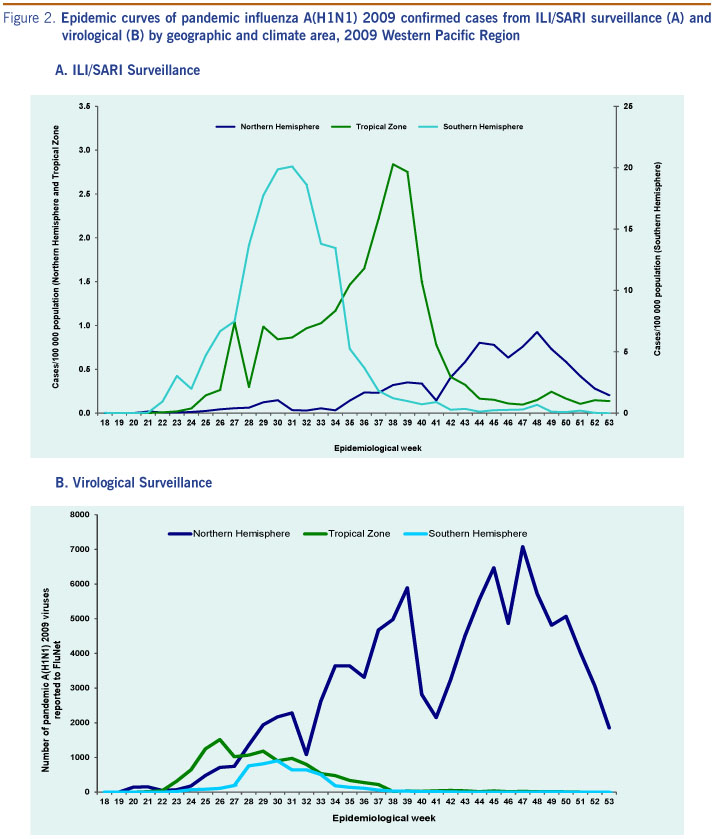
Overall, peak activity corresponded to the winter season (June to September 2009) in the Southern Hemisphere and fall/winter seasons (October to December 2009) in the Northern Hemisphere (Figure 2). Peak activity was less defined across the Tropical Zone, and ranged from July through October 2009. In the Pacific Islands, sporadic case identification or reporting was observed from June to August 2009 with peak activity only well defined in Samoa. There was a median of 13 weeks (mean of 16 weeks) from first reported confirmed cases to pandemic peak in 13 WPR countries and areas. The shortest time from first confirmed case to peak (7 weeks) was reported by the Lao People's Democratic Republic, while the longest period (30 weeks) was reported by Japan (Figure 1).
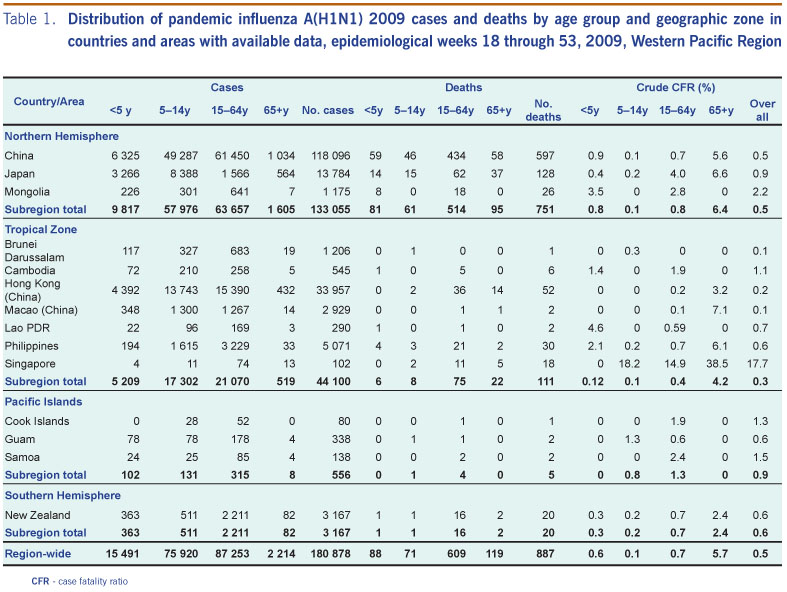
Detailed reported case and death data stratified by age group were available from 15 countries and areas of the WPR for the period that included epidemiological week 18 (3 to 9 May) through week 53 (27 to 31 December) of 2009. During that period, a total of 181 219 laboratory-confirmed cases were reported region-wide, with slightly more than 90% of the cases occurring in people 5–64 years of age (Table 1). By age group region-wide, 8.6%, 41.9%, 48.3%, and 1.2% of cases were in the < 5 years, 5–14 years, 15–64 years, and 65+ years age groups, respectively. The distribution of cases across age groups followed a similar pattern in each geographic or climate area; however, the proportion of cases belonging to the 15–64 years age group was higher in the data reported from the Pacific Islands (47.8%) and the Southern Hemisphere (47.8%).
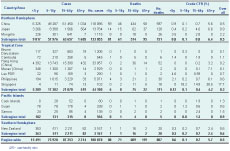
CFR - case fatality ratio
Based upon data from selected countries and areas from epidemiological weeks 18 to 53 of 2009, the overall crude case fatality ratio (CFR) in the WPR was 0.5%, and by age group it was 0.6%, 0.1%, 0.7%, and 5.4% for cases < 5 years, 5–14 years, 15–64 years and 65+ years age groups, respectively (Table 1). By geographic and climate areas, the overall CFR was 0.6% in the Northern Hemisphere, 0.3% in the Tropical Zone, 0.9% in the Pacific Islands, and 0.6% in the Southern Hemisphere.
From epidemiological weeks 18 to 53 of 2009, corresponding to 9 May through 31 December, 262 721 clinical specimens from ILI or SARI cases were reported to FluNet from the National Influenza Centres in 10 countries of the Region (Australia, Cambodia, China, Japan, Malaysia, Mongolia, New Zealand, the Philippines, the Republic of Korea, and Singapore). Out of the total specimens, 156 517 (60%) were influenza positive. Of these, 118 704 (76%) were reported as pandemic influenza A(H1N1) 2009 viruses. Reporting of pandemic influenza A(H1N1) 2009 viruses peaked during epidemiological week 26 (28 June to 4 July) in the Tropical Zone, week 30 (26 July to 1 August) in the Southern Hemisphere, and week 47 (22 to 28 November) in the Northern Hemisphere (Figure 2).
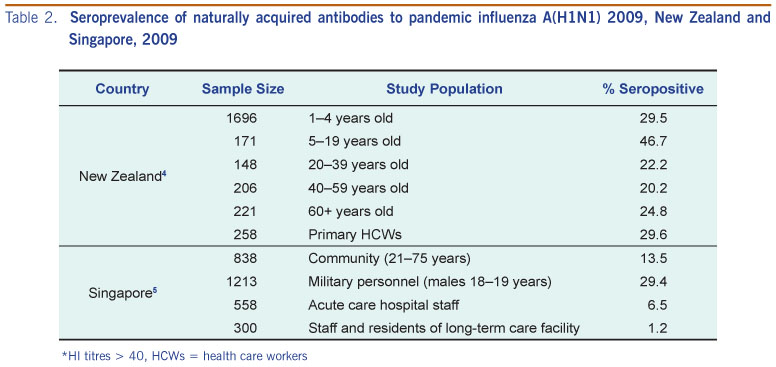
Results from two seroprevalence studies conducted in the Region were identified from the literature search (Table 2). In New Zealand, the seroprevalence of naturally acquired antibodies to pandemic influenza A(H1N1) 2009 varied with age and ranged from 20.2% for the 40–59 year age group to 46.7% in the 5–19 year age group.8 In Singapore, seroprevalence ranged from 1.2% for staff and residents of a long-term care facility to 29.4% for a sample of military recruits.9
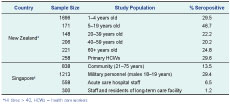
* HI titres > 40, HCWs = health care workers
The first pandemic influenza A(H1N1) 2009 cases in the world were laboratory-confirmed in the United States of America and Mexico on 15 and 23 April 2009, respectively.10,11 The first cases reported in the Region were confirmed on 28 April 2009 among a group of students returning to New Zealand from Mexico.12 By 11 June 2009, the day the pandemic was declared by WHO, nine countries and areas had reported laboratory-confirmed pandemic influenza A(H1N1) 2009 cases. Because countries and in the Region are spread across both the Northern and Southern Hemispheres and across all climate zones, the time course of the pandemic varied across the Region. Dates of reported peak influenza activity ranged across the second half of 2009 from July to December. This is consistent with what has been reported on the differing patterns of seasonal influenza across the Region.13,14
Although more than 250 000 laboratory-confirmed cases of pandemic influenza
A(H1N1) 2009 were reported from April 2009 to July 2010, these figures certainly represent an underestimate of the number of individuals infected due to limitations in surveillance systems, the resources available to health care providers, health-seeking behaviours, specimen collection and testing policies and the sensitivity and specificity of laboratory tests. However, efforts to strengthen surveillance systems (including laboratory confirmation capacity) as part of pandemic preparedness heightened awareness of influenza in the public and with medical professionals. The implementation of International Health Regulations (2005) by countries likely contributed to increased identification, confirmation and reporting of influenza cases during the pandemic.
The estimation of CFR is dependent on the data or case definition used for the denominator (total number of cases) and the numerator (number of deaths). A crude CFR can be calculated using confirmed cases as the denominator and confirmed deaths as the numerator; however, this approach is likely to overestimate the CFR. A potentially more meaningful CFR can be calculated using symptomatic cases as the denominator.15 The crude CFR calculated from WPR data is similar to that reported in published studies internationally with crude CFR estimates at 0.2% to 0.9%.16–19 Studies from Singapore,20 Australia21 and New Zealand22 have estimated the symptomatic CFR to be two orders of magnitude lower than crude estimates at 5–9 confirmed pandemic influenza A(H1N1) 2009 deaths for every 100 000 symptomatic cases. These estimates are similar to that found in the United States of America (symptomatic CFR 0.007%).23 Therefore, although the CFR estimates presented may be useful for tracking severity over time and making comparisons across countries, they certainly overestimate actual case fatalities.
The reported virological data roughly track the ILI/SARI disease trends in the Region (Figure 2). The extended and increased peak in the Tropical Zone ILI data that is not occurring in the virological data is likely due to the inclusion of Hong Kong (China) data for ILI, but Hong Kong (China) is not included in the presented virological data. Availability of virological data for this study was dependent upon active participation in the GISN FluNet reporting system by countries and areas. Although during the pandemic period there were 20 National Influenza Centres in the Region, only 10 Centres submitted reports through FluNet limiting interpretation of virus data across the Region due to the lack of data from several countries and areas of the Region. Interpretation of data across time was also constrained by changes in specimen collection and laboratory testing policies during the pandemic period.
Seroprevalence studies have determined levels of immunity to pandemic influenza A(H1N1) 2009 in various population groups around the world. Of particular interest are seroprevalence studies that measure only naturally acquired immunity (i.e. conducted before vaccine availability or excluded vaccinated individuals) since these can give an indication of natural infection rates in the community. There are limited data available on naturally acquired immunity from the countries in the Region. The studies from both New Zealand and Singapore reported that seropositivity proportions varied by age, and the New Zealand study particularly reported the highest seropositivity proportion in school-age children (46.7%), which is consistent with studies conducted in the United States of America24 and the United Kingdom,25 possibly reflecting higher contact rates and subsequent higher infection rates for this age group.
In conclusion, the availability of data from most of the countries and areas in the Western Pacific Region is a testament to the great strides made across the Region in terms of strengthening surveillance systems, including the establishment of laboratory facilities for case confirmation. The pandemic demonstrated that region-wide disease reporting was possible. Countries and areas of the Western Pacific Region should take this opportunity to strengthen the systems established during the pandemic to develop routine disease reporting.
None declared.
None.
The authors would like to acknowledge the countries and areas of the Western Pacific Region for providing the data used in this regional analysis.