a Victorian Infectious Diseases Reference Laboratory, Melbourne, Australia.
b National Centre for Epidemiology & Population Health, Australian National University, Canberra, Australia.
c Communicable Disease Epidemiology and Surveillance, Victorian Government Department of Health, Melbourne, Australia.
d World Health Organization Collaborating Centre for Reference and Research on Influenza, Melbourne, Australia.
e Department of Epidemiology & Preventive Medicine, Monash University, Melbourne, Australia.
f The Alfred Hospital, Melbourne, Australia.
Correspondence to Fielding (e-mail: james.fielding@mh.org.au).
To cite this article:
Fielding J et al. Epidemiology of the 2012 influenza season in Victoria, Australia. Western Pacific Surveillance and Response Journal, 2012, 4(3):42–50. doi:10.5365/wpsar.2013.4.2.007
Objective: To assess the magnitude and severity of the 2012 influenza season in Victoria, Australia using surveillance data from five sources.
Methods: Data from influenza notifications, sentinel general practices, a sentinel hospital network, a sentinel locum service and strain typing databases for 2012 were descriptively analysed.
Results: Influenza and influenza-like illness activity was moderate compared to previous years, although a considerable increase in notified laboratory-confirmed influenza was observed. Type A influenza comprised between 83% and 87% of cases from the general practitioners, hospitals and notifiable surveillance data. Influenza A/H3 was dominant in July and August, and most tested isolates were antigenically similar to the A/Perth/16/2009 virus used in the vaccine. There was a smaller peak of influenza type B in September. No tested viruses were resistant to any neuraminidase inhibitor antivirals. Higher proportions of type A/H3, hospitalized cases and those with a comorbid condition indicated for influenza vaccination were aged 65 years or older. Influenza vaccination coverage among influenza-like illness patients was 24% in sentinel general practices and 50% in hospitals.
Discussion: The 2012 influenza season in Victoria was average compared to previous years, with an increased dominance of A/H3 accompanied by increases in older and hospitalized cases. Differences in magnitude and the epidemiological profile of cases detected by the different data sources demonstrate the importance of using a range of surveillance data to assess the relative severity of influenza seasons.
Victoria is Australia’s southernmost mainland state with a population of approximately
5.5 million and a median age of 37.3 years.1 It has a temperate climate and an influenza season that usually occurs between May and October. The Victorian influenza surveillance system consists of several surveillance data sources used to monitor seasonal influenza and influenza-like illness (ILI) activity in Victoria: notified laboratory-confirmed influenza, sentinel general practices and hospitals, a sentinel metropolitan locum service and reference laboratory typing.
Medical practitioners and laboratory personnel are required by state law to notify the Department of Health of all laboratory-confirmed cases of influenza within five days of diagnosis. Identification, demographic and diagnostic data must also accompany the notification.
The Victorian General Practice Sentinel Surveillance (GPSS) programme provides reports on ILI by sentinel general practitioners (GPs) from May to October each year. A subset of these ILI cases is swabbed for laboratory testing for influenza.2 The Influenza Complications Alert Network (FluCAN) is a real-time sentinel hospital surveillance system for acute respiratory disease and collects surveillance data on hospitalised adults with laboratory-confirmed influenza.
The Melbourne Medical Deputising Service (MMDS) is the largest medical locum service in Australia and provides 24-hour medical services to patients at their residence in the Melbourne metropolitan area and Geelong. MMDS provides the proportion of ILI diagnoses made from all consultations. Influenza-positive samples submitted to the World Health Organization (WHO) Collaborating Centre for Reference and Research on Influenza for strain characterization and antiviral drug sensitivity testing comprise the fifth surveillance data source.
The objectives of the Victorian influenza surveillance system are to: monitor the epidemiology of laboratory-confirmed influenza in Victoria; identify the onset, duration and relative severity of annual influenza seasons in Victoria; provide samples for the characterization of circulating influenza strains in the community to assist in the evaluation of the current seasonal vaccine and formulation of the following season’s vaccine; provide potential for early recognition of new influenza viruses and new or emerging respiratory diseases; and estimate influenza vaccine effectiveness each year.
Here we describe the epidemiology of the 2012 influenza season from the Victorian influenza surveillance system.
Records of all laboratory-confirmed influenza cases (defined as detection of influenza virus by nucleic acid testing or culture from an appropriate respiratory tract specimen) with a 2012 notification date were extracted from the Department of Health Public Health Event Surveillance System on 19 March 2013. For consistency and comparability only cases classified as “routinely notified” were used in the descriptive analyses; this excluded cases identified from outbreak investigations and GPSS but included FluCAN cases, which were unable to be separated from the data set. As this report focuses on case-based surveillance, notified institutional outbreaks were excluded.
In 2012, 104 GPs (74 from 29 metropolitan practices and 30 from 12 rural practices) participated in GPSS, which operated from 30 April to 28 October (weeks 18 to 43) inclusive. The number of ILIs, defined as a case with fever, cough and fatigue/malaise,3 and total consultations per week were submitted weekly by fax, e-mail or online submission. ILI rates were calculated as the number of ILI patients per 1000 consultations.
GPs collected either a nose or throat swab from a subset of patients presenting within four days of symptom onset, chosen at the discretion of the GP. Data collected on swabbed patients included: age, sex, symptoms (fever, cough, fatigue, myalgia, other), seasonal influenza vaccination status (for 2012 and the previous 2011 vaccines), date of vaccination/s and any co-morbidity for which influenza vaccination is recommended.4
Testing of these clinical specimens comprised extraction of ribonucleic acid and in-house validated real-time multiplex polymerase chain reaction (PCR) assays to detect type A influenza viruses (matrix gene), type B influenza viruses (nucleoprotein gene) and type C influenza viruses (matrix gene). Influenza A virus-positive samples were further subtyped using individual real-time PCR assays incorporating primers and probes specific for the haemagglutinin gene of A(H1N1)pdm09 and A(H3) strains.
FluCAN is a hospital-based programme that collects surveillance data on hospitalized patients with laboratory-confirmed influenza in near real-time.5 The network also aims to estimate vaccine coverage and vaccine effectiveness by comparing vaccination status in PCR-confirmed cases with a sample of test-negative controls. In Victoria, four hospitals are involved, two of which have paediatric units that collect data on hospitalized children.6 Subtyping of influenza A virus infections is not routinely conducted in FluCAN.
Weekly rates of influenza-related diagnoses by MMDS clinicians per 1000 consultations were calculated from records returned from the MMDS clinical database using the search terms “influenza” and “flu.” To avoid inclusion of those immunized prophylactically, records that contained the terms “Fluvax,” “at risk” and “immunization” were excluded.
In 2012, all influenza-positive GPSS samples tested by the Victorian Infectious Diseases Reference Laboratory (VIDRL) as well as a selection of virus specimens and isolates tested by other Victorian laboratories were forwarded to the WHO Collaborating Centre for Reference and Research on Influenza for strain characterization and antiviral drug sensitivity testing. Samples were first inoculated into Madin-Darby Canine Kidney cells to obtain virus isolates. Those successfully isolated were then analysed by haemagglutination inhibition assay to determine antigenic similarity to the current vaccine strains. Isolates were also tested in a neuraminidase inhibition assay to determine susceptibility to the antiviral drugs oseltamivir, zanamivir, peramivir and laninamivir.
Descriptive analyses of the surveillance data were conducted in Microsoft Excel. Distributions of influenza and vaccination status by type/subtype, age group and presence of a comorbid condition were compared using the chi-squared test in Stata (version 10.0; StataCorp LP, College Station, TX, USA) with P < 0.05 considered significant.
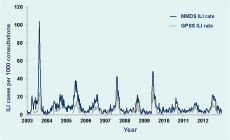
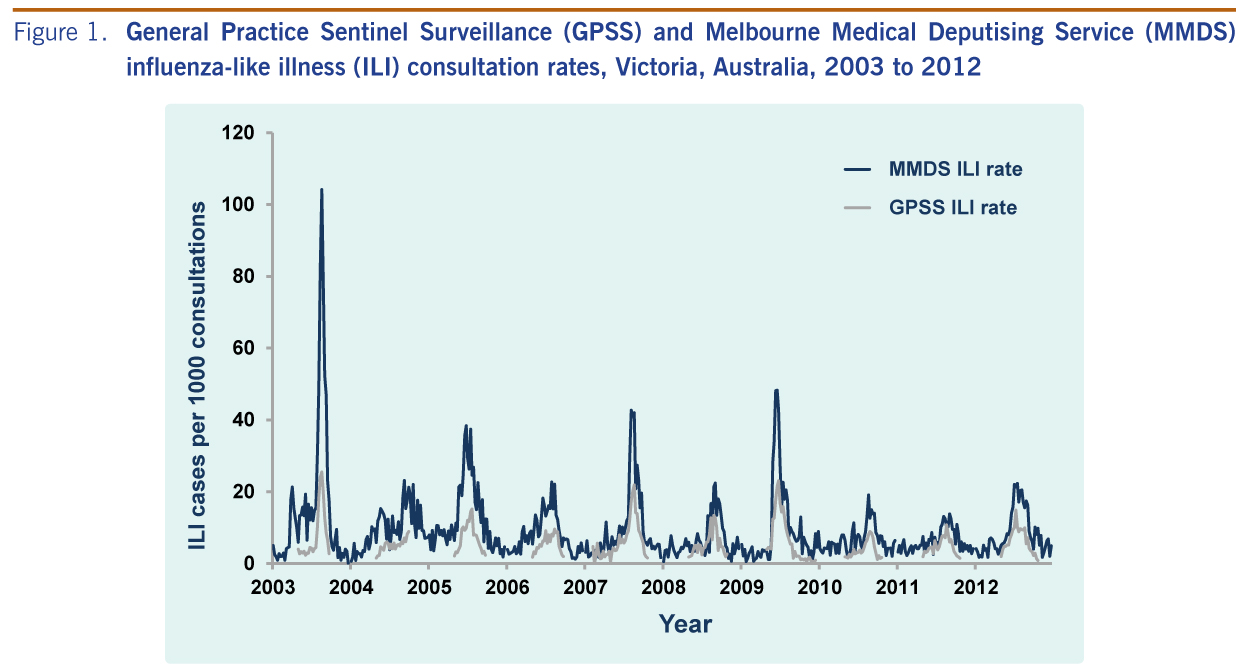
In 2012 GPPS conducted 186 375 consultations during the 26-week surveillance period, of which 1176 (six per 1000 consultations) were for patients with ILI. Consultations for ILI were significantly higher for metropolitan GPs compared to rural GPs (seven and five per 1000 consultations, respectively; P < 0.001). During the same period, 948 cases of ILI were diagnosed from 76 267 MMDS consultations (12 per 1000 consultations). ILI cases peaked at 14.9 and 22.3 per 1000 consultations for the GPSS and MMDS systems during the week ending 15 July and one week later, respectively; both were slightly higher than those observed in 2010 and 2011 (Figure 1). Elevated ILI activity was sustained in MMDS for approximately two months beginning in early July (Figure 2).
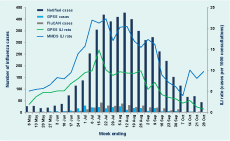
Notified cases – cases notified to Department of Health; GPSS – General Practice Sentinel Surveillance; FluCAN – Influenza Complications Alert Network; ILI – influenza-like illness; MMDS – Melbourne Medical Deputising Service
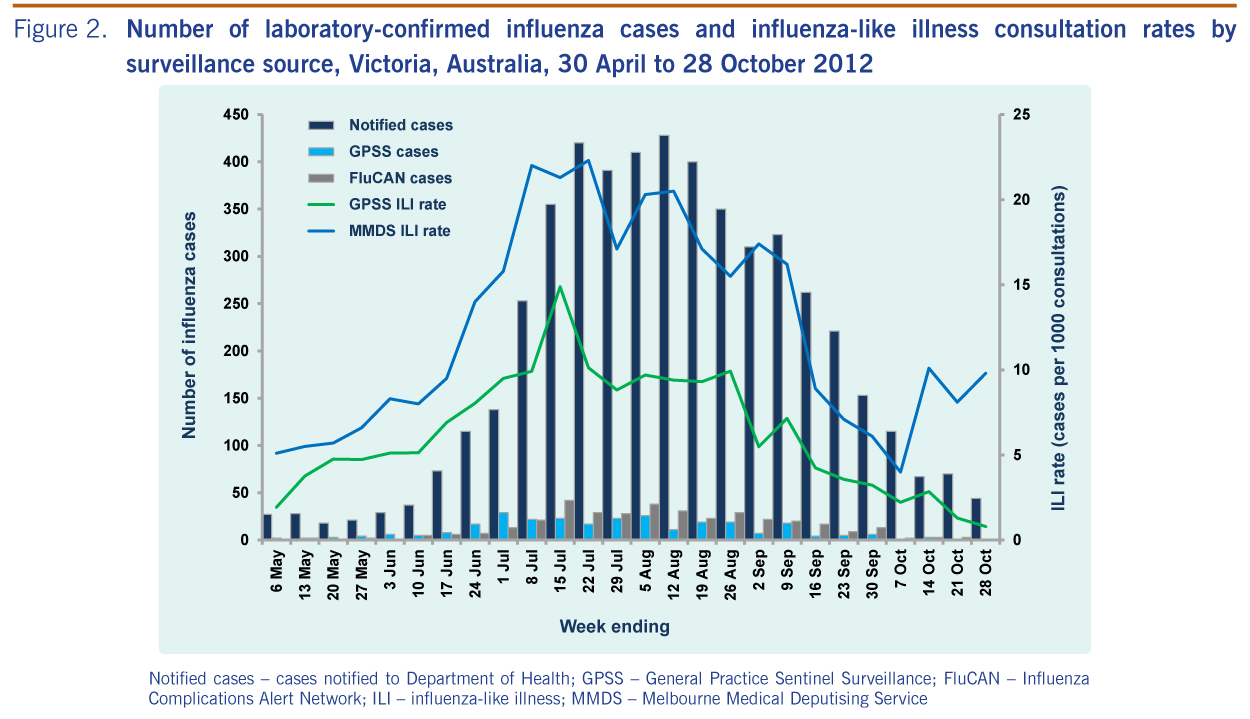
Laboratory-confirmed influenza cases were reported from three sources – notified cases (n = 5058), GPSS (n = 280) and FluCAN (n = 389) (Table 1). There was no clearly defined peak for notified cases in 2012, although 72% were notified in the two months between mid-July and mid-September (Figure 2). There were also no well-defined peaks for laboratory-confirmed cases of influenza from GPSS and FluCAN, although for FluCAN hospitals the highest number of cases admitted was in mid-to-late July (Figure 2).
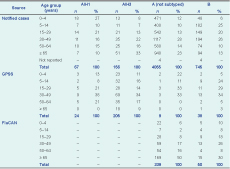
Notified cases – cases notified to Department of Health; GPSS – General Practice Sentinel Surveillance; FluCAN – Influenza Complications Alert Network.
* Excluding 29 notified cases of type A and B coinfection and 10 cases of type C (six notified cases and four from GPSS).
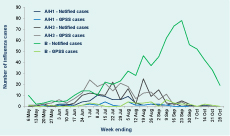
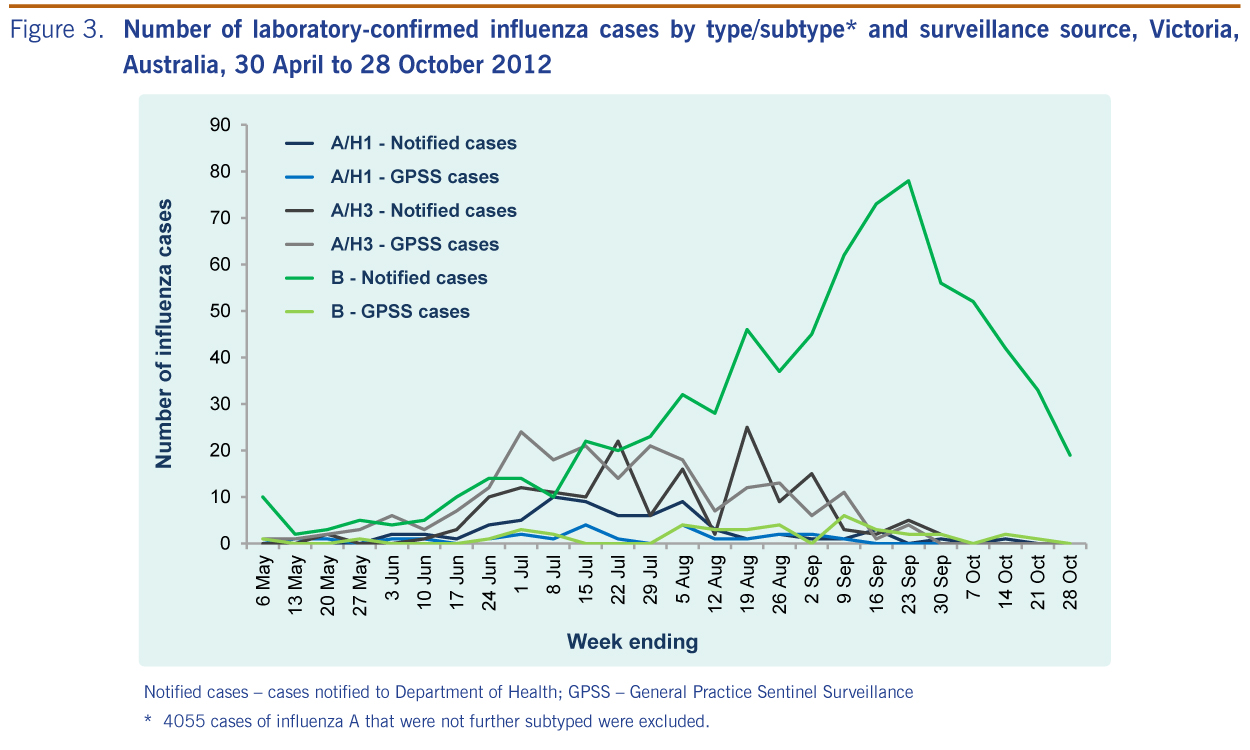
Most notified cases (n = 4278; 85%) were influenza type A with subtyping reported for 223 (5%); of these, 67 (30%) were H1 and 156 (70%) were H3. H3 cases were detected throughout the peak period while H1 cases were mainly reported in July. There were also 745 cases (15%) of influenza type B notified, predominantly in the latter half of the surveillance period (Figure 3); 29 cases of type A and type B coinfection; and six cases of type C infections.
Notified cases – cases notified to Department of Health; GPSS – General Practice Sentinel Surveillance
* 4055 cases of influenza A that were not further subtyped were excluded.
Of the 1176 ILI cases identified from GPSS, 709 (60%) were swabbed and 280 (39%) were positive for influenza. The proportion of swabbed ILI cases positive for influenza ranged from 15%–25% until mid-June then quickly rose to 40%–60% until late September, and from 35% in 50–64 year-olds to 54% among those aged 5–14 years (P = 0.06). Of the 280 laboratory-confirmed influenza cases from GPSS, 205 (73%) were A/H3 infections, 24 (9%) were A/H1, 38 (14%) were type B and four were type C; specimens from the remaining nine influenza A cases contained insufficient virus for subtyping. Most (71%) of the type B cases were detected in August and September (Figure 3). The majority of the 389 FluCAN cases (n = 339; 87%) were type A but were not subtyped.
Sixteen notified cases were reported to have died due to influenza: one due to type B infection and the remainder type A, of which three were subtyped as H3. Twelve cases were aged 65 years or older, one was aged zero to four years, with the remaining three cases aged between five and 64 years.
The age group with the highest proportion of laboratory-confirmed cases was those aged 30–49 years for both notified cases (27%) and GPSS (34%). There were also relatively high proportions of cases aged 65 years or older from FluCAN and notified cases (47% and 22%, respectively) but not GPSS (7%). However, the rate of notified cases was highest for those aged zero to four years and 65 years or older, with 154 and 137 notified cases per 100 000 population, respectively, compared to 61–90 per 100 000 for the other age groups.
There was a significant difference in the age distribution of notified cases by influenza type B and A subtypes (excluding influenza A cases that were not subtyped, P < 0.001). A higher proportion of influenza A/H1 cases were aged zero to four years, whereas for influenza A/H3 cases, a higher proportion were aged 65 years or older. There was no difference observed in GPSS (P = 0.12) (Table 1). In FluCAN, cases of influenza type A were significantly older than those with type B (P = 0.003).
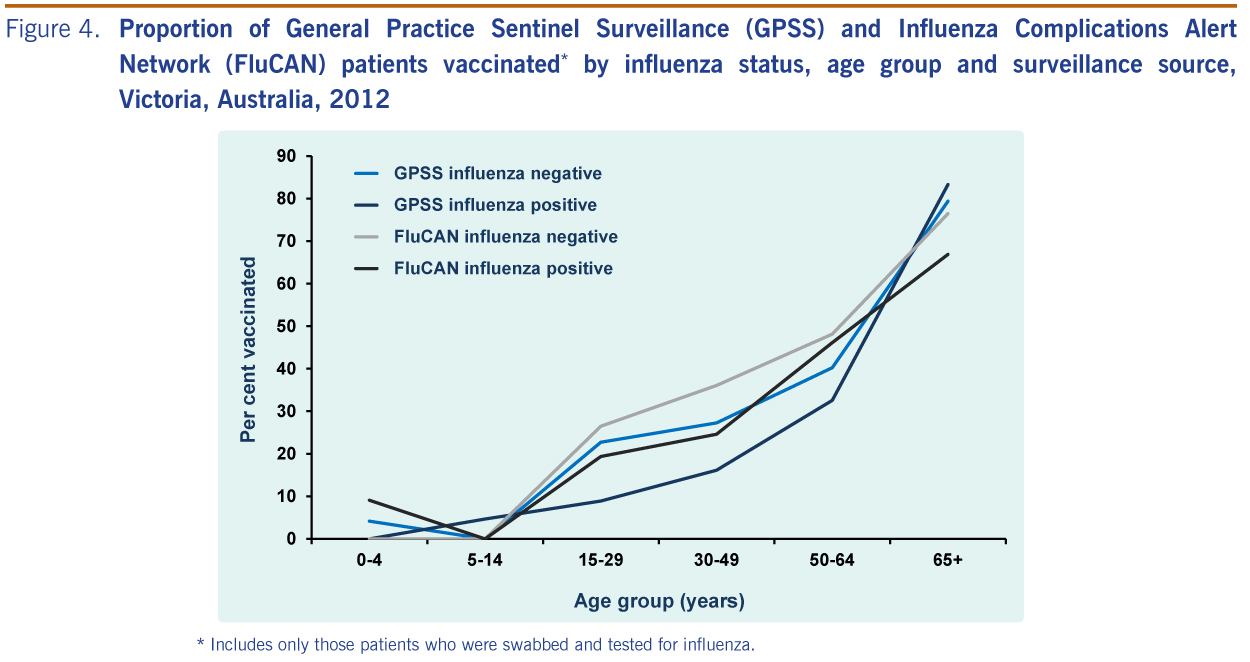
Vaccination status was recorded for 688 (97%) of 709 swabbed GPSS patients of whom 168 (24%) reported being vaccinated. FluCAN collected vaccination status from cases and influenza-negative controls and recorded vaccination status for 772 of 935 (83%) patients who had been swabbed, half of whom were vaccinated (n = 385; 50%). There was no statistically significant difference between the proportion of influenza-positive and -negative patients with known vaccination status in either GPSS (P = 0.89) or FluCAN (P = 0.23). For both surveillance data sets the proportion of patients vaccinated increased with age (Figure 4). With the exception of those aged 65 years or older in GPSS, the proportion of influenza-positive patients who were vaccinated in adult age groups was lower than the proportion of influenza-negative patients who were vaccinated in each system.
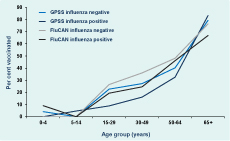
* Includes only those patients who were swabbed and tested for influenza.
Data on comorbidities for which influenza vaccination is indicated were reported for 632 (89%) of the 709 swabbed patients from GPSS. The presence of a comorbid condition was reported for 111 (18%) of swabbed patients; there was no difference between influenza-positive and influenza-negative patients (17% compared with 18%;P = 0.60). However, the proportion with a reported comorbidity rose steadily with increasing age group from 3% in those aged zero to four years to 58% in the 65 years or older age group (P < 0.001). In FluCAN patients, the proportion with a reported comorbidity rose steadily with increasing age group from 31% in those aged zero to four years to 87% in the 50–64 year age group and 90% in the 65 years or older age group.
A total of 1293 patient specimens were submitted to the WHO Collaborating Centre in 2012. Culture was attempted for 1095 of these samples, with 563 (51%) yielding an influenza virus isolate: 470 (83%) type A viruses, 92 (16%) type B viruses and one type C virus. Most of the viruses isolated were A/H3 viruses (n = 437, 93%) with most of these (82%) being antigenically similar to the A/Perth/16/2009 virus used in the seasonal influenza vaccine. A/H1 viruses comprised just 7% (n = 33), with 29 being antigenically similar to the A/California/7/2009 strain used in the vaccine; the remaining four were low reactors (haemagglutination inhibition titre ≥ 8 fold lower). Among the 92 type B viruses isolated, 54 (59%) were antigenically similar to the B/Brisbane/60/2008 (Victoria lineage) strain used in the vaccine. The remainder included 16 Victoria and 21 Yamagata lineage viruses.
Neuraminidase inhibition assays indicated that none of the 473 viruses tested was resistant to any of the antiviral drugs tested.
The magnitude of ILI activity in the 2012 influenza season in Victoria, as shown by GPSS and MMDS, was slightly higher than 2010 and 2011 but broadly average compared to the previous 10 years. Although the proportion of ILI patients identified by MMDS was higher than GPSS, both were consistent with trends observed in previous years. The number of laboratory-confirmed influenza cases from GPSS was also comparable to 2010 and 2011.7,8 The number of patients reported through FluCAN in 2012 was considerably higher than the 146 cases reported in 2011 (the first year that all four hospitals participated in FluCAN).9 Notified cases of laboratory-confirmed influenza increased by 68% in 2012 compared to 2011 and was also much higher than the 1914 notified cases in 2010.7,8 This increase was disproportionate compared with that of the other data sources in the Victorian surveillance system; therefore we believe the increase in notified cases reflects an increase in testing rather than a dramatic increase in disease.10
Type A influenza peaked during July and August, with a much smaller peak of type B in September. Subtyping of viruses from GPSS and a subset of notified cases indicated the 2012 season was dominated by influenza A/H3, continuing the trend of seasonal dominance of A/H3 away from the emergence and almost exclusive predominance of influenza A(H1N1)pdm09 in 2009.11 A season in which H3 is the dominant subtype followed by a smaller type B increase is a well-established pattern of influenza epidemics during the winter months of temperate zones,12 as in Victoria in 2007,13 New Zealand in 2012,14 the United States of America15 and Canada16 during the 2012/13 northern hemisphere influenza season.
Although the type A influenza reported through FluCAN were not further characterized, it is likely that a substantial proportion were A/H3 infections, given that a high proportion of FluCAN cases were aged 65 years or older and that many cases in this age group among notified cases were A/H3. A higher median age of A/H3 cases compared to seasonal A/H1 and type B cases has recently been observed in Victoria.17 However, the increase of H3 in older cases only partially explains the increase in all notified cases; similar proportional increases were observed across all age groups, possibly arising from increased presentation of more severe cases caused by A/H3 virus infections across all ages as well as increased testing.
The proportion of ILI patients who were swabbed in GPSS declined to 60% in 2012 from 71% in both 2010 and 2011.7,8 As the aim of this component of GPSS is to determine what strains are circulating each season, demographic and other data are not collected on these patients. Therefore further comparison cannot be made, neither over the years nor between those that were swabbed or not. While providing flexibility to the doctors, discretionary swabbing is also a limitation of GPSS as factors that may influence a GP to differentially swab one patient over another (such as age or vaccination status) are unknown.
Vaccination coverage among patients in both GPSS and FluCAN systems increased between 2011 and 2012, possibly due to a shift in age distribution to older patients in 2012.6,18 Higher vaccination coverage in FluCAN patients compared to GPSS in both years may be due to the older age distribution and higher prevalence of comorbid conditions indicated for influenza vaccination (groups for which influenza vaccine is provided free through the National Immunization Programme4) of those attending hospitals compared to general practice.
Two observations from the surveillance system suggest that the 2012 seasonal trivalent influenza vaccine (comprised of A/California/7/2009 (H1N1)pdm09-like virus, an A/Perth/16/2009 (H3N2)-like virus and a B/Brisbane/60/2008-like virus)19 may have been moderately effective. First, the results of strain typing suggested a good antigenic match of vaccine strains – particularly the A/H1 and A/H3 subtypes – to a high proportion of Victorian isolates for which strain characterization testing was undertaken. Second, a higher proportion of swabbed patients in nearly all adult age groups of GPSS and FluCAN who were negative for influenza were vaccinated compared to those who tested positive. However, these findings should be interpreted with caution. We have previously demonstrated with Victorian data that an apparent good match of vaccine to circulating strains does not necessarily correlate with greater vaccine effectiveness.20 It has been suggested that antibody immunity measured by haemagglutination inhibition assay may not be an optimal correlate of protection against clinical infection because it may not always detect drift in the haemagglutinin antigen.21,22 Also, the relatively few participating institutions and limited number of specimens forwarded for strain characterization may not necessarily be representative of all virus/es circulating in the community. The calculation of influenza vaccine effectiveness from surveillance data requires application of a more systematic methodology,18,23 which will be reported separately.
The inclusion of hospitalized cases from FluCAN augmented the Victorian influenza surveillance system in 2012 by including cases at the severe end of the clinical spectrum. However, while FluCAN cases were reported independently, they were also included in the notified cases data set. While community surveillance suggested a relatively benign influenza season, hospital data indicated an increase in severe disease among older people, presumably associated with A/H3. This demonstrates the importance of using a range of surveillance data sources. Efforts are continuing to improve the quality and breadth of integrated influenza surveillance in Victoria by subtyping a higher proportion of type A influenza infections (especially those identified through FluCAN) and examining the feasibility of establishing ILI and influenza surveillance in hospital emergency departments.
None declared.
VIDRL receives support for its influenza surveillance programme from the Victorian Government Department of Health. The Melbourne WHO Collaborating Centre for Reference and Research on Influenza is supported by the Australian Government Department of Health and Ageing. FluCAN is supported by the Department of Health and Ageing.
We thank GPs for their ongoing participation in and support for the sentinel surveillance programmes and Josie Adams for the continued involvement of the Melbourne Medical Deputising Service in influenza surveillance in Victoria. We also thank Lou Irving, Deb Friedman, Tony Korman and Tom Kotsimbos for their valuable contributions to FluCAN.
Laboratory testing was conducted by the Viral Identification Laboratory at VIDRL and public health follow-up was undertaken by the Investigation and Response Section, Communicable Disease Prevention and Control Unit in the Department of Health. Staff of the WHO Collaborating Centre for Reference and Research on Influenza provided influenza strain identification data to the weekly VIDRL surveillance report.