Urban Acupuncture in the Era of Ubiquitous Media: Cases from Rome and Turin
- Professor, ISIA Design Florence, Italy. Email: salvatore.iaconesi@artisopensource.net
- Professor, ISIA Design Florence, Italy. Email: oriana.persico@gmail.com
INTRODUCTION
When we experience territories, we create stories. We model these stories using mental maps. A mental map refers to one person's point of view perception of their own world, and is influenced by that person's culture, background, mood and emotional state, instantaneous goals and objectives. In the density of cities, this process happens for potentially millions of people at the same time. In his work, "The Image of the City", Kevin Lynch (1960) described cities as complex time-based media, as symphonies produced by millions of people at the same time in their polyphonic way of acting, moving, interpreting, perceiving and transforming the ambient around themselves: a massive, emergent, real-time, dissonant and randomly harmonic work of time-based art with millions of authors that are changing all the time.
The simultaneous presence of this myriad of mental maps suggests the possibility to compare them, to measure their intersections and differences. In this, it is possible to adopt extended definitions for objects such as landmarks (Haken & Portugali, 2003) to refer to any distinguished city elements that shape our mental maps, thus including urban elements which possess - even temporarily - some personal, historical, or cultural meaning (Appleyard, 1969; Golledge & Spector, 1978).
In a further step, in the direction of citizen activation, we can also imagine to make the information and understandings of these mental maps - and their similarities, differences, correlations and flows - widely known and usable, through the description of a 'relational ecosystem'. This would come under the form of a multi-dimensional map (of the perception of the city, along the axes of time, space, emotions and themes) in which subjects (city dwellers) appear not only in terms of their perceptions (a dot on the map, for example, would describe a specific element of perception in the urban context, described in terms of where it is, at what time it is, and expressing emotional themes), but also according to their interrelations, both subjective (because the expression is meant to be communicated) and objective (because two or more expressions are related in a certain way).
The theory of Urban Acupuncture has been confronted with similar issues from an interesting perspective. This process tries to use small-scale interventions to transform the larger urban context. Sites are selected through an aggregate analysis of social, economic, and ecological factors, and developed through a dialogue between designers and the community. Urban acupuncture produces small-scale but socially catalytic interventions into the urban fabric (Casagrande & Harrison, 2013). This strategy views cities as living, breathing organisms and pinpoints areas in need of repair. Sustainable projects, then, serve as needles that revitalize the whole by healing the parts. By perceiving the city as a living creature, thoroughly intertwined, "urban acupuncture" promotes communitarian machinery and sets localized nucleus ? similar to the human body's meridians. Satellite technology, networks and collective intelligence theories, are all used in this practice to surgically and selectively intervene in the nodes that have the biggest potential to regenerate. The term was originally coined by Barcelonan architect and urbanist, Manuel de Sola Morales (1999 and 2004).
In our working hypothesis, this possibility of employing mental maps suggests the reframing of the concept of 'urban acupuncture' (Casagrande, 2008, 2010), transforming it into a technique which uses the mental maps of the city - and the information about its relational ecosystem - to enable the emergence of collaboration and participation patterns in which administrations, citizens and organizations perform small-scale interventions to transform the larger urban context. The sections of this research note that follows, identify our study objectives and research questions and methodology. This will be followed by a discussion of our study's interim results and conclusions.
OBJECTIVES AND RESEARCH QUESTIONS
Smartphones and their applications allow us to merge our physical understanding of the world with the digital one. The two have, in fact, become so interwoven and interconnected as to form a new physicality, visuality and tactility (de Kerckhove, 1997). Moreover, according to works such as Mitchell's "City of Bits" (1996), McCullough's "Digital Ground" (2005), Zook's and Graham's "DigiPlace" (2007) we are constantly immersed in emergent networks of interconnected data, information and knowledge which is produced by myriad sources and subjects in the course of our daily lives. This data and information radically shapes the ways in which we have learned to work, learn, collaborate, relate, consume and perceive our environment.
Situated and ubiquitous information is able to powerfully transform, in real-time, the ways in which we experience places, objects and services, by providing wide accessibility to people's stories, emotions, expectations and visions. For example, Casagrande defines the concept of 'time-ecology' (2008) as the relationship between the human-made structure, nature and the human being. In our proposed approach, this relationship can be extended to include the infoscape, the data and information landscape, as it manifests itself onto physical space, through people's expression and the ones of digital information systems. This extension can include the part of the infoscape which is generated by city dwellers on digital social networks. In this way we can describe an accessible, usable version of the 'relational ecosystem' of the city.
In our research process we have used this approach to try to provide answers to the following questions:
- How can we observe, analyze and measure the digital relational ecosystem in a city and how is it expressed on major digital social networks such as Facebook, Twitter, Instagram, LinkedIn and Foursquare?
- How can we model the ways in which information, knowledge and emotions flow in the urban digital ecosystem?
- How can we make information on the urban digital ecosystem accessible and usable to administrations, citizens and organizations, to facilitate the emergence of 'urban acupuncture' practices, in the way in which we have redefined them?
The next section describes the methodology we employed in our two case studies to observe, analyze and measure the fluid urban digital ecosystem in two Italian cities.
METHODOLOGY
The discussion on the methodology we employ is divided into 3 sections focusing on data harvesting, data processing; and visualization and open data. Each of these will be discussed respectively below.
Data Harvesting
Data can be harvested from social networks in a number of different ways, each describing both the qualities and quantities of data that can be obtained, and the constraints which have to be applied to its usage. For example, regulations are provided by the 'terms of service' documents published by data providers. While some individuals use the possibilities for public expression on social networks as if they were in public spaces, the 'terms of service' documents (which are legal contracts) expose limitations and constraints to their usage which go well beyond the ones enforced in the public domain: even if the data and information is produced from social network users as a form of their own expression, their possibility to use it for their own purposes - or even for public good - is somewhat limited, due to the fact that it represents the major source of revenue for the aforementioned service providers.
In our case data was extracted from social networks in one of two areas:
- using the publicly available APIs (Application Programming Interfaces) offered by major social networks;
- purchasing datasets from the large data dealers that have established agreements with major social network operators.
Starting from the latter: it is possible to define time, geographic, textual and other forms of personalized queries to access the hose, that is, the continuous stream of content that is constantly produced on social networks and which satisfies the criteria established through a query itself.
In our research we have chosen to operate with the Gnip provider to obtain a dataset which would be impossible to retrieve in other ways (such as some sets of data from Facebook and LinkedIn). We have decided to use this possibility geographically, accessing all the data which was generated by users across relevant locations (inside the case study cities, in our case).
For the other social networks (Twitter, Instagram, Foursquare) data was captured using the public APIs which are made available by each provider. For each provider we have defined geographical queries which allowed us to capture all relevant data generated in the area of interest. In both cases the results were delivered through persistent or non-persistent HTTP connections, using JSON or XML formats.
After the elimination of possible duplicates, the harvested data we gathered was stored in a noSQL database (MongoDB was used in our case), after being mapped onto a common format. A series of 10 storage spaces were used to store most of the relevant information including the following parameters:
- users: user identifications;
- content: physical structure of the content, including user attribution, time, geographical position, source;
- users relations: allowing to identify the relations among users including direct (friendship, follower), slack (retweet, share...), or strong (reply, re-iterated replies across different topics...);
- content relations: allowing to identify relations between content in the same social network (a retweet, a share...) or across networks (from Twitter to Facebook; from Foursquare to Facebook);
- user metadata: including all the metadata that is generated for a single user in the processing stages;
- content metadata: including all the metadata that is generated for a single content in the processing stages;
- user relations metadata: all metadata for user relations;
- content relations metadata: all metadata for content relations;
- user clusters: identifying communities, clusters and identities (same user across multiple social networks);
- content clusters: identifying clusters, topics, emotions and identities (same content across multiple instances and social networks).
The next sub-section describes how the digital data we went about gathering was processed.
Data processing
Various different processes were applied to the harvested data, including: identity analysis; geo-coding; emotional analysis; topic analysis; network analysis; and clustering. This sub-section further discusses these processes.
The objective of the identity analysis was to identify the same users across different social networks, and different instances of the same content inside or across networks. To do this, very simple pattern matching algorithms were applied on the textual representation of both user profiles and contents (e.g. matching user names, nicknames, content strings and substrings); and in relation to the recurrence of patterns (e.g. a certain user on Twitter tweets exactly the same things which are posted on a certain Facebook profile).
A number of different possibilities exist in trying to attribute a geographical context to User Generated Content (UGC), including users doing the following:
- employing the features offered by social networks for geo-referencing their own messages (either using the GPS on their smartphone, or by providing additional information);
- including in their message information which can lead to finding out a location (from the context) that they are talking from or about;
- none of the two possibilities above, but including an indication of their geographical position (either current or by default) in their profiles;
- none of the above, in which case it is not possible to gather the user's location.
The third case has a low level of reliability. For a number of reasons, users may falsify or misrepresent their current or "home" location. For example, they may commonly choose their favorite city, or a cool city, or a totally fictional location. On the popular social network Foursquare our research lab currently resides in 'Mordor' (taken from Tolkien's "the Lord of the Rings"), which we have placed, using the standard features offered by the system, a few meters away from our lab. For this reason, in our research we tend not to use these kinds of location specifications.
The first case is also very easy to deal with: a geographical location (often paired with extensive sets of meta-data, such as in the case of Facebook and Foursquare) is explicitly provided in the message for the best-case scenario. From the analysis of the results of our experiments, it turns out that the geo-location features offered by social networks are not commonly used. This varies from service to service, from region to region, and across contexts.
From what we have been able to understand, the most location aware social networks are Foursquare and Instagram, with respectively 92% and 30% of the contents which have a location attached to them. Then comes Twitter, with 10-15%, according to time and context. Then Facebook for which. if we exclude the posts related to events (which have a location attached to them), the percentage drops to about 4%, and comes almost completely from messages generated using the mobile applications. These results are based on the messages we have collected over time in our experiments (from our earliest ones in 2010, to the current ones in 2014), and vary significantly across time and context. For example, many more messages with a location are generated on holidays and during vacation times; and in the case of special events, such as the riots and revolts in Cairo, Egypt, during 2013. In this last case, for example, Twitter messages linked to a specified location rises to as much as 18%.
The second case in the list is more complex and interesting. It takes place when users do not use the platforms' features to include their location in the message, but, rather, mention the location which they're talking from or about within the text of the message itself. In this respect, it becomes important to try to determine whether the mention of a geographical location in a message is indicating that the message was produced in that location, or if it was talking about or referring to it. According to the service which one wants to implement, these two possibilities may completely change the relevancy of the message.
We have attempted to formulate a working procedure with which to try and add location information to these kinds of messages. In particular, we implemented the following procedures:
- We built databases of 'named places' for the case
study cities, including landmarks, street names, venues,
restaurants, bars, shopping centers, and more. This
involved drawing upon information from the following
sources:
- publicly available data sets such as the ones available accompanying public cartography sets (for example for Italy we have used the named places provided by ISTAT, Italy's National Statistics Institute);
- the list of named places contained in the OpenStreetMap databases, for example the ones described in the references section;
- the list of named places provided by social networks themselves, which allow using their APIs to discover the locations in users messages, for example on Facebook or Foursquare;
- lists of relevant words and phrases, such as event names or landmarks.
- We used text representations in various forms for named places in a series of phrase templates. The purpose was to understand if the user writing the message was in the place, going to the place, leaving the place, or talking about the place. Templates have currently been generated in 29 different languages, for a total of more than 20000 different templates. For example, the template "*going to [named place]*" would identify the action of going, while "*never been in [named place]*" would identify the action of talking about a place;
- For each template we assigned a degree of confidence. The purpose was to evaluate the level of certainty according to which the sentence could be said to identify the intended information. For example: "I'm going to [named place]" has a relevance of 1 (100%), while the "[named place]" taken by itself has a relevance of .2 (20%) as it might be a false match (e.g. a bar with the same name of a famous landmark);
- A threshold was established, if the sum of relevance degrees for templates matched to sentences was above such threshold the information about content location was kept, otherwise it was discarded. Currently the threshold for this is set at 90% .
By applying these rules we have been able to increase the percentages of geo-located messages quite successfully. For example on Twitter, we garnered an increase from the original 15% to around 27% after using these procedures. This change was judged from a series of sample-based statistics we produced on the messages that had not been directly geo-coded by the user. To our knowledge, the rest of the messages were not dealing with a specific location, or were not intended to deal with locational information.
'Emotional analysis' and 'topic analysis' were performed using natural language processing techniques and technologies.
We approached the possibility of recognizing emotions by identifying in text the co-occurence of words or symbols that have explicit meaning. As suggested by Ortony et al. (1997) we must separate the ways in which we handle words that directly refer to emotional states (e.g. fear, joy) from the ones which only indirectly reference them, based on the context (e.g.: "killer" can refer to an assassin or to a "killer application"). Each of these has differing metrics for evaluation.
For analyzing affective meaning, we have used the classification approach found in the WordNet extension called WordNet Affect. The approach we employed was based on the implementation of a variation of the Latent Semantic Analysis (LSA). LSA yields a vector space model that allows for a homogeneous representation (and hence comparison) of words, word sets, sentences and texts.
According to Berry (1992), each document can be represented in the LSA space by summing up the normalized LSA vectors of all the terms contained in it. Thus a synset in WordNet (and even all the words labeled with a particular emotion) can also be represented in this manner. In the LSA space an emotion can be represented at least in three ways:
- the vector of the specific word denoting the emotion (e.g. "anger).
- the vector representing the synset of the emotion (e.g. {anger, choler, ire}).
- the vector of all the words in the synsets labeled with the emotion.
This procedure is well-documented and used, for example in the manner shown in Strapparava (2008), which we adopted in our technique. We also adapted the technique found in Berry (1992) to handle multiple languages by using the meta-data provided by social networks to understand in which language messages were written (and performing a best-effort analysis on those cases in which the meta-data seemed to be incorrect due to the high number of non-existing words in a certain language), and using a mixture of the widely available WordNet translations (along with those produced during the research for specific cases).
We also tried to address the wide presence of irony, jokes and other forms of literary expression which are difficult to interpret. To do this, we have followed the suggestions described in Bermingham & Smeaton (2010) and in Carvalho et al. (2009), with varying results.
We applied the same technique for the classification of the topics discussed online. Instead of providing words, phrases and sentences intended to describe and characterize emotions, we provided ones that were suitable for the topics of interest (if any), or reversed the technique using statistical and differential analysis to derive the recurrence of words, phrases and sentences that could represent the emergent topics under discussion, after filtering out a blacklist of elements and templates.
These previous stages supported the network and clustering stages. In these procedures all of the relational metadata were used to construct a multi-layered graph model, denoting relationships between users, users and content, content and content. From our research on the two case study cities and related datasets we developed a unique role topology system, defined for user-based relationships, derived from their layout in the ecosystem. These included the following roles:
- influencers: they are able to influence many people; the content they share is not only seen by many other users, but also becomes an object for discussion and for further propagation, across different networks and communities;
- amplifiers: the content which they share is seen by many other users, and shared across multiple networks and communities;
- hubs: they have many bi-directional connections, but they do not act as either influencers or amplifiers;
- experts: they have many incoming connections and are the object of requests for expertise or opinion;
- bridges: they have one or more sets of connections to different, disjointed clusters (communities, groups, topic areas), and can act as bridges between them, passing information back and forth, and creating cross-pollination patterns;
- brokers: they interconnect people and content together; they actively notify other users about content that might interest them, make introductions, ask opinions from multiple users, creating spaces for discussion;
- simple nodes: all of the other instances.
Through this classification we have tried to create a framework dedicated to gaining better understanding about the distribution and flows of information, knowledge and emotions in the city. The purpose is to be able to identify the "pressure points" onto which enact interventions, as hypothesized in 'urban acupuncture theories'.
A k-means clustering algorithm was applied in multiple dimensions to achieve the definition of such "pressure points", grouping content and users according to different strategies.
For example, we have focused on establishing parameters which would allow us to understand the changing boundaries of communities, cultures, emotional approaches to topics and the propagation of information, knowledge and emotions throughout the urban information ecosystem.
In general, we have set up, through conceptual analysis and software production, a set of tools which make the whole configuration process and the processing stages (described above) as accessible and usable as possible, given the time and resources that were available to us. All the software is released as GNU Public License (GPL), and thus can be freely downloaded and used (Iaconesi, 2013). The next subsection discusses the importance of data visualization in our research cases.
Visualization and open data
During this stage we produced a series of visualizations and interactive systems to represent the relational ecosystem of the city, and to create a source of real-time Open Data.
Visualizations were produced to represent the time, space, topic and emotional dimensions. In addition, a graph visualization was created to highlight the relational aspects of the data. Both entertaining, interactive and more analytical versions of the visualizations were produced, to obtain experiences and tools intended for different usage scenarios.
The space/time/topic/emotional visualizations were implemented as geographical maps showing the data through colors, shapes and surfaces (see discussion below). The relational visualizations used a 3D network representation to represent users and relations, color-coded according to roles, topics and emotions. In each visualization, filters were applied to highlight specific topics, emotions and subjects. This also led to the opportunity to implement a "find yourself in the ecosystem" experience, through which users could locate themselves inside the relational ecosystem of their city, and start its exploration from a subjective point of view.
This kind of approach resulted in this being possibly the most effective tool to suggest people's participation. Citizens were able to find themselves in the ecosystem, visualize information about the communities which they took part in, and explore the rest of the ecosystem, finding like-minded people, people who had different opinions, cultures and emotional expressions. Such an approach facilitated the process of attempting to create collaborative patterns by establishing bridges among different communities.
This allowed people to easily conceive Urban Acupuncture processes, for example by selecting a certain topic, locating themselves inside the selected topic, and trying to establish how they could interconnect with other people interacting with it. Examples included "how do we clean a park together"; or "how do we create a more secure environment for our neighborhood".
As for the Open Data source, in the current situation, it remains a basic configuration, that will need to be expanded in the future, By invoking two HTTP addresses (one for users and one for content), one is able to obtain a list, starting from a certain timestamp, of the relational ecosystem.
The next section presents some of the interim results of our research in Rome and Turin.
INTERIM RESULTS
Experiments and working processes are currently being held in Rome, Turin, Berlin, Malmö, Helsinki, London, Kansas City, San Paulo, Hong Kong and Bangalore, with the support and active participation of local City Administrations and organizations. In this section we will provide some of the interim results which we have gathered from two of these experiments.
An early project in Turin and a current one underway in the city of Rome.
Love vs. Turin
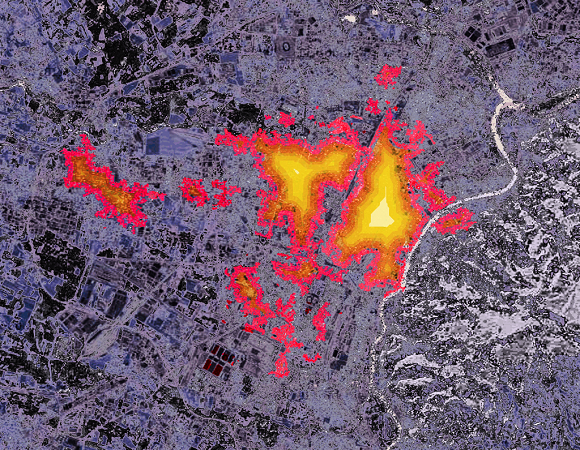
In 2011, on the occasion of the 'Piemonte Share Festival', held at the Natural Science Museum of the Italian Piemonte Region we have launched a first instance of this research path, called Versus (Iaconesi, 2012), in which we observed the digital life of the city of Turin to search where in the city people of different cultures expressed emotions of "love" using social networks.
During the timeframe running from August 1st 2011 to October 1st 2011 we harvested more that 3.5 million unique content elements on Twitter, Facebook, Foursquare and LinkedIn, originally generated from around 12 thousand unique users (as first originators the total number of users was more than 180,000) in 18 languages (of the 29 that we were monitoring).
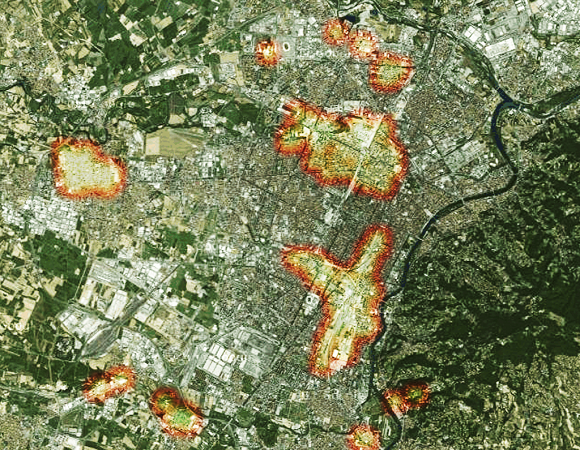
A first mapping visualization of the digital social network revealed a city that was completely different according to the languages that were taken into account. As the images disclose (Figure 1 and 2), even a simple comparison in the places in which the social media messages were generated revealed different ways of living the city, according to which language citizens speak. People familiar with the city of Turin will not fail to recognize the high presence of messages in Arabic language in the city area around the Piazza Republica and Porta Palazzo Market, one of the largest multicultural areas of the city. The analysis performed in Italian showed completely different results. For this particular case, further inspection showed different movement patterns across the city, as well as differences in the expressed motives for being in a certain place. Again, in the Porta Palazzo market we were able to find a single corner of the street which, according to which language was taken into account, was used as a place for business, for worship, for romantic encounters and for a fight, also depending on context and the time of day and week in which one was observing the location.
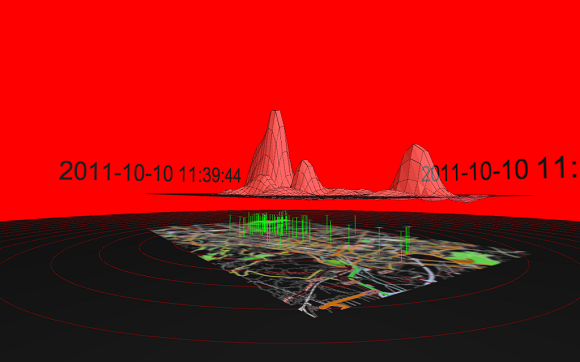
As for the original scope of the work, "love vs. Turin", we produced a visualization which showed the peaks of love, as identified across the different parts of the city (Figure 3). In terms of 'ubiquitous acupuncture', a series of live, collaborative experiments, involving research performed through visualizations, uses of the online tools, field trips across the city, visiting the "emotional landmarks" and discussions with people about their possible motives for these kinds of expression. The latter type of experiment was particularly insightful when combined with the practice of direct user engagement. Users were identified for expressing "love" in different parts of the city with recurring patterns and modalities, and they were directly contacted and engaged with the planned objective of collaboratively designing ways in which more love could be easily expressed in those same favorite locations. Thirty five people were engaged in this way through an organized workshop and a participatory field experiment. The next sub-section contrasts our work in Turin with that of Rome.
EC(m1): The cultural ecosystem of the City of Rome
In August 2013, with the collaboration of the Cultural Council of the First Municipality of the City of Rome, we initiated the EC(m1) project, aiming to create the first 'cultural ecosystem' of the city.
This system was built to capture in real time the public activity of citizens and operators using social networks to express themselves about music, theater, cinema, the arts, publishing, traditions, history and heritage, sports, tourism and media.
Our observations started on August 15th 2013, and are currently on-going. Up to the time of writing more than 3 million content elements have been harvested in 29 languages. Of these languages, 15 have been confirmed as being the most common languages spoken daily across the city.
In our analysis, about seven thousand formal and informal cultural operators have been identified (4186 informal ones, and 3654 formal ones), promoting and communicating their projects and initiatives in the City of Rome (event organizers, associations, artists, education operators and more). About 1.5 millions of user profiles have been identified, including tourists. From these data, a series of initial results have already been identified, including the following:
- Abundance of operators with weak interconnections and
a wide presence of outsiders.
- The more than 7000 operators which have currently been identified are joined by a vast number of smaller operators, artists and various other different profiles (from food bloggers, to writers, to designers and makers) enacting a rich cultural dialogue;
- a few operators are found to be extremely well connected among themselves;
- less than 10% of the actors implement more than 50% of the initiatives which are communicated and which effectively reach their targets on social networks;
- apart from a minimal number of exceptions, operators work alone (about 34%), or with the collaboration of a maximum of 2 other operators (about 25%);
- the vast majority of operators (around 86%) do not perform collaborative and/or synergistic communication with other operators;
- Low interest in discovery: citizens take part in
events with a limited number of operators,
- the majority of the audiences take part in events promoted by only 1 operator (12%), or 2-5 operators (49%);
- results have a large variation according to the cost of the events: in the case of events which are not free the part of the public that accesses events from 1 single operator increases up to 62%;
- Evidence of niches which act as inter-connectors
amongst different communities.
- perfectly distinguishable subjects act as bridges among communities, and establish push-pull dynamics among the different communities;
- these user profiles are particularly interesting in their ability to traverse audiences and to create thematic mobility;
- Limited, but present, user mobility.
- the mobility to reach the events has turned out to be quite limited;
- about 20% of the identified users go to 3-5 different neighborhoods to attend events, and only 3% openly avoid moving from their own neighborhood;
- an interesting phenomenon concerns the "univocal destination", with about 30% of the identified citizens expressing the will to attend events which take place in a single neighborhood (as it happens for example for the Pigneto, San Lorenzo or Monti districts); in 4% of these cases, the chosen neighborhood is the one they live in.
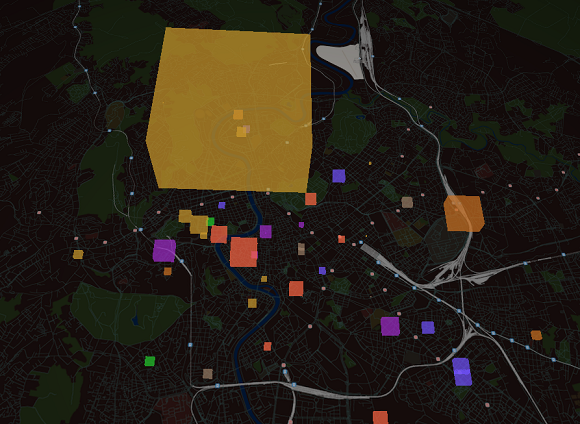
Concurrent with our observations, the TechCrunch Italy event was held in Rome, at the MAXXI Museum of Contemporary Arts, on 26-27 September 2013. This allowed us to take a snapshot of the cultural ecosystem before, during, and after the event (i.e. 3 days, 5 days and 15 days after the event). Figure 4 uses the geographical visualization to show the social media eco-system in Rome concurrent with the TechCrunch Italy. The objective of this type of observation was to gain better visual understandings about the impacts that such a large event would bring into the city's relational eco-system.
During the TechCrunch event a large number of social interactions took place (more than 80 thousand content elements were generated for that event alone), establishing instantaneous relationships. The scenario radically changed in the days following the event. Of the almost 15 thousand new relations that were formed during the event, almost none showed any sign of persistence at the 15 days mark. To describe this using a metaphor, the event was like a "clap of hands", creating excitement during its execution, but leaving almost no trace after its end. This trend was also confirmed at the level of content production. For example, during the 3 days following the event there was a high number of commentaries which focused around the event and on the topics which were discussed-with cross-references among users that confirmed the newly created relations. But as early as the 15 days mark, almost no trace was left of the event in the context of discussions: only about 94 of the newly formed relationships still showed some mutual interaction, declining even more steeply in the following days. Basically everyone that attended the TechCrunch event in Rome was part of a series of communities which remained substantially unchanged as quickly as 15 days after the event.
This observation opened up a set of fundamental questions for the administrations, also based on the previous experiences and results. For instance, how can an administration, an event organizer, or a group of citizens create an eco-systemic event? This would be an event that is capable of bringing change and transformation to the wider society, effectively creating new relations and fostering a higher level and persistence of citizen participation and engagement. Another question is: how can such a process be measured, researched through simulations and provoked through direct interventions so as to leverage the human topography of the ecosystem, using the novel definition of 'urban acupuncture' that we are giving to this process? Or, how can guidelines and best practices be created to facilitate this opportunity? Our ongoing research has identified the importance of dealing with the complexity of human relations and with the desire to bring change and new enabling models in 'urban eco-systems'. To further assess these questions and issues, we have started, with the support of the Rome city administration, a series of open meetings focused on the 'cultural eco-system'.
Each 'cultural eco-system' meeting starts with a presentation whose objective is to highlight the possibilities (to include into the discourse the people and organizations which might have not attended previous meetings), and to introduce the state of the art of the eco-system, bringing into light the current state of the experiment, our findings, the feedback we received and the changes which we adopted to take them into account. We then proceed with parallel workshops-some of which are thematic and vertical (e.g. arts, music, funding opportunities, etc.), and some of which are horizontal-to deal more closely with the eco-system. The former meetings are intended to form focus groups in which people and organizations are able to promote their visions and proposals on each verticalization. The latter meetings contribute to the creation of what we are explicitly calling the "Eco-systemic Office", a place (physical or virtual) to which citizens and organizations can refer to position themselves in the Eco-system, learn how navigate, understand and use it to find collaborations, resources, participation and the possibility to confront with common issues. Objectives of this office include re-establishing and enhancing the flows of relations, information, knowledge and participation across subjects and communities, the public body of the urban ecosystem.
The final section of the paper discusses some of the conclusions we have devised from our interim research in Turin and Rome.
CONCLUSIONS
The current outcomes of this series of projects are many and touching-upon a varied set of fundamental issues. We will now try to answer our initial research questions, and discuss six synoptic conclusions that we have derived from our interim research in Rome and Turin below.
As we have seen from the large number, variety and ubiquity of the content that we have collected, it is possible to approximate the relational eco-system in a city by using people's expressions on social networks, and to observe, analyze and measure this, with a few precautions and context-dependent considerations. Our main concern, in this sense, is with the presence of multiple types of divides: cultural, technological, educational. Social networks host only part of the population: young people are more represented; people from different neighborhoods, backgrounds, cultures, jobs etc. use them in different ways; people use them for various reasons and contexts. The reasons are many, and their description is beyond the scope of this note. It is important, here, to highlight how it must be clear the way in which these analyses take into account a part of the city, not its entirety. This, in our case, has also transformed into an opportunity, as we have been able to collaborate with cities, using datasets such as census and other statistics and demographics in their possession, to understand the consistency and variety of what is not represented in the relational ecosystem expressed on social networks.
One example among many concerns the wide variety of Asian communities, from Chinese, to Bengalese and others. With the administration, we have observed the social networking messages in their languages, and used them to describe their 'part' of the relational eco-system of the city. Then we compared this with the demographics and statistics (immigration, census) in the administration's possession, to understand what was missing (22% of the immigrant population from Asian countries did not seem to use social networks), and their interconnections with the rest of the eco-system (for example, a remarkable finding was confirmed on the role of 2nd generation immigrant children and young adults, who were revealed to be the most influential bridges and brokers, as defined in the previous sections, between the different ecosystems). In the end, this kind of issue is both a problem and an opportunity.
Given the answer to the first question, it has proven to be fairly simple to give an answer to the second: having taken notice of the limitations (and opportunities) of this approach, it is in practice straightforward to capture and model the ways in which information, knowledge and emotions (for example on specific issues, topics or news) flow among the communities: within them and across them. The data is accessible and can be aggregated, compared, weighted, measured, modeled in networks and graphs, simulated and, in general, used to gain better understandings of the communication in cities, within and across communities, and in its continuous transformation.
The third question has been, to all effect, answered through practice: Open Data and accessible information visualizations have been made available and usable to administrations, citizens, organizations and associations, and has been used, for example in Rome, by hundreds of people to shape the way in which they collaborate with their administration, their fellow citizens, their audiences, communities, thematic groups and more.
A few considerations on the modalities according to which this data and visualizations has been made available can be found below, in the six synoptic conclusions which will form the end of this note.
First of all is the shifting definition of public and private spaces in the 'information era', and the impacts of this transformation on our perception, on the possibility to effectively use (perceived) public spaces, and on fundamental rights. As stated in the previous sections, citizens perceive the digital spaces of social networks as potentially public spaces, in which to express their emotions, visions, desires, and often establishing profound, engaging, wide conversations about the (near) future of our cities and lives as citizens. It is for this reason that the need to define more advanced regulations for the fair, open, transparent usage of these spaces (and of the public information which they contain) should be among the priorities of governments and administrations. This also involves taking care of the necessary educational and regulatory initiatives to foster a growing degree of literacy which is needed to help and support citizens to protect their basic rights to privacy, and their freedom of expression and information.
Second, a series of technical and technological issues have also been identified for further investigation. This includes the need to achieve better, more meaningful strategies for content classification. While the current setup allows for the potential to achieve an acceptable level of adaptability (to the emerging trends, for example) and configurability, more tools and techniques are still needed to allow users of the eco-systems to easily configure their own classifications of interest.
Third, we have also identified digital social network content clustering strategies to be still somewhat too simple for the objectives we set forth. While they are appropriate for content classification - by theme and emotional expression -, communities and other forms of user clusters - by language, topic, geographical area, timeframe, and any recombination of these parameters, they still lack the flexibility that would enable users of the eco-system to autonomously and accessibly build their own clustering strategies.
Fourth, one item that needs immediate attention is the Open Data component of the system. A more complete set of functionalities must be quickly implemented to allow other researchers and practitioners to use them for their own research and other purposes, so that the rate of adoption and engagement would be able to rise exponentially.
Fifth, new tools, visualizations and report templates will be needed to support further design and development, in order to allow non-technical users to benefit from an augmented degree of accessibility and usability, especially in the areas of comparative analysis (such as in the TechCrunch Italy scenario), or in the execution of simulations.
Sixth, all of the above and more issues will form the next steps of the research. The positive results that were achieved in studying Rome's events show the opportunity to further develop the renewed definition of 'urban acupuncture' which we described at the outset of this research note. From the perspective of finding localized "pressure points" onto which to act to provoke wider results to appear, we have found the relational-oriented visualizations and tools to be truly effective. By using network views to understand the flows of information and emotion across communities and territories, researchers and citizens have been able to autonomously form their own strategies for urban intervention. Simple questions such as "how can we organize citizens to clean this park?" were asked to explore new research possibilities for our work.
Our analysis started from observing communities and their relational topographies to understand how single users that expressed interest in urban decor, for example, could be engaged to obtain high visibility and emotional response. Relevant community bridges and influencers could be easily recognized and directly contacted through social networks to form small focus groups that had shown the potential to engage large number of citizens. Basic communication strategies were collaboratively designed and, then, the communication was started, bearing substantial levels of user engagement, which eventually led to activation beyond the digital domain (as the more than 500 participants to the second event have shown).
More complex questions have also been explored in our research process. For example, the Teatro Valle - an occupied theater in Rome - is currently working to use the 'human ecosystem' to enact multiple 'urban acupuncture' processes intended to form the venue's next event season. By using the relational visualizations small, but well interconnected, communities of theater and performing arts lovers have been engaged to organize the collaborative processes which will lead to the definition of next season's events. Again: small interventions identified by gaining better understandings of information, communication and emotional flows in the city, lead to larger, participatory results.
All of these considerations represent, from our point of view, a definite incentive towards expanding and enhancing this research path.