|
|
|
Free Neuropathology 4:6 (2023) |
|
Original Paper |
|
Survey of Neuroanatomic Sampling and Staining Procedures in Alzheimer Disease Research Center Brain Banks |
|
Juan C. Vizcarra1, Andrew F. Teich2, Brittany N. Dugger3, David A. Gutman4, and the Alzheimer’s Disease Research Center Digital Pathology Working Group5 |
|
|
Corresponding authors: |
|
Additional resources and electronic supplementary material: |
|
Submitted: 25 February 2023 |
|
Keywords: Neuropathology, ADRCs, Brain Banks, Tissue Repository, Biobank |
|
Abstract The collection of post-mortem brain tissue has been a core function of the Alzheimer Disease Research Center’s (ADRCs) network located within the United States since its inception. Individual brain banks and centers follow detailed protocols to record, store, and manage complex datasets that include clinical data, demographics, and when post-mortem tissue is available, a detailed neuropathological assessment. Since each institution often has specific research foci, there can be variability in tissue collection and processing workflows. While published guidelines exist for select diseases, such as those put forth by the National Institute on Aging and Alzheimer Association (NIA-AA), it is of importance to denote the current practices across institutions. To this end a survey was developed and sent to United States based brain bank leaders, collecting data on brain region sampling, including anatomic landmarks used, staining (including antibodies used), as well as whole-slide-image scanning hardware. We distributed this survey to 40 brain banks and obtained a response rate of 95% (38 / 40). Most brain banks followed guidelines defined by the NIA-AA, having H&E staining in all recommended regions and targeted region-based amyloid beta, tau, and alpha-synuclein immunohistochemical staining. However, sampling consistency varied related to key anatomic landmarks/locations in select regions, such as the striatum, periventricular white matter, and parietal cortex. This study highlights the diversity and similarities amongst brain banks and discusses considerations when amalgamating data/samples across multiple centers. This survey aids in establishing benchmarks to enhance dialogues on divergent workflows in a feasible way. |
|
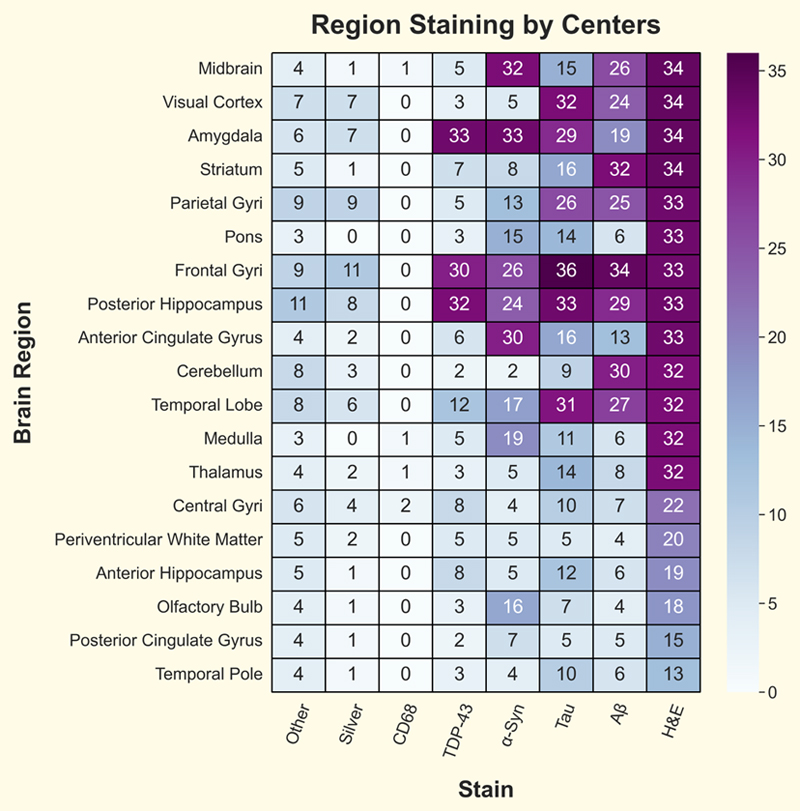
Introduction Brain banks are a fundamental resource to facilitate scientific research to better understand the complex biology of the human brain. Human tissues are a critical component in understanding a wide range of disorders that affect human health, including Alzheimer Disease, Parkinson’s Disease, and Chronic Traumatic Encephalopathy (CTE), as well as understanding the effects of normal aging.1,2 Within the Alzheimer disease and related disorders (ADRD) community, the National Institute of Health (NIH) has supported many brain-banking efforts, including Alzheimer Disease Research Centers (ADRCs).3–5 Many brain banks have been collecting tissue for decades and have developed specific protocols on sectioning, staining, and preserving samples typically driven by a specific research area or focus. For example, in a research repository focused on Amyotrophic Lateral Sclerosis (ALS), the spinal cord may be routinely included in the sampling schematic, while this may not be routine in one focused on Alzheimer disease (AD).6,7 A key mandate of ADRCs is to aggregate and share the data from research participants, including clinical data, neuropsychological assessments, patient demographics, and when available, neuropathology (NP) assessments as well as tissue samples.8 The NP data provides the ground truth diagnosis, based on a review of a specific set of stained brain region slides, using standardized semi-quantitative rating scales developed over the past several decades. For AD these include the Consortium to Establish a Registry for Alzheimer's Disease (CERAD) score, Braak neurofibrillary tangle stage, Thal amyloid phase, and others.9–13 Guidelines regarding ADRD diagnosis have been previously published and updated as research progresses.14–17 Following initial autopsies, a typical protocol will involve the dissection of brain tissue and placement into small cassettes (∼30x20x5 mm, but this can vary) to be paraffinized, sectioned, and then stained either histochemically or immunohistochemically for select markers. However, numerous variations exist, such as large format free floating sections that may be 40-80 µm thick. The specific staining protocols, sample preparations including slice thickness, antibodies or other reagents used for processing, and the anatomic regions surveyed are just a few parameters that can vary from center to center, bank to bank, or even case to case.18,14 Furthermore, with the advent and more widespread availability of whole slide image (WSI) technology, it is now feasible to digitize neuropathology datasets at high resolution. These datasets are more easily shared than physical slides and there is a need to understand how best to harmonize workflows. Data harmonization efforts will require the creation of a standardized data dictionary in order to facilitate data sharing in the spirit of the FAIR guidelines (findability, accessibility, interoperability, and reusability).19 Given potential variability in staining, sectioning, blocking parameters, and naming conventions, we created, distributed, and evaluated a survey that assessed the current landscape across research institutes to identify common practices in ADRD brain banks (Supplementary Document). Materials and methods The authors, along with input from the ADRC digital pathology working group, produced and disseminated a survey to brain bank leaders in the spring / summer of 2022, see Supplementary Table S1 for list of submitted surveys and Supplementary Material 2 for names of members of the ADRC group and their affiliations. Survey questions focused on obtaining data for the immunohistochemistry (IHC) procedures used, sampling of brain hemispheres, WSI scanners available, antibody usage, and brain region staining and sampling procedures. For anatomic areas, select landmarks were surveyed to identify heterogeneity between sampling procedures among ADRCs (for the complete survey, see Supplementary Material 1). The survey questions were developed using the jotform.com platform (Jotform Inc, San Francisco, CA). A URL link to the survey was emailed to 39 past and current ADRC Neuropathology Core leaders and one non-ADRC brain bank leader. Participation was voluntary. Responses contained no personally identifiable information and results were anonymized. Survey responses were compiled in the fall of 2022. Survey entries were exported into an excel spreadsheet file for analysis. All analyses were done using open-source Python libraries through custom code found in the GitHub repository, including the resulting excel file: https://github.com/Gutman-Lab/ADRC-np-survey-2023. Categorical data were presented as frequencies and percentages. Most questions in the survey had multi-select answers that were not mutually exclusive (multiple answers possible for each question) or were free text-answers. Questions regarding the counter staining-process for IHC were yes/no questions. Results The survey requests were sent out to 39 past and present ADRC NP core leaders, plus one additional brain bank leader not affiliated with an ADRC. The survey obtained a response rate of 95% (38/40). Most surveys were completed by the center’s NP leader or co-leader (33/38). The survey collected center information regarding the IHC procedure used, sampling of brain hemispheres, WSI scanners available, antibody usage, and brain region staining and sampling procedures. IHC processing and counterstaining were similar across centers, with most respondents stating they use hematoxylin counterstain with diaminobenzidine (DAB) as the chromogen (brown) without enhancement (30/38). Other responses included using neutral red with DAB as chromogen with nickel enhancement (3/38) and only DAB with nickel enhancement (1/38). Four participants specified only using hematoxylin counterstain but neither DAB as chromogen with or without nickel enhancement, presumably meaning no implementation of IHC, an alternative approach, or a misinterpretation of the survey question. Four of the 38 respondents did not specify the brain region they sampled. Of the remaining 34, most denoted sampling the brain's left hemisphere (32/34), 13 sampled both hemispheres, and two sampled only the right hemisphere. Answers to this question were not mutually exclusive and included sampling the brain's left, right, or both hemispheres. Average section thickness varied considerably across centers, with the most common section size being 5 µm (12/38), followed by 8 µm (7/38), 4 µm (6/38), and 6 µm (5/38). Some centers (3/38) sample within a range of sizes, i.e., 5 - 7 µm. The thinnest section size sampled was 2 µm and the thickest was 80 µm. Most centers have a single expert or neuropathologist do all the blocking (23/37), with the remaining utilizing a group of individuals that routinely perform the blocking (14/37); responses were free text answers. The type of WSI scanner available was also surveyed for all institutions. The most common type of scanner denoted was the Aperio / Leica (25/38). Other scanners included Olympus, Zeiss, Huron, Philips, Hamamatsu NanoZoomer, Keyence, and 3D Histotech. Most respondents had access to only a single type of scanner (29/38), while four had two scanner types available. Five respondents stated they had no access to a WSI scanner. These data are similar to previously published results.20 With respect to IHC, most respondents utilize the AT8 antibody when staining for tau (23/37, antibody information missing for one center) or the PHF1 antibody (14/37). Some respondents stated using more than one antibody variant for tau staining, with two centers using three, and two centers using two antibodies. Other tau antibodies used include CP13 and RD3/RD4. Amyloid beta (aβ) staining showed more antibodies used by respondents, with 12 different antibodies in current use. 4G8 (13/37) and the 6E10 (9/37) antibodies are the most common. Only one respondent stated using multiple antibodies for aβ staining (10D5, 4G8, and 6E10). For alpha-synuclein (ɑSyn) and TDP-43, respondents specified phospho-specific or non-phospho-specific antibody use. Most respondents use a phospho-specific antibody for TDP-43 (29/37). For ɑSyn, about half of the respondents use each type of antibody (phospho-specific: 18, non-phospho specific: 17), and two respondents specified alternative approaches (LB509 EMD Millipore & Millipore #AB5038P). Additionally, one respondent used both phospho and non-phospho-specific antibodies. Nineteen brain regions were surveyed to assess the stains applied, anatomical landmarks included, and sampling methodology. The survey identified a set of highly consistent combinations of stains and regions across centers/banks. For example, the H&E stain was denoted to be used by all respondents. However, there was a set of six regions (central gyri, periventricular white matter, anterior hippocampus, olfactory bulb, posterior cingulate gyrus, and temporal pole) that were not universally stained with H&E. Other stains, like ɑSyn, were more targeted, with frequent use in the midbrain, amygdala, and anterior cingulate gyrus (n≥30) and moderate use for the frontal gyri, posterior hippocampus, temporal lobe, medulla, olfactory bulb, parietal gyri, and the pons (n≥13) (Figure 1).
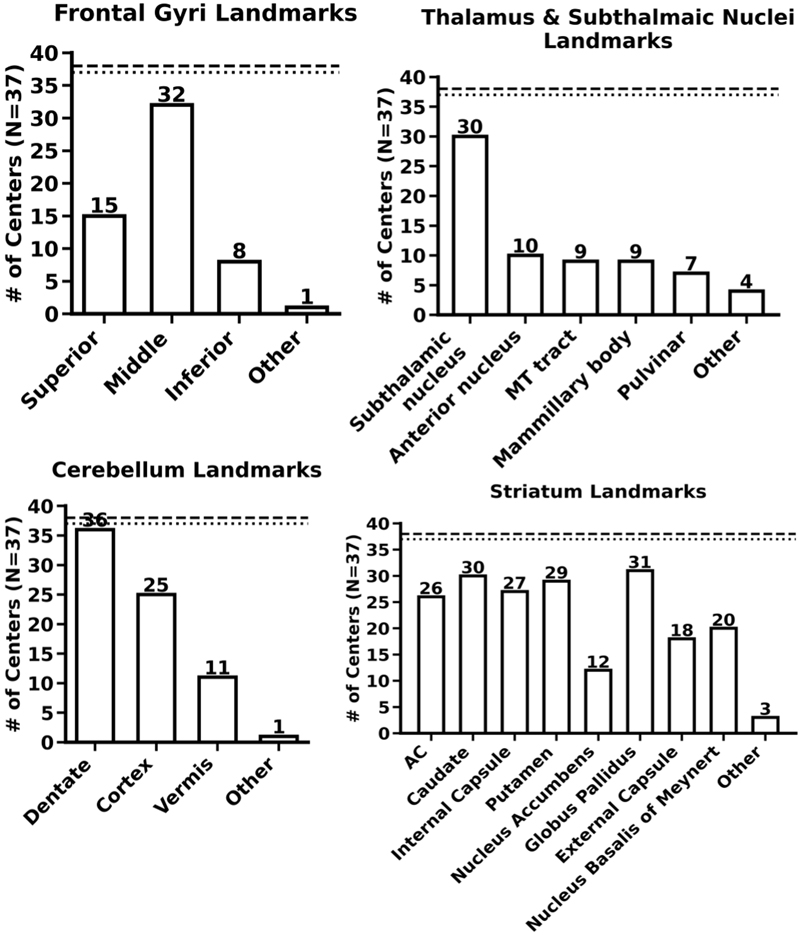
Figure 1. Heatmap showing the number of centers using specific stains for different sampled brain regions. The vertical axis displays the 19 brain regions surveyed and the horizontal axis displays the major stains surveyed. The number in the heatmap signifies the number of centers that use the stain for that region. ɑ-Syn: alpha-synuclein, aβ: amyloid-beta, H&E: hematoxylin & eosin. As anatomic regions can be vast and vary in mediolateral, superior/inferior, or rostrocaudal aspects, we also surveyed specific anatomic landmarks within select sampled brain regions. For all landmark questions, the responses were not mutually exclusive. The inclusion of specific anatomic landmarks varied considerably across respondents. For example, for the frontal gyri region, most respondents consistently sample the middle frontal gyrus (32/37 centers that collect the region), but only a few respondents stated that they also sample the inferior frontal gyrus (8/37). For the cerebellum, nearly all respondents stated they sampled the dentate nucleus (36/37), but less than one-third of respondents sampled the vermis (11/37). Similarly, for the thalamus and subthalamic nuclei region, not all respondents included the subthalamic nuclei (30/37). Other landmarks in this region were sampled by a subset of brain banks (Figure 2 shows responses for select regions, additional results are included in Supplementary Figure S1).
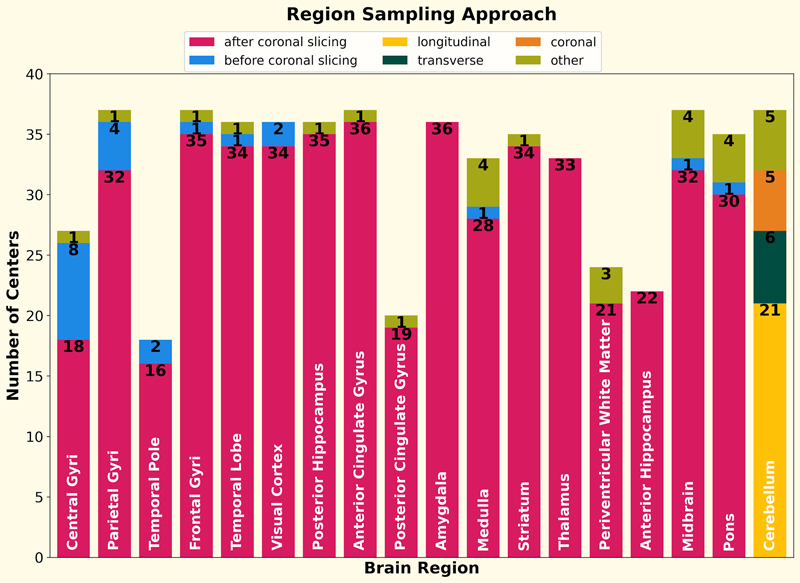
Figure 2. Bar plots showing the anatomical landmarks sampled in four brain regions. The dashed line represents the total number of submitted surveys (38). The dotted line represents the number of respondents that answered the question (varies per region). The N value in the vertical label corresponds to the value of the dotted line. All answers were non-mutually exclusive. MT: mammilla-thalamic, AC: anterior commissure, additional region landmark responses can be found in Supplementary Figure S1. For most regions, the majority of respondents stated sampling after coronal slicing (>80%) as opposed to before. For the cerebellum region, the survey asked if the sampling was done with longitudinal, transverse, or coronal slicing. Most centers use longitudinal sectioning when sampling the cerebellum (21/38), with a subset using transverse (n=6) or coronal (n=5) sectioning, or some other approach (n=5) (Figure 3). Additional questions not reported are those regarding the antibody vendor, the select set of regions and the number of gyri and sulci targeted during sampling (survey answers can be found at https://github.com/Gutman-Lab/ADRC-np-survey-2023). These questions were free text answers, and while we attempted to glean data from these, there was too high a level of variability to draw conclusions.
Figure 3. For 18 out of the 19 regions (olfactory bulb excluded), the number of centers that sample the region via different sectioning approaches is shown using stacked bar plots. For 17 regions, the survey asked if the centers sampled the region after or before coronal slicing. For the cerebellum region, the options were: longitudinal, transversal, and coronal slicing. The numbers show the value of the stacked bar. The label in each bar is the brain region. Discussion Overall, we received survey responses from 95% of sites, providing detailed information regarding neuropathology (NP) protocols in select brain banks within the United States. Across respondents, the most consistently sampled regions include the frontal gyri, visual cortex, midbrain, posterior hippocampus, and striatum (37/38 centers). The least sampled regions include the posterior cingulate gyrus and the temporal pole (18/38). Sampled regions were denoted to be stained with H&E most often, concerning IHC, ɑSyn staining was most frequently conducted on the midbrain & amygdala (>32 centers), and aβ staining was most frequently used in striatum, frontal gyri, cerebellum, and posterior hippocampus (>29 centers). There was variability for tissue thickness, and the specific antibodies/epitopes for tau, ɑSyn, and aβ. The use of specific landmarks to aid in localizing sample regions showed a much higher degree of heterogeneity (Figure 2). Brain regions can be relatively large, and assigning generic terms or Talairach/MNI space or Brodmann area may not be sufficient for optimal consistency in sampling.21,22 For denoting the presence/absence of a particular neuropathologic feature, a level of precise anatomic location within a nucleus may or may not be necessary, especially when assessing overall diagnoses. However, depending on what nuclear subregions are examined, the distribution of aggregate proteins can vary, for example in the amygdala, and these may alter specific correlations.23–25 There is also variability in the performance of staining procedures, and how effectively they may reveal pathologies, as some have reported for ɑSyn IHC.26 Additional studies, including those from the BrainNet Europe Consortium and from persons within the ADRC network, have aided in understanding intra-rater reliability, accuracy to clinical diagnoses, and validation of methods in multi-institutional cohorts.10–13, 27–30 Depending on the specific scientific question, understanding these additional details may be important.14,15 Given the recent advancements in digital pathology, to examining other communities that have converted to a digital format, such as the radiology community, can be advantageous. Within the radiology imaging community, standardization of imaging protocols has been achieved across centers, driven in part by the Alzheimer’s Disease Neuroimaging Initiative (ADNI), now starting its fourth iteration.31,32 Despite significant differences in MRI scanners across individual institutions, these efforts have facilitated the development of comparable imaging acquisition protocols across centers. The inherent digital nature of MRI datasets has facilitated not only the sharing of the original imaging sequences but also allows the sharing of standardized quantitative measures of brain structure and pathology. For example, MRI volumes are often run through a FreeSurfer pipeline that produces volumetric information on individual brain structures, cortical thickness, and white matter/gray matter volume, among other detailed statistics.33–36 While data sharing is also a key focus of the ADRC network, sharing the physical autopsy slide sets between research centers may often be impractical. There is a great expense in properly packing and shipping large sets of glass slides between centers, although individual sections or blocks can reasonably be shared at a limited scale. The increased availability of whole slide imaging (WSI) platforms is enhancing the ability to share high-resolution digital pathology images.37,38 These, in turn, can be utilized alongside machine learning/artificial intelligence (ML/AL) workflows to tackle questions that are otherwise difficult to solve by conventional or traditional approaches. For example, early work in this domain has shown that computational workflows can identify and quantify neuropathological hallmarks of the disease, such as Aβ plaques, in a scalable manner.39–43 However, before similar studies can be replicated at scale across a large, diverse collection of images, it is imperative to begin developing a standardized data model to capture pre-analytic variables, as these have been denoted to alter machine learning algorithm outputs.42,44 ML models are notorious for making mistakes in unpredictable ways when being subject to novel images (i.e., different from images used during model training).45–48 Thus, it is to be expected that models trained on images from 5 µm sections would not have similar results when assessing images from 80 µm sections. Similarly, the different staining or sampling approaches between ADRCs might produce images that vary slightly or significantly when viewed through an ML workflow. Understanding the data is equally important as developing the computational approach, and the results of this survey will help in understanding the depth of heterogeneity in the ADRC’s collective database. Conflicts of interest Dr. Gutman has done consulting work with Histowiz Inc LLC. Acknowledgements We immensely thank the ADRC digital pathology working group, Dr. Jonathan D. Glass, Dr. Marla Gearing, Dr. Katherine L. Lucot, and Kevin Nzenkue for their helpful suggestions and feedback on this project. Funding This work was supported in part by grants from the National Institute on Aging (NIA) of the National Institutes of Health (NIH) under Award Numbers P30-AG066511-03S2, NIH U01 AG061357-04S1, P30AG072972, R01AG052132, R01AG056519, R01AG062517 and P30AG066462. References 1. Carlos, A. F. et al. From brain collections to modern brain banks: A historical perspective. Alzheimers. Dement. 5, 52–60 (2019). 2. Beach, T. G. Alzheimer’s disease and the ‘Valley Of Death’: not enough guidance from human brain tissue? J. Alzheimers. Dis. 33 Suppl 1, S219–33 (2013). 3. Yong, W. H., Dry, S. M. & Shabihkhani, M. A practical approach to clinical and research biobanking. Methods Mol. Biol. 1180, 137–162 (2014). 4. Alzheimer’s Disease Research Centers. National Institute on Aging. https://www.nia.nih.gov/health/alzheimers-disease-research-centers. 5. Beekly, D. L. et al. The National Alzheimer’s Coordinating Center (NACC) Database: an Alzheimer disease database. Alzheimer Dis. Assoc. Disord. 18, 270–277 (2004). 6. Pantoni, L. et al. Postmortem examination of vascular lesions in cognitive impairment: a survey among neuropathological services. Stroke 37, 1005–1009 (2006). 7. Alafuzoff, I. et al. The need to unify neuropathological assessments of vascular alterations in the ageing brain: multicentre survey by the BrainNet Europe consortium. Exp. Gerontol. 47, 825–833 (2012). 8. RFA-AG-24-001: Alzheimer’s Disease Research Centers (P30 Clinical Trial Not Allowed). https://grants.nih.gov/grants/guide/rfa-files/RFA-AG-24-001.html. 9. Mirra, S. S. et al. The Consortium to Establish a Registry for Alzheimer’s Disease (CERAD). Part II. Standardization of the neuropathologic assessment of Alzheimer's disease. Neurology 41, 479–486 (1991). 10. Braak, H. & Braak, E. Neuropathological stageing of Alzheimer-related changes. Acta Neuropathol. 82, 239–259 (1991). 11. Thal, D. R., Rüb, U., Orantes, M. & Braak, H. Phases of Aβ-deposition in the human brain and its relevance for the development of AD. Neurology (2002). 12. Attems, J. et al. Neuropathological consensus criteria for the evaluation of Lewy pathology in post-mortem brains: a multi-centre study. Acta Neuropathol. 141, 159–172 (2021). 13. Newell, K. L., Hyman, B. T., Growdon, J. H. & Hedley-Whyte, E. T. Application of the National Institute on Aging (NIA)-Reagan Institute criteria for the neuropathological diagnosis of Alzheimer disease. J. Neuropathol. Exp. Neurol. 58, 1147–1155 (1999). 14. Montine, T. J. et al. National Institute on Aging-Alzheimer’s Association guidelines for the neuropathologic assessment of Alzheimer's disease: a practical approach. Acta Neuropathol. 123, 1–11 (2012). 15. Hyman, B. T. et al. National Institute on Aging-Alzheimer’s Association guidelines for the neuropathologic assessment of Alzheimer's disease. Alzheimers. Dement. 8, 1–13 (2012). 16. Lucot, K. L. et al. Assessment of Current Practices Across Alzheimer’s Disease Research Centers Biorepositories. Biopreserv. Biobank. (2022) doi:10.1089/bio.2022.0022. 17. Shakir, M. N. & Dugger, B. N. Advances in Deep Neuropathological Phenotyping of Alzheimer Disease: Past, Present, and Future. J. Neuropathol. Exp. Neurol. 81, 2–15 (2022). 18. King, A., Bodi, I. & Troakes, C. The Neuropathological Diagnosis of Alzheimer’s Disease-The Challenges of Pathological Mimics and Concomitant Pathology. Brain Sci 10, (2020). 19. Wilkinson, M. D. et al. The FAIR Guiding Principles for scientific data management and stewardship. Sci Data 3, 160018 (2016). 20. Scalco, R. et al. The status of digital pathology and associated infrastructure within Alzheimer’s Disease Centers. J. Neuropathol. Exp. Neurol. (2023) doi:10.1093/jnen/nlac127. 21. Dervin, J. Co-Planar Stereotaxic Atlas of the Human Brain 3-Dimensional Proportional System: An Approach to Cerebral Imaging 1988J. Talairich and P. Tournoux Mark Rayport Georg Thieme Verlag. Stuttgart, New York 3 13 711 701 1 Price DM 268. pp. 122. Illustrations 130. The Journal of Laryngology & Otology 104, 72–72 (1990). 22. Evans, A. C., Janke, A. L., Collins, D. L. & Baillet, S. Brain templates and atlases. Neuroimage 62, 911–922 (2012). 23. Nelson, P. T. et al. The Amygdala as a Locus of Pathologic Misfolding in Neurodegenerative Diseases. J. Neuropathol. Exp. Neurol. 77, 2–20 (2018). 24. Braak, H. et al. Amygdala pathology in Parkinson’s disease. Acta Neuropathol. 88, 493–500 (1994). 25. Cykowski, M. D. et al. Patterns of amygdala region pathology in LATE-NC: subtypes that differ with regard to TDP-43 histopathology, genetic risk factors, and comorbid pathologies. Acta Neuropathol. 143, 531–545 (2022). 26. Beach, T. G. et al. Evaluation of alpha-synuclein immunohistochemical methods used by invited experts. Acta Neuropathol. 116, 277–288 (2008). 27. Mirra, S. S. The CERAD Neuropathology Protocol and Consensus Recommendations for the Postmortem Diagnosis of Alzheimer’s Disease: A Commentary. Neurobiol. Aging 18, S91–S94 (1997). 28. Del Tredici, K. & Braak, H. To stage, or not to stage. Curr. Opin. Neurobiol. 61, 10–22 (2020). 29. Beach, T. G., Monsell, S. E., Phillips, L. E. & Kukull, W. Accuracy of the Clinical Diagnosis of Alzheimer Disease at National Institute on Aging Alzheimer Disease Centers, 2005–2010. J. Neuropathol. Exp. Neurol. 71, 266–273 (2012). 30. Montine, T. J. et al. Multisite assessment of NIA-AA guidelines for the neuropathologic evaluation of Alzheimer’s disease. Alzheimers. Dement. 12, 164–169 (2016). 31. Weiner, M. W. et al. Impact of the Alzheimer’s Disease Neuroimaging Initiative, 2004 to 2014. Alzheimers. Dement. 11, 865–884 (2015). 32. Weber, C. J. et al. The Worldwide Alzheimer’s Disease Neuroimaging Initiative: ADNI-3 updates and global perspectives. Alzheimers. Dement. 7, e12226 (2021). 33. Saygin, Z. M. et al. High-resolution magnetic resonance imaging reveals nuclei of the human amygdala: manual segmentation to automatic atlas. Neuroimage 155, 370–382 (2017). 34. Hedges, E. P. et al. Reliability of structural MRI measurements: The effects of scan session, head tilt, inter-scan interval, acquisition sequence, FreeSurfer version and processing stream. Neuroimage 246, 118751 (2022). 35. Mulder, E. R. et al. Hippocampal volume change measurement: quantitative assessment of the reproducibility of expert manual outlining and the automated methods FreeSurfer and FIRST. Neuroimage 92, 169–181 (2014). 36. Fischl, B. FreeSurfer. Neuroimage 62, 774–781 (2012). 37. Kumar, N., Gupta, R. & Gupta, S. Whole Slide Imaging (WSI) in Pathology: Current Perspectives and Future Directions. J. Digit. Imaging 33, 1034–1040 (2020). 38. Niazi, M. K. K., Parwani, A. V. & Gurcan, M. N. Digital pathology and artificial intelligence. Lancet Oncol. 20, e253–e261 (2019). 39. Wong, D. R. et al. Deep learning from multiple experts improves identification of amyloid neuropathologies. bioRxiv 2021.03.12.435050 (2021) doi:10.1101/2021.03.12.435050. 40. Vizcarra, J. C. et al. Validation of machine learning models to detect amyloid pathologies across institutions. Acta Neuropathol Commun 8, 59 (2020). 41. Tang, Z. et al. Interpretable classification of Alzheimer’s disease pathologies with a convolutional neural network pipeline. Nat. Commun. 10, 2173 (2019). 42. Oliveira, L. C. et al. Preanalytic variable effects on segmentation and quantification machine learning algorithms for amyloid-β analyses on digitized human brain slides. J. Neuropathol. Exp. Neurol. (2023) doi:10.1093/jnen/nlac132. 43. Signaevsky, M. et al. Artificial intelligence in neuropathology: deep learning-based assessment of tauopathy. Lab. Invest. (2019) doi:10.1038/s41374-019-0202-4. 44. Jones, A. D. et al. Impact of pre-analytical variables on deep learning accuracy in histopathology. Histopathology 75, 39–53 (2019). 45. Finlayson, S. G. et al. Adversarial attacks on medical machine learning. Science 363, 1287–1289 (2019). 46. Eykholt, K. et al. Robust Physical-World Attacks on Deep Learning Models. arXiv [cs.CR] (2017). 47. Cisse, M., Adi, Y., Neverova, N. & Keshet, J. Houdini: Fooling Deep Structured Prediction Models. arXiv [stat.ML] (2017). 48. Szegedy, C. et al. Intriguing properties of neural networks. arXiv [cs.CV] (2013).
Copyright: © 2023 The author(s). This is an open access article distributed under the terms of the Creative Commons Attribution 4.0 International License (https://creativecommons.org/licenses/by/4.0/), which permits unrestricted use, distribution, and reproduction in any medium, provided the original author and source are credited, a link to the Creative Commons license is provided, and any changes are indicated. The Creative Commons Public Domain Dedication waiver (https://creativecommons.org/publicdomain/zero/1.0/) applies to the data made available in this article, unless otherwise stated. |