|
|
|
Free Neuropathology 3:19 (2022) |
|
Review |
|
From Research to Diagnostic Application of Raman Spectroscopy in Neurosciences: Past and Perspectives |
|
Gilbert Georg Klamminger1,2,3, Katrin B. M. Frauenknecht2,3, Michel Mittelbronn2,3,4,5,6,7, Felix B. Kleine Borgmann2,3,1,5 |
|
1 Saarland University Medical Center and Faculty of Medicine, Homburg, Germany |
|
Corresponding author: |
|
Submitted: 31 May 2022 Accepted: 17 July 2022 Copyedit and Layout by: Jerry Lou Published: 05 August 2022 |
|
Keywords: Raman spectroscopy, Neurooncology, Neurodegeneration, Neurosurgery, Neuropathology, Machine learning |
|
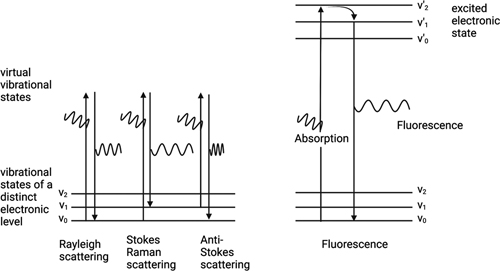
Abstract In recent years, Raman spectroscopy has been more and more frequently applied to address research questions in neuroscience. As a non-destructive technique based on inelastic scattering of photons, it can be used for a wide spectrum of applications including neurooncological tumor diagnostics or analysis of misfolded protein aggregates involved in neurodegenerative diseases. Progress in the technical development of this method allows for an increasingly detailed analysis of biological samples and may therefore open new fields of applications. The goal of our review is to provide an introduction into Raman scattering, its practical usage and also commonly associated pitfalls. Furthermore, intraoperative assessment of tumor recurrence using Raman based histology images as well as the search for non-invasive ways of diagnosis in neurodegenerative diseases are discussed. Some of the applications mentioned here may serve as a basis and possibly set the course for a future use of the technique in clinical practice. Covering a broad range of content, this overview can serve not only as a quick and accessible reference tool but also provide more in-depth information on a specific subtopic of interest. Introduction As one special method of various vibrational spectroscopic techniques, Raman spectroscopy (RS) has been an integral part in neuroscience research for some time now, be it in neuro-oncology for tumor classification1 or for the biochemical description of various protein aggregates in neurodegenerative diseases2. Currently it is making its way towards a clinical implementation3. Looking at the numerous advantages of RS, the reasons for an increased use in research are obvious: it enables fast and user-friendly (easy to apply) analysis for the purpose of tissue identification (e.g., identification of different brain regions in three mice strains4) by observed changes in the vibrational level of the underlying biochemical and molecular composition. Compared to other advanced molecular techniques, reproducible results can be obtained with few requirements regarding sample preparation. The insensitivity to water molecules predestines the technology for its use in a biomedical context. To date, the vast majority of studies using Raman spectroscopy examine unprocessed native, or frozen tissue/cells - few publications make use of formalin-fixed or paraffin-embedded (FFPE) tissue because Raman measurements remain challenging due to the strong contribution of paraffin wax to spectral intensity, thin specimens, and a disruption of the molecular integrity, which is related to the preceding fixation process. The long-term archivability and the large number of available samples, however, suggest use of RS FFPE tissue in pathology is desirable, e.g., for the analysis of tumor heterogeneity, or identification of very small tumor fragments, which could escape diagnostic high throughput of histology samples. The following review and perspective paper is divided into three parts: a) the basics of RS and the most common forms of its application in medical research are presented, b) the use of RS in selected neuroscience disciplines is accentuated with the aim to present different research questions – but even more importantly – the most interesting findings discovered with the help of RS, c) a future outlook for potential application of RS in research but also in the daily clinical work is provided. At this point, the minireview by Payne et al.5 needs to be mentioned; it describes in a clear way not only applications of RS in neuroscience, but also sets a special focus on the technical aspects and benefits of advanced spectroscopy-based techniques depending on the particular use case. By contrast, the following work places a special emphasis on topics that will inevitably become relevant to the practicing spectroscopist at some point, such as varying tissue sample requirements in different clinical settings (surgery department/pathology department) or common data processing methods, to name a few. Whenever it serves expedient the attentive reader shall be referred to additional more in-depth reading. Search for relevant literature A literature search (the search terms “Raman”, “Raman spectroscopy” were each combined alternately with the terms “brain”, “neuro”, “neuroscience”, “brain tumor”, “tumor”, “neurooncology”, “glioma”, “neurodegeneration”, “neurodegenerative disease”, “Alzheimer’s disease”, “Parkinson’s disease”, “Huntington”, “amyotrophic lateral sclerosis”, “prion disease“, ”multiple sclerosis”, “myelin”, “demyelination”, “stroke” “brain ischemia”, “brain injury”, “muscular diseases”, “brain infections”, “meningitis”, “psychiatry”) was performed, and online databases PubMed Central® and Google Scholar® were browsed for relevant reviews and original articles; other types of literature, such as congress papers, letters, comments e.g., were excluded. After search results were identified, they were hand-screened for eligibility (inclusion criteria: employment of RS on brain/peripheral nervous/muscle tissue, RS on extracellular components/cells of the nervous/muscular system, or RS in relation to neurological/oncological/psychological disorders; exclusion criteria: use of vibrational spectroscopic techniques other than RS) based on title/abstract. Within the responsibility of the authors, the final selection of literature was conducted based on the article full text. Finally, associated bibliographies of selected publications were searched for additional relevant sources that semantically met the search criteria. Only English language literature was considered – even though Japanese research groups describe an employment of Raman spectroscopy in rat brains, and human brains / brain tumors as early as the 90s6–9. Although references to historical developments are pointed out whenever a contemplation of the historical context seemed valuable special focus is set on literature of the years 2021 and 2022, reflecting ongoing research projects/groups - such as spectroscopical examination of microglial changes due to SARS-Cov-2 exposure10 - using RS in neuroscience. Principle of Raman scattering and general spectrometer set up The Raman effect is the process of inelastic scattering of photons; this effect was first described in 1928 by C.V. Raman, who examined the characteristics of scattered photons when applying a light source on different liquids11,12. For his discovery, the Indian physicist won the Nobel prize in 193013, but despite the discovery of the Raman effect in the first half of the 21st century, it took until late 1960s before it was first used in a biomedical context14–17. The interaction of incident light with a molecule leads to changes in the vibrational state, so that the molecule falls into an excited virtual vibrational state. When returning to the ground state, the largest amount of the incident photons is elastically scattered, which means that the energy of the scattered photon is the same as that of the incident photon (=Rayleigh scattering). Only a minor part of the scattered light experiences a change in its energy compared to the incident light; in fact when the molecule ends up on a different state in comparison to the ground state, the photon is inelastically scattered. Depending on the interaction between the molecule and the photon, inelastically scattered light can have a higher energy (anti-Stokes effect) or a lower energy (Stokes effect) than the incident light, whereas in practical application mainly Stokes scatter is attributed to a resulting Raman signal, due to its higher intensity.18 See Figure 1 for a visualization of the vibrational states transitions.
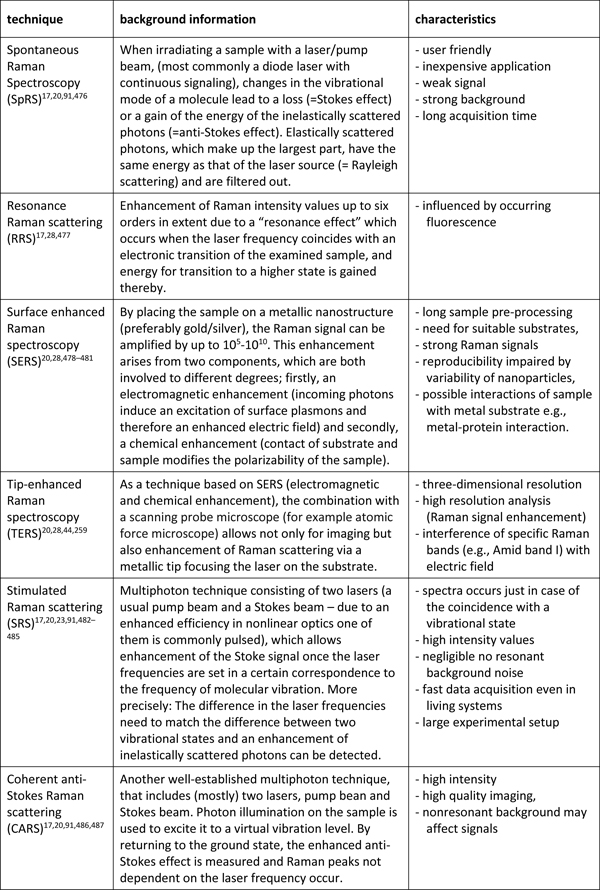
Figure 1. Occurring optical phenomena when irradiating a biological sample with a photon source (laser). In order to be Raman-active as a molecule, i.e., to emit inelastic Raman scattering, a change in polarizability is required - this already shows a difference to a related and often confused spectroscopic technique, infrared spectroscopy, in which an absorbed photon leads to a change in the dipole moment19. Another phenomenon, also based on absorption and often observable as a disruptive factor in Raman measurements due to its stronger signal is fluorescence; here the molecule, excited by energy of absorbed photons, leaves the ground electronic state and is transferred to a higher electronic state - as soon as it returns to the ground state, energy is re-emitted as fluorescence light20. The interaction of photons with their target molecules resulting in an inelastic Raman scattering with a distinct energy difference reflects specific chemical bonds and constitutions. This spectral fingerprint can indicate the identity of the target molecule. A spectrum can therefore be defined as a representation of the intensity values (based on the degree of change in polarizability) and the differing frequencies (Raman shift) in a function18,20. The x-axis displays the Raman shift in the unit wavenumber cm-1, thereby the wavenumber is reciprocal to the wavelength and thus directly proportional to photon energy19. The conventional experimental application of the process using the pure Raman effect is so the called Spontaneous Raman Scattering (SpRS). Additionally, there are several derivative methods allowing, for example, scattering with enhanced signal intensity or reduced background noise, thus lending themselves to different applications such as Raman Imaging (e.g., by coherent Raman spectroscopy). Table 1 gives an overview of the technical background and advantages of commonly used variants of RS in neuroscience. For a more detailed insight into the theoretical aspects of RS the interested reader may refer to Cialla-May et al.21, who provides a comprehensive overview in the book “Micro-Raman Spectroscopy: Theory and Application” by Popp et al.22. Additionally, Hu et al.23, Shi et al.24 and Evans et al.25 give a good overview about stimulated Raman spectroscopy (SRS) and coherent anti-Stokes Raman scattering (CARS); Zheng et al.26 wrote an instructive review about surface-enhanced Raman scattering (SERS).
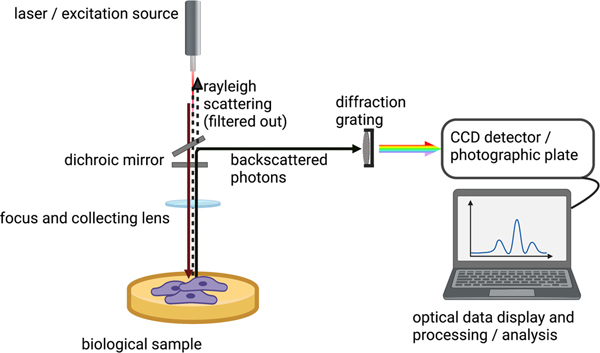
Table 1. Summary of commonly used Raman techniques, their physical background and the associated advantages and disadvantages. The exact structure of a Raman spectrometer differs depending on the manufacturer and the technology used. Only general components and their function are discussed below; additional components such as an additional laser or a special Raman substrate are commonly required in spectrometer setups of advanced Raman techniques (Table 1). With a focus lens, emitted photons of a laser source are focused on the sample, and after interaction with the sample both the elastic and the inelastic scattered photons are collected by a collecting lens. The reflected and elastically scattered light is then separated from the remaining light, typically by a dichroic mirror. A prism or diffraction grating spatially separates the light according to wavelength, leading it to a detection system - a photo paper was employed in the classical setup - either simultaneously on a charge-coupled device (CCD) or through a monochromator on a photomultiplier tube (PMT) (Figure 2).
Figure 2. Schematic and simplified representation of a Raman spectrometer set up. As excitation source, typically lasers, is used where the manner of photon generation as well as the wavelength differ. Commonly employed excitation wavelengths within the biomedical field are 532nm, 785nm, 830nm, or 1064nm - for practical application specific effects on the tissue type of interest as well as potentially induced background signals must be considered individually and adapted according to the experimental setup27. Most employed lasers nowadays are diode lasers; with the advantage of portability and favorable energy efficiency, they have replaced the gas-based lasers (helium neon laser, argon-ion laser) that were often used in the past. The type of proton emission can be divided into continuous-wave lasers and pulsed lasers; the former being more common in SpRS and the latter being necessary in SRS18,28. It is necessary to bundle photons both in the suitable focus on the sample (focus lens) and to collect the scattered photons (collecting lens) after interaction with the sample. Next, Raleigh scattered photons are filtered by a dichroic mirror and separated according to their wavelength using a diffraction grating; depending on the sampling aperture (exit slits/pinholes) within the setup, a certain number of photons are detected in a final step by the sensitive detection system. While the classical “scanning spectrometer” employs a rotatable grid concentrating the photons on a narrow exit slit and a photomultiplier tube behind detecting RS, modern set ups usually use a CCD detector. This multichannel way of photon detection (a multichannel array chip consisting of several pixels) allows for simultaneous registration and display of all photons, i.e., the whole Raman spectra18,28,29. Regular wavelength calibration (process of transferring pixel hits on the CCD detector to distinct displayed wavenumbers) is recommended to receive reproducible spectra over the entire duration of the experiment28. Raman spectra can be employed in various ways. In addition to the possibility of using them as raw spectra primarily for the identification of biochemical components of a sample, methods called Raman microscopy/imaging use the assignment of colors to Raman bands (only a limited number of wavenumbers is acquired or analyzed)30 over a scanned sample to generate contrast. When extended to focusing through the depth of the sample, three-dimensional Raman images can be built16. Raman microscopy/imaging techniques31,32 and computational image generation algorithms have been advanced to generate Raman images of various brain pathologies, e.g., gliomas, stroke and demyelination25 or to image metabolism in the brain33–35. Using this approach of data visualization, it is possible to obtain a similar look to traditional H&E-stained slides on unstained specimen, which enables histopathological diagnosis36. In Raman mapping, the whole Raman spectrum for each point of the desired area of the specimen is acquired (either point by point or with an excitation laser forming a line on the sample and measuring simultaneously); using computational analysis afterwards, a visualization of differences in the spectral properties of data points is achieved30. Peak assignment Raman peaks may occur at first sight in various forms with different characteristics. In addition to certain single peaks that appear narrow and can be assigned to exactly one corresponding functional group, an additive effect of several adjacent Raman active molecules in the sample can also result in broad peaks. Furthermore, the presence of several contributing components, and thus neighbor dependent changes in the vibrational mode in one specimen, may affect the actual peak in comparison to an isolated measurement20. The application of RS in the biomedical context often pays special attention of the regions within the wavenumbers 400-2000cm-1 and 2700-3500cm-1. These regions, often referred to as "biological fingerprint regions" in the literature, are characterized by a high proportion of Raman peaks arriving from functional groups of a typical biological specimen28. An introduction to the use of RS for identification of different molecular functional groups can be found in Pezzotti et al.37 (RS and cell biology) , Czamara et al.38 (RS and lipids), Rygula et al.39 (RS and proteins) and Wiercigroch et al.40 (RS and carbohydrates). By using RS on biomolecules such as proteins, it is not only possible to identify molecular functional groups i.e., differentiate between different amino acids/proteins, but also spatial confirmations can be detected since the Raman signal is influenced by aromatic/non-aromatic side chains and the backbone of a protein. Distinct vibrations result in certain amide bands (Amide band A, B, I-VII)41; for example carbonyl stretching modes, N–H bending or C–N stretching results in the widely used Amid I (1600-1690 cm−1), Amid II (1480-1580 cm-1) and Amid III peaks (1230-1300 cm−1). They allow further examination of the peptide secondary structure. In larger unordered protein measurements a precise peak attribution may not be possible due its large number of contributors18,39,42–44. Lipids are ubiquitous in biological specimen, as they form the membranes of cells and organelles. Depending on the literature, spectral properties resulting mainly from the hydrocarbon chain and partly from the polar head group can be assigned to the regions 1050-1200cm-1 (C-C stretching), 1250-1300cm-1 and 1400-1500cm-1 (CH2, CH3 group activity) or also to the regions below 600cm-1 and between 1000-1150 cm-1 (opposite motion of carbon atoms of the hydrocarbon chain). Consistently, an area within the high wavenumber region 2700-3500cm-1 (sometimes solely the range between 2800-3100cm-1 is considered in the literature) is reported and attributed in a large part to stretching of C-H groups. In-depth analyzes of peak intensity and distribution in the high wavenumber region allow conclusions to be drawn about the saturation status of fatty acids and the aliphatic/aromatic components of steroids18,38,45,46. An interesting contribution at this point may come from Krafft et al.45, who in 2005 measured and characterized twelve brain lipids and further related occurring peaks to their functional groups and Pezzotti et al.47, who employed RS to visualize single (phospho-)lipids in neuronal cells. Carbohydrates and underlying C-C and C-H structures give rise to bonds in various areas within the Raman spectrum18. For a long time, minor attention was paid to the investigation of carbohydrates. Although specific peak assignment is possible, in comparison to protein and lipids it remains less specific40. About 30 Raman peaks of nucleotides, distributed over several areas within the spectrum, are mostly attributed due to purine/pyrimidine ring modes and phosphate groups (especially peaks next to 800cm-1 and 1100cm-1). They are useful for characterization of inter alia DNA, tRNA, and nucleic acid-protein complexes18,48. Spectroscopic examination not only allows for examination of these specific functional groups enumerated above, but also to display their interactions, such as protein-protein / protein-lipid interaction. Their changes in spectral property under different conditions can also be measured17. On that note, Lee et al.49 have even managed to use SRS as a tool in neurophysiology when examining the spectral properties of neuronal membrane potential. Although specific Raman peaks have been described for various molecules50–56, one should be cautious when actually assigning peaks to one's own sample. While peaks may be characteristic for a certain biochemical compound, they can also arise from different sources; viz they are not specific. In order to correctly assign peaks / detect them within a spectrum, it is essential to reduce potential confounders within the sample or the experimental set-up pre/post-experimentally. A potential way to assign distinct peaks with high evidence is direct observation: Targeted manipulation of a sample can help to confirm the source of a peak. The vibrational spectroscopic experimental setup RS is a fast, non-destructive, user friendly, and easy to apply on tool providing molecular information with minimal sample preparation requirements in a reproducible manner. However, a routine use of RS-based tools in neuroscience has not yet been established. Regardless of the numerous advantages certain limitations have to be considered not only pre-experimentally, but also during implementation of an experiment and afterwards when visualizing and processing the obtained data. The occurrence of the physically related phenomenon of (auto-)fluorescence (photons of the pump beam are absorbed by molecules of the sample which are raised to another energy level - when returning to the basic energy level a photon is emitted, see also Figure 1) is regularly observed and the expected intensity in this case is well above the intensity of the Raman signals. To reduce wavelength- dependent autofluorescence, a distinct wavelength of the excitation source can be selected, or SERS can be used57,58. Although in contrast to other sophisticated laboratory techniques (e.g., genetic/epigenetic testing) there are less requirements for a correctly prepared Raman sample. A few things need to be considered in order to avoid the occurrence of spectral background noise and spectral contamination: Samples must be placed on a robust Raman substrate so that the selected measuring point and the focus remain stable. Depending on the experimental question as well as the expected background noise and the costs, various Raman substrates are available. In addition to gold or aluminum-coated glass slides (as a function of the excitation wavelength glass alone exhibits a strong and broad fluorescence background signal in the “biological fingerprint region”), special slides (low-e slides, CaF2 slides, quartz slides) can be considered28. These are characterized by a low spectral background or single peak attribution. Fullwood et al.59 and Kerr et al.60 examined the effect of substrate choice for spectral histopathology in more detail. It has been shown that CaF2 slides (exclusive peak at 321cm-1 or 322cm-1 respectively, depending on the literature)61 have the least influence on the spectral background in comparison to low-E slides and Spectrosil slides. The single background peak can either be ignored due to its irrelevant occurrence out of the important range of biological components within the Raman spectrum, or can be subtracted via computational analysis afterwards. As a low-cost alternative aluminum foil can be used, which itself does not generate any significant background noise62–64. Furthermore, the sample condition (most commonly native/frozen or formalin-fixed) needs to be considered pre-experimentally. Although fresh tissue samples allow for a straightforward attribution of Raman peaks to underlying biochemical components, they must be processed and analyzed within a certain time window and cannot be stored for a longer period of time. When working with fresh tissue, dehydration and associated denaturation of functional biochemical groups need to be prevented e.g., by keeping the specimen hydrated19,65. As an alternative, Raman measurements of frozen biological samples allow longer storage and at the same time still give an insight in the biochemical composition of the biological sample. Nevertheless, it should be noted that a reduction in certain peak intensities and significant alteration of Raman signal in comparison to native tissue were described when using frozen sections66,67. The handling of formalin-fixed, methanol-fixed, or FFPE samples is routine during the pathological workflow; even though samples allow long archivability and are broadly available, this way of fixation damages the biological Raman spectrum to a certain degree since the tissue undergoes an aggressive chemical procedure68–72. Both formalin and methanol fixation reproducibly alter spectral tissue properties and affect Raman bands assigned to lipids, proteins, and nucleic acids73. Despite formalin-induced biochemical changes such as formation of cross-links in the structure of the amino acids, spectroscopic assessment and classification of formalin-fixed biological tissue is possible66; in contrast, methanol-fixation was reported to potentially hamper the detection of tissue malignancy72,74. The prominent spectrum of bound paraffin wax is reflected in certain points at 1063, 1133, 1296 and 1441cm-1, which make a manual or digital dewaxing process necessary and require a careful interpretation of the obtained spectra75. Several conditions (aggressive chemical processing, required choice of special substrate and the fineness of the tissue) hamper spectroscopic examination when employing RS on FFPE tissue in the pathology department, although spatial orientation on the sample and proper identification of certain areas are a potential advantage. In the literature different approaches used RS on processed tissue; in any case they all face similar difficulties. Huang et al.68 described the effects of formalin fixation on RS of cancerous human bronchial tissue, whereas Draux et al.71 described the influence of formalin and air drying on single cancer cells and attributed spectral changes to affection of nucleic acids and proteins. Even though not only a loss of the original chemical composition but also potential contamination due to the process of formalin-fixation in murine brain tissue was determined by Hackett et al.76, several studies proposed formalin fixation as a sufficient and favorable method for subsequent spectroscopic diagnostic77,78. As a proof of concept, Stefanakis et al.79 demonstrated the feasibility of vibrational spectroscopy on formalin-fixed malignant brain tissue. Employing vibrational spectroscopy on FFPE tissue, an effect on the lipid content due to the dewaxing process was reported; nevertheless, Raman bands related to cellular and extracellular proteins were successfully measured80. Gaifulina and colleagues81 examined large intestine FFPE tissue from rats and analyzed biochemical signals obtained with label-free RS in the processed tissue. Other groups examined FFPE tissue of rectal cancer to predict radiotherapy response82, to map/analyze cervical tissue83,84, or employed RS on healthy and malignant breast85–88/ovarian89/prostatic90 tissue in various fixation states. For a good overview on the influence of tissue processing on biological Raman spectra the reader may refer to the work from Faoláin et al.66. During spectroscopic examination, background noise due to a nearby photon source (e.g., room light) should be considered and reduced by performing the Raman measurement in a darkened area or with dimmed operating room light91–94. Additional methods of spectra quality control during intraoperative measurement have also been proposed95,96. By ensuring that the laser settings (wavelength and power, duration of acquisition) are optimized for the examined sample, the best signal-to-noise ratio can be determined, and thermal tissue decomposition can be prevented. This form of sample destruction can be detected by a burned area where the former focus area of the laser is located, as well as by the presence of an additional carbon band at approx. 1500cm-1 in the Raman spectrum28. Data processing and computational analysis After the measurement, the large amount of data97 should be sorted and stored in a structured manner (data annotation) to address the research question properly. It is good practice to start the data processing with an initial visualization of the data. In this way clear deviations from an expected result such as strong contamination or cosmic ray artifacts (randomly occurring electromagnetic radiation) and hot pixels (overresponse of a pixel on the CCD detector to an incoming photon) can be recognized and corrected28,98,99. For a more detailed reading on potential anomalies and artifacts that may occur, see Bowie et al.100. During data preprocessing, a baseline correction can be applied to the data to minimalize residual background signal and autofluorescence101,102; a common way to model and subtract the background noise to obtain the intrinsic sample spectrum103,104. Additionally, a common way to further reduce the noise in the data is a smoothing technique, such as Savitzky-Golay filtering28,105,106. Both of the above-mentioned methods must not be used without proper caution as there is always the risk of producing artifacts, as well as equalizing significant data points. In order to correct confounders that result from the experiment setup itself (e.g., slightly different dryness or thickness of the specimens) data normalization methods, such as min-max normalization or z-normalization, usually precede the actual data analysis107. Specialized spectroscopy software are commercially available and enable even the inexperienced spectroscopist to use the acquired data in a structured and comprehensive manner108. Due to the large amount of data, several data reduction methods are used for quick explorative purposes, above all PCA (principal component analysis) is widely employed. This unsupervised clustering technique can be used to determine principal components in a big data set, which explains a significant part of the variance and reduces noise41,109.< In the last step of computational analysis, classification algorithms and machine learning techniques110,111 are commonly used to classify the spectral data either according to pre-experimental defined groups (supervised clustering) or according to new groups based on similarities in spectral properties (unsupervised clustering)112. A widely used technique in unsupervised clustering is hierarchical cluster analysis (HCA), in which the data is transferred to a higher-dimensional space, cluster in a certain proximity to one another based on similar properties. A number of cluster variables can be specified individually, which forms the selected number of similar clusters103. Unsupervised clustering is beneficial for exploratory research questions since no prior knowledge of possible group properties is required28. Common methods used for supervised clustering are trees/random forest classifications (several decision trees in a row) or support vector machines (search for a hyperplane to distinguish between classes)91. The groups determined a priori are referred to as "classes" and the gold standard histopathology often serves as ground truth. In general, the algorithm is trained with a training data set and tested with an external validation data set afterwards. To avoid overfitting (capability of good differentiation only on the specific training data set) a validation of performance e.g., k-fold cross validation or holdout validation is performed, and metrices of algorithm performance (e.g., sensitivity, specificity, f1-score, accuracy, AUROC/AUPR value) are calculated afterwards based on its output113. Ralbovsky and colleagues provided an overview of machine learning algorithms and their functions in Raman based cancer detection112. RS in Neurooncology With a growing number of publications in the last years (Zhang et al.114 and Banerjee et al.115 described a change in spectroscopic properties of glioma cells in comparison to astrocytes already in the mid-2000s), the neuro-oncological field is one of the largest areas of research on RS, in which the therapeutical balancing act between maximum resection of normal-brain-resembling tumorous residues and minimal surgical disruption of healthy brain functions proves particularly difficult. On the subject of RS in (neuro)oncology reviews by Auner et al.20 and Hollon et al.116 give a comprehensive introduction to the respective topic; for further reading on implications and current progress of RS in oncology see also Santos et al.117. At first sight, use of this spectroscopic technique mainly apply to two main research focuses: on the one hand a spectroscopic detection of malignancy118,119 which in a next steps allows precise, accurate diagnosis of the tumor entity intraoperatively without having to wait for further traditional tissue processing (pathological diagnosis on frozen sections)120,121, and on the other hand real time surgery guidance i.e., live feedback intraoperatively122,123 aiming for maximal tumor resection124–126. Both topics merge and evolve at a certain point; this may result in new research questions, e.g., when aiming to determine tumor infiltration zone / resection margin or when aiming for detection of tumor genetics on various states of tumor tissue. Moreover, also basic research questions in oncology can be addressed with this vibrational spectroscopic technique e.g., monitoring lipotoxicity in glioblastoma cells127, observing cell response of U251 glioblastoma cells after induced apoptosis128, examining the glycosylation pattern of proteins in medulloblastoma129, or observation of redox state of mitochondrial cytochromes130, just to name a few. Most research groups use SpRS20 as an easy to apply, label free method. More advanced Raman techniques in neurooncology131 are used predominantly in animal models132–134 – where Surface enhanced resonant Raman spectroscopy (SERRS) detection of tumor margins135 has shown prognostic benefits136, or CARS was employed for detection of different human brain tumors in a mouse model137. RS for detection of tumor group, genetic alteration and histomorphology RS can distinguish between grey and white matter and (partly) other brain regions such as cerebellum, striatum, basal forebrain - both macroscopically and on cellular resolution4,138–146,147. Interestingly, one analysis of the mouse brain using SERS revealed a different spectral fingerprint and thus also different biochemical composition between left and right hemisphere148. Spectroscopically feasible discrimination between glioma tissue and brain tissue was reported in several studies3,149–153 as well as between dura mater and meningioma, which was demonstrated to be based in part on peaks corresponding to collagen and on the higher lipid content within tumorous tissue154–156. Beside these binary classification models, several studies showed the potential of RS aiming for a multiclass classification to differentiate various tumor entities within one classifier119,157–166 or to determine the primary site of metastasis167,168. Using Raman mapping/imaging for brain tumor visualization116,169, even special morphological features of tumors (e.g., necrosis in glioblastoma, cell density or individual cell nuclei) could be identified170–172. Even though areas of tumor necrosis are typically characterized by an increased presence of proteins such as phenylalanine (around 1032cm-1, among others) as well as cholesterol esters (1739cm-1)171,173, one group proposed two distinct spectral properties within the necrosis of glioblastoma cells: “highly necrotic”, showing an increase in plasma proteins and “peri-necrotic”, exhibiting a higher lipid content174. The histopathological heterogeneity of tumor tissue samples was addressed in fresh and frozen brain sections, although possible confusion between different tumor components (i.e., tumor hemorrhage and necrosis) is described36,173. The genomic heterogeneity in glioblastoma has also been successfully addressed175. Other approaches make use of an alternative advanced Raman technique named Stimulated Raman histology176–179 (SRH), where distinct wavenumbers are used for image acquisition and virtual H&E-like images are generated after computational processing. With this approach in combination with deep convolutional neural networks, amongst others Hollon et al. assessed (pediatric180) brain tumors intraoperatively1,181,182. In the scope of this imaging approach, also a traditional pathological diagnosis based on digital Raman histology slides seems feasible183–185. RS could be used to identify brain edema186, tumor recurrence187 or tumor margins188–194 but also tumor infiltration zones.195,196 In general, infiltrative glioma cells showed significant spectral differences in the regions of phenylalanine and Amide III (around 1030cm-1 and 1230-1300cm−1), as well as the region assigned to C-C stretching lipids and nucleotides (around 1050-1100cm-1) – just to list a few wavenumbers of interest exemplarily197. Ji et al.196 report the cellularity within a sample as well as the density of axons and the ratio of lipid and protein contents as the basis for the difference in spectral properties. Even single tumor cells198 were detectable using RS, something alternative imaging methods struggle with. RS was also applied to observe glioblastoma tumor evolution199, to determine the molecular subtype of glioblastoma200, and to give insight in glioma biochemistry201. RS was shown to be superior in differentiation of brain tumor and glioblastoma in comparison to 5-ALA-induced fluorescence202,203, and capable to detect IDH mutations in gliomas – inter alia changes in the spectral protein profile are consistently reported in case of IDH mutation204–206. It also showed diagnostic value in tumor discrimination when measuring small extracellular vesicles207, or potential when tracking/detecting metabolic changes208–210 in brain tumors/cancer cells, as well as drug delivery mechanisms211 and post-therapeutic changes212 in glioblastoma cells. Spectroscopic classification of different grades of brain tumors is possible213. Zhou et al.214 distinguished between different WHO grades of gliomas using Raman bands of tryptophane (around 1588cm−1, among others) and carotenoids (1008cm−1, 1157cm−1, 1521cm−1, 2320cm−1, and 2667cm−1) as well as the peak intensity ratio between proteins and lipids in the high wavenumber region (2934cm−1/2885cm−1). The group of Morais et al.215 and Lilo et al.216 differentiated between different grades of meningiomas. Zhang et al.217 associated an intensity ratio in the high wavenumber region with different meningioma grades. While gliomas/neuroepithelial tumors and meningiomas have been described218 and morpho-chemically analyzed219,220 extensively221, some work also exist on neuroblastomas. One group differentiated between different neural crest-derived tumors in fresh and frozen tissue222,223, and Ricciardi et al.224 used RS to examine changes in the biochemistry of neuroblastoma cells after exposure to radiation. Medulloblastomas225, biopsies of the pituitary gland209,226, seeds of retinoblastomas227, and carcinoma metastases228 have been spectroscopically studied as well. Early, intraoperative, and neuropathological diagnostics using RS Perioperative ex vivo tissue assessments allow for direct and early treatment decision, e.g., when examining smear brain tumor samples94 or discriminating between primary CNS (central nervous system) lymphoma and glioblastoma based on biopsies229. RS can also be applied intraoperatively (in vivo) - recently even in dogs230 - using a hand-held probe for tumor classification231–237, where a real-time auditory feedback mechanism has been proposed to guide the neurosurgeon238. Transcranial RS, leaving the skull intact, has been proposed and demonstrated in a mouse model239. Using optical spectroscopy applied on FFPE tissue, Devpura et al.240 and Gajjar et al.159 examined a possible application of RS to various brain tumors already in 2012/2013. Shortly after, Fulwood et al.241 distinguished between glioblastoma, metastases and normal brain using immersion RS on FFPE samples. Livermore et al. 204 have been able to carry out the above-mentioned analysis of the IDH mutation detection in glioblastoma tumors also on FFPE tissue. Different histological areas can be distinguished in glioblastoma in FFPE tissue, with a sound separability between the peritumoral area and the area of necrosis242. To enable early and non-invasive cancer diagnosis, some approaches aim for identification of meningioma243 and glioma244 patients based on serum samples and resulting spectroscopic behavior. Using RS as an additive technique, Le Reste et al.245 combine spectroscopic data and transcriptomic data for machine learning analyses on glioblastoma subtypes and related clinical outcomes. RS in Neurodegenerative Diseases Misfolded proteins and aggregates in various diseases246–248, e.g., Alzheimer's (tau and amyloid), Parkinson's (alpha-synuclein), Huntington's (polyglutamine), are in general accessible to vibrational spectroscopic techniques249. Usage of these techniques ranges from tracking and characterization of misfolded proteins41, to potential new diagnostic methods250,251, especially in biofluids252–254. Studies on the pathological hallmarks of neurodegenerative diseases used a variety of RS techniques; most frequently employed techniques are SERS, TERS (Tip-enhanced Raman spectroscopy), as well as DUVRR255,256 (deep UV resonance Raman), where a wavelength in the range of UV (200nm) is used as excitation source which results in an increased intensity. Another common technique named ROA (Raman optical activity) makes use of the principle that a chiral molecule scatters left and right handed polarized photons at different intensities and so is particularly useful to analyze protein aggregates257,258. Furthermore, also IR (infrared)-spectroscopy and related/modified vibrational methods are common, and a combination of techniques could lead to an increased diagnostic ability and gain of knowledge2,259–262. Several ways of increasing the detectability of a sample via RS have gained popularity in the neurodegenerative field. Bringing in a labelled isotope into the backbone of a peptide shifts certain amid bands and enables a demarcation from the existing amide bands emanating from the unlabeled proteins in the sample, although an overlap of Raman peaks of interests may occur263,264. Another similar approach integrates external probes such as unnatural amino acids with vibrational potential into the sample, which can afterwards be traced by specific Raman peaks, often in the range between 1900-2900cm-1 where the interference with other peaks of the specimen is minor264–266. For further reading, Devitt et al.2 provides a detailed insight into the use of RS in the field of neurodegenerative diseases. Around 20 years ago conventional RS was already capable of distinguishing between AD brain tissue and healthy control brain tissue (in 2022 machine learning algorithms are useful to do the same267) and to determine the presence of amyloid-beta-sheets in senile plaques268–270. Shortly after, Raman signals of the hippocampus of AD rats were proposed to aid diagnosis of AD271. Kurouski et al.44 give an overview of the application of RS in the course of plaque formation and structure; Wilkosz et al.41 provide a comprehensive list of wavenumbers associated with protein aggregation. Detailed examinations of the (secondary)-structure of beta-amyloid in various experimental set ups have been carried out using DUVRR272–275 or ROA44. Cunha et al.276 used a combination of Raman techniques for amyloid plaque characterization. SERS has been used to identify tau protein and (soluble) amyloid beta277,278, and to detect amyloid-beta1-40 monomers and amyloid-beta1-40 fibrils in solution279 as well as in brain tissue280. Aβ40 and Aβ42281 were shown to be distinguishable. TERS was used to characterize natural Aβ1-42 fibrils and identify toxic oligomeric forms282,283. RS was capable of visualizing amyloid in AD brains post mortem and of displaying neuritic plaques and neurofibrillary tangles284 – even though the latter findings were questioned and measurement of lipofuscin granulates instead of plaques was proposed285 Raman imaging also determined the presence of hemoproteins in senile plaques286 and allowed for reconstruction of the evolution process of different types of amyloid beta plaques287. Based on RS measurements, AD-associated astrogliosis288 and lipid deposits in vicinity of fibrillary plaques were identified and further morphologically described289. Beside the identification of amyloid beta290–292, for example in the surrounding of neuronal spines293, Raman imaging294,295 has been used to compare the concentration of Aβ in hippocampal regions and eye lens tissue296 and to determine cholesterol- and sphingomyelin-rich structures surrounding amyloid plaques, thought to represent dystrophic neurites297. Another research group used CARS to determine a higher content of lipid, collagen and amyloid fibers in Alzheimer-affected brain samples298. Searching for biomarkers as an early diagnostic tool in AD299–302, human tears303, saliva,304 cerebrospinal fluid305 (different states of amyloid beta confirmations could be detected in cerebrospinal fluid already in 2008306), retinal imaging307 and blood samples308–318 have been evaluated for a potential diagnosis of AD using spectral differences arriving from platelets319 or the concentration of the neurotransmitters Glutamate (GLU) and γ-aminobutyric acid (GABA)320. In the course of this approach, it has been shown that cortical cataract may not be a sufficient predictor of AD296. The detection of neurotransmitters using RS has been shown and further analyzed, by Ardini et al.321, Lee et al322, Moody et al.323–325 (i.e. RS for detection of neurotransmitters through the skull), Cao et al.326 / Zhou et al.327 (neurotransmitter detection in serum), Ciubuc et al.328 (RS for dopamine detection and analysis), Silwal et al.329 (dopamine and dopamine transporter interaction), Manciu et al.330 (dopamine – serotonin interaction) and Shi et al.331 (quantification of norepinephrine). In addition, RS is also suitable to examine the interaction of beta-amyloid with metal ions332–337. Interestingly, detection of tau335–338 and insulin342–345 has so far been studied to a lesser extent; ozone exposure as a known risk factor has been found to lead to spectroscopically measurable changes of the hippocampus in a rat model346. In Parkinson’s Disease (PD), a main focus of the application of RS is the characterization of the secondary structure of alpha-synuclein338,347–349 as well as the identification of alpha-synuclein aggregations, feasible not only in the brain but also in the gut350. Mensch et al.351 used ROA to examine the spectral properties of α-synuclein during transition to its secondary structure. Another group spectroscopically characterized the striatal extracellular matrix in a PD mouse model352. Since early loss of dopaminergic neurons is an early change in patients with PD, different approaches aim for detection of dopamine353–355, e.g., in striatum of mice356, or in blood samples of patients with antipsychotic drug-induced Parkinsonism357. Other efforts to establish early diagnostic tests for PD, such as examination of erythrocytes and blood coagulation in PD patients358, were carried out e.g., by Carlomagno et al.359 using saliva of PD patients and Schipper et al.360 who combined RS and NIRS (near infrared spectroscopy) to distinguish between blood samples of PD patients and a control group through different spectroscopic properties correlated with oxidative stress. Mammadova et al.361 used RS in a PD mouse model to detect pathological retinal changes as a method to distinguish between healthy and diseased samples. Analyzing peripheral nervous tissue in ALS mice and autopsies of patients suffering from ALS, Tian et al.362 showed that Raman imaging was capable of visualizing and detecting early pathological changes. Different approaches distinguish between altered lipids and proteoglycans in spinal cord tissue of ALS mice and healthy controls363, or test the prognostic value of SERS in ALS patients364. In addition to the many approaches to diagnose AD and PD patients by RS, others focus on ALS as well. For diagnostic purposes, Zhang et al.365 used SERS on plasma samples to distinguish between ALS patients and a healthy control group; Morasso et al.366 proposed vibrational spectroscopy and extracellular vesicles as a potential biomarker and another research group spectroscopically examined saliva from ALS, PD, and AD patients, showing differences in the spectral properties of each group367. In the context of Huntington Disease (HD), RS has been used for quantification and visualization of aggregated polyglutamine368 and for the assessment of its structure369,370. Huefner et al.371 found significant changes in the spectra related to disease progression, as well as differences corresponding to genotype and gender in serum samples of HD patients and healthy controls. In another approach, membrane composition of HD-affected and control peripheral fibroblasts were separatable using RS, suggesting that cell membrane damage may serve as future diagnostic biomarker372. RS has also been used for research on Prion Diseases373–378; one research group employed the method to examine the diagnostic value when analyzing blood samples of sheep to detect the altering from of PrPC to PrPSc379. Spectroscopic examination of myelin composition in the CNS and in peripheral nerve tissue RS proves useful to gain a deeper understanding of the molecular myelin composition; Pezzotti et al.380 examined the physical chemistry of cocultured neuronal and Schwann cells. In addition, RS may be advantageous to detect pathological processes of demyelinating diseases in the CNS or in peripheral nerve tissue. Carmona et al.381 studied the spectroscopic hallmarks of lipid chains in myelin membranes as well as the secondary structure of associated proteolipid proteins (PLP). Some publications report the possibility of detecting myelin in vivo using Raman microscopy382,383; Huang et al.384 described different compositions of myelin structures, whereas Wang et al.385 used CARS microscopy to detect not only myelin but also axons, the node of Ranvier, and the Schmidt-Lanterman incisure. Fu et al.386 visualized fiber tracts in mice brain by imaging the myelin along the axons. In 2021 Lucas et al.387 used CARS to determine myelination deficits in a fragile-X-syndrome mouse model. Out of pure academic interest the publication of Poulen et al.388, in which Raman scattering on spinal cord myelin distinguishes between three different species (human, mouse, lemur), shall be mentioned at this point. Few Raman experiments deal with Multiple sclerosis (MS)389; the process of myelin degradation can be addressed with RS not only quantitatively390 but also qualitatively. To tackle alterations in the biochemical compositions in human brains postmortem, Poon et al.391–393 measured various pathologic features and showed that even normal appearing white matter next to MS lesions included spectroscopically measurable changes. Imitola et al.394 correlate the presence of microglia (on a side note: even the activation of microglia is traceable using RS395) and axonal injury/demyelination using CARS microscopy. Fu et al.396 applied the same method to examine different time points of experimental autoimmune encephalomyelitis in mice and Gasecka et al.397 used CARS to detect induced autoimmune demyelination in spinal cord of mice. Another approach was carried out by the team of Alba-Arbalat et al.398; they detected spectral changes of defined molecules in the retina (even an in vivo use of RS applied on human retina is in line with laser safety regulations399) - associated not only with different phases of MS, but also age-related in healthy patients. Raman-based research of myelin composition and pathology is not limited to MS, it also extends to the study of demyelination and its biochemical changes in peripheral nerve tissue400 - even pathological401 and age related402 changes. Using different Raman techniques the remyelination process in the spinal cord of rats after iatrogenic induced demyelination403, as well as remyelination in rat sciatic nerve404, and biochemical changes during nerve injury405,406 can be tracked. Another approach used CARS imaging to interpret the interaction of different macrophages (resident and recruited) after Wallerian degeneration407. Upcoming novel fields for RS - from stroke to muscular diseases to psychiatry RS has been applied in combination with infrared spectroscopy and atomic force microscopy to characterize different types of thrombi in ischemic stroke408 or to characterize atherosclerotic plaques409,410. Changes in fibrin concentration in a blood clot after zonal thrombolysis with urokinase411, or the metabolic regulation of artery tone412 were examined. Other research groups investigated spectroscopic changes in the hippocampus due to cerebral ischemia-reperfusion413, or spectroscopic changes in the amount of Cu+ and Cu2+ ions in brain ischemia414. Russo et al.415 used Raman traceable cytochrome c to investigate effects of insulin on the hippocampus after transient ischemic brain conditions, Yamazoe et al.416 used a self-developed Raman approach to detect areas of an ischemic core area. The group of Caine et al.417 used a combination of imaging techniques, amongst others Raman imaging, to track biochemical changes in the peri-infarct zone after induced stroke in a mouse model. As an alternative way of infarction diagnostic, Fan et al.418 proposed tear RS in combination with machine learning tools as a non-invasive technique. In context of brain hemorrhages, Raman imaging has been used to detect microvessels and induced hemorrhage419, as well as to track the oxygen flow in brain vessels420. Furthermore, RS was employed as a method in rat brains with striatal hemorrhages to evaluate the biochemical composition after rehabilitation treatment421. Employing SERS, the subarachnoid hemorrhage biomarker glial fibrillary acid protein can be detected422. SERS can also be used to assess complications post subarachnoid hemorrhage, like vasospasm and hydrocephalus423. In tissue conditions of brain or spine injury, RS was applied to tissue of rat models424–426 and on retinae of mice after traumatic brain injury427. Biochemical changes in affected areas arising from hem or divergent levels of cholesterol were discovered428 and compared to MRI scans429. RS was capable of detecting injured motor cortex areas where certain spectroscopic properties were associated with cell death430. Employment of SERS-based methods allow for detection of neuron-specific enolase (NSE), N-acetylasparate or S-100β in blood samples as biomarkers for brain injury431–435; aiming for intraoperative assessment of molecular changes - one group developed a device for intracranial spectroscopy within brain injury436. Changes in the biochemical and cellular composition of rat brain after gamma radiation have been addressed by Kočović et al.437. For a further reading the reader may refer to Stevens et al.438, who has recently reviewed the current deployments of Raman spectroscopy in traumatic brain injury in a detailed way. Even muscular diseases are accessible to RS: Niedieker et al.439 used CARS imaging to visualize morphological hallmarks such as glycogen storage and internalized nuclei in various muscular diseases; Alix et al.440 reported different spectral properties of mitochondrial and non-mitochondrial muscular diseases; and Gautam et al.441 showed the differences in the spectra of Raman measurements from muscles of Drosophila with certain mutations affecting the muscular system in comparison to healthy controls. SpRS was used for in vivo identification of Duchenne muscular dystrophy (DMD) affected muscles in a mouse model and human muscles affected with the same disease with ex vivo measurements showing similar Raman peaks442. Hentschel et al.443 evaluated the use of fibroblasts together with application of CARS and other methods to study the etiology of neuromuscular diseases. Blood sample testing for the diagnosis of DMD was proposed and successfully performed in a mouse model444; the comparison of spectral properties of the erythrocyte membrane in DMD patients and healthy controls demonstrated biochemical differences due to protein anomaly445. One of the potential domains of RS in the area of infectious diseases of the brain and meninges is the diagnostic detection of pathogens. It has already been capable of identifying viral strains446, changes in bacterial metabolism447, or differentiate/detect different types of bacteria related to meningitis448,449. Although the diagnoses of tuberculous meningitis450 or Neisseria meningitis451 as well as possible differentiation of blood cell types452 using RS on CSF samples is reported, reliable detection of bacterial meningitis in CSF was not yet sufficiently sensible; therefore, a combination of techniques was suggested453. Another approach employs RS in neuroimmunology as a tool to monitor apoptotic changes in hippocampal progenitor cells454. RS has also been applied in psychiatric disorders; e.g. to visualize the drug mechanism of a serotonin reuptake inhibitor in mouse brain455 and to identify blood serum samples based on alterations in phospholipids and proteins of patients with affective disorders456–458. Recently, Chaichi et al.459 measured changes in brain lipidome spectroscopically in post-traumatic stress disorder (PTSD) rats, but also the vibrational spectroscopic properties within myalgic encephalomyelitis have been subjected to further analysis460,461. Conclusions and outlook All studies and literature cited in this review focused on preclinical/clinical use of RS with the intention to provide the interested reader a general overview rather than a detailed account of each particular topic. Before jumping into action and establishing RS as an additional research method in one’s own laboratory, taking a look on the methodological reviews by Butler et al.28 (including concrete information about the general experimental setup and requirements for biological tissue), and Guo et al.462 (analysis of Raman data, machine learning algorithms) may prove useful. Upcoming applications of RS potentially aim for in vivo prediction of progression risk463 or employment of vibrational spectroscopy for detection of epileptogenic brain regions464. Advanced Raman techniques such as Spatially offset Raman Spectroscopy (SORS)465 may potentially permit live insight into tissue biochemistry of deeper brain structures. Alternatively, a future establishment of intraoperative Raman imaging (in particular it may even be performed in vivo466) will potentially allow fast detection of both histomorphological features and tumor genetics; therefore producing an integrated diagnosis467 at an early stage of the diagnostic workflow468. Extensive clinical studies aiming for approval of RS in neuroscience by regulatory authorities are still missing, even though a clinical need and a patient benefit has been demonstrated by a broad range of groups and laboratories. To translate promising results into clinical practice, several challenges should be considered. When vibrational spectroscopy is tested as a diagnostic method in a multicenter approach, experimental workflows of spectroscopic examination need to be standardized and facilitated; consensus within the spectroscopic community on a collaborative experimental setup and procedure prevents potential invariances due to different sample preparation protocols and hidden artifacts91. To maximize spectral output and enhance spectral intensity in a clinical setting, handheld probes / spectrometers with optimized design and in vivo parameters as well as a preferably low signal-to-noise and high signal-to-background ratio are currently under investigation by a growing number of companies stepping up their efforts in the interface of research and clinical implementation.117,469 Since the use of RS on FFPE tissue allows direct comparison with the diagnostic gold standard of histology, RS is expected to expand its applications in neuropathological diagnostics in the future. Upcoming studies will not only challenge the current use of RS on unstained FFPE tissue (is reliable diagnosis also achievable on H&E stained samples?) but also discuss a potential use of various Raman substrates in a cost-oriented manner470. To reduce the cost factor (id est expensive substrates such as CaF2 or low-E slides) future employment of RS on glass slides seems worthwhile; therefore, occurring autofluorescence during measurement needs to be addressed. Within that approach, the use of a certain excitation wavelength or the detection of only a small spectral wavenumber range have been proposed60,471. In this sense, Ibrahim et al.472 aimed to use glass as Raman substrates by employing a digital processing method. In the field of neurodegenerative diseases, a major and highly anticipated impact of RS could be the early and non-surgical diagnosis of disorders in a reproducible manner. Despite promising results, this application area is only beginning to develop. To maximize diagnostic reliability, a deeper understanding of Raman features and their corresponding biochemical origin in biofluids is key. Within the huge amount of obtained data, it remains necessary to address patient dependent spectral variation as well as variations related to a concrete experimental set up. Close cooperation between different research groups and ensured data share470 potentially accelerate the development towards clinical implementation. An exemplary success story of clinical translation was reported in the field of dermatology, where RS had already been established as a diagnostic method for early detection of skin cancer; a handheld device was commercially produced in Canada463,473,474. To speed up translation from research labs to commercialization and clinical use, several networks have been founded, e.g., International Society for Clinical Spectroscopy (ClirSpec, clirspec.org) and Raman4Clinics (raman4clinics.eu), all aiming for exchange of expertise and creation of research collaboration117. To conclude, it highly likely that RS will continue to evolve as a method in the intersection of applied biophysics and medicine – and potentially make its way deeper into the field of life science, such as detection of plastic in zebrafish brain homogenates as a result of exposure to nanoplastic475 and even more clinical applications. Where the journey will finally lead remains to be seen in the next years. Acknowledgements Figure 1 and Figure 2 were created with BioRender.com. MM thanks the FNR for funding support (FNR PEARL P16/BM/11192868 grant). Funding Luxembourg National Research Fond, FNR (FNR PEARL P16/BM/11192868 grant to M.M.) Conflicts of Interest We have no conflicts of interest to disclose. References 1. Hollon TC, Pandian B, Adapa AR, et al. Near real-time intraoperative brain tumor diagnosis using stimulated Raman histology and deep neural networks. Nat Med. 2020;26(1):52-58. https://doi.org/10.1038/s41591-019-0715-9 2. Devitt G, Howard K, Mudher A, Mahajan S. Raman Spectroscopy: An Emerging Tool in Neurodegenerative Disease Research and Diagnosis. ACS Chem Neurosci. 2018;9(3):404-420. https://doi.org/10.1021/acschemneuro.7b00413 3. Jermyn M, Mok K, Mercier J, et al. Intraoperative brain cancer detection with Raman spectroscopy in humans. Sci Transl Med. 2015;7(274):274ra19. https://doi.org/10.1126/scitranslmed.aaa2384 4. Segura-Uribe JJ, Farfán-García ED, Guerra-Araiza C, Ciprés-Flores FJ, García-dela Torre P, Soriano-Ursúa MA. Differences in brain regions of three mice strains identified by label-free micro-Raman. Spectrosc Lett. 2018;51(7):356-366. https://doi.org/10.1080/00387010.2018.1473883 5. Payne TD, Moody AS, Wood AL, Pimiento PA, Elliott JC, Sharma B. Raman spectroscopy and neuroscience: from fundamental understanding to disease diagnostics and imaging. Analyst. 2020;145(10):346 1-3480. https://doi.org/10.1039/D0AN00083C 6. Tashibu K. [Analysis of water content in rat brain using Raman spectroscopy]. No To Shinkei. 1990;42(10):999-1004. 7. Kitajima T, Tashibu K, Tani S, Mizuno A, Nakamura N. [Analysis of water content in young rats brain edema by Raman spectroscopy]. No To Shinkei. 1993;45(6):519-524. 8. Mizuno A, Hayashi T, Tashibu K, Maraishi S, Kawauchi K, Ozaki Y. Near-infrared FT-Raman spectra of the rat brain tissues. Neurosci Lett. 1992;141(1):47-52. https://doi.org/10.1016/0304-3940(92)90331-Z 9. Mizuno A, Kitajima H, Kawauchi K, Muraishi S, Ozaki Y. Near-infrared Fourier transform Raman spectroscopic study of human brain tissues and tumours. J Raman Spectrosc. 1994;25(1):25-29. https://doi.org/10.1002/jrs.1250250105 10. Pliss A, Kuzmin AN, Prasad PN, Mahajan SD. Mitochondrial Dysfunction: A Prelude to Neuropathogenesis of SARS-CoV-2. ACS Chem Neurosci. 2022;13(3):308-312. https://doi.org/10.1021/acschemneuro.1c00675 11. RAMAN C V, KRISHNAN KS. A New Type of Secondary Radiation. Nature. 1928;121(3048):501-502. https://doi.org/10.1038/121501c0 12. RAMAN C V. A Change of Wave-length in Light Scattering. Nature. 1928;121(3051):619-619. https://doi.org/10.1038/121619b0 13. Singh R. C. V. Raman and the Discovery of the Raman Effect. Phys Perspect. 2002;4(4):399-420. https://doi.org/10.1007/s000160200002 14. C. TM. Raman Spectra of Crystalline Lysozyme, Pepsin, and Alpha Chymotrypsin. Science (80- ). 1968;161(3836):68-69. https://doi.org/10.1126/science.161.3836.68 15. Lord RC, Yu NT. Laser-excited Raman spectroscopy of biomolecules. I. Native lysozyme and its constituent amino acids. J Mol Biol. 1970;50(2):509-524. https://doi.org/10.1016/0022-2836(70)90208-1 16. Antonio KA, Schultz ZD. Advances in Biomedical Raman Microscopy. Anal Chem. 2014;86(1):30-46. https://doi.org/10.1021/ac403640f 17. Vlasov A V, Maliar NL, Bazhenov S V, et al. Raman Scattering: From Structural Biology to Medical Applications. Crystals. 2020;10(1):38. https://doi.org/10.3390/cryst10010038 18. Carey PR. Biochemical Applications of Raman and Resonance Raman Spectroscopy. London, S.1-70: Academic Press; 1982. 19. Diem M, Mazur A, Lenau K, et al. Molecular pathology via IR and Raman spectral imaging. J Biophotonics. 2013;6(11-12):855-886. https://doi.org/10.1002/jbio.201300131 20. Auner GW, Koya SK, Huang C, et al. Applications of Raman spectroscopy in cancer diagnosis. Cancer Metastasis Rev. 2018;37(4):691-717. https://doi.org/10.1007/s10555-018-9770-9 21. Cialla-May D, Schmitt M, Popp J. 1. Theoretical principles of Raman spectroscopy. In: Popp J, Mayerhöfer T, eds. Micro-Raman Spectroscopy. De Gruyter; 2020:1-14. https://doi.org/10.1515/9783110515312-001 22. Popp J, Mayerhöfer T, eds. Micro-Raman Spectroscopy: Theory and Application. De Gruyter; 2020. https://doi.org/ https://doi.org/10.1515/9783110515312 23. Hu F, Shi L, Min W. Biological imaging of chemical bonds by stimulated Raman scattering microscopy. Nat Methods. 2019;16(9):830-842. https://doi.org/10.1038/s41592-019-0538-0 24. Shi L, Fung AA, Zhou A. Advances in stimulated Raman scattering imaging for tissues and animals. Quant Imaging Med Surg. 2021;11(3):1078-1101. https://doi.org/10.21037/qims-20-712 25. Evans CL, Xie XS. Coherent anti-Stokes Raman scattering microscopy: Chemical imaging for biology and medicine. Annu Rev Anal Chem. 2008;1(1):883-909. https://doi.org/10.1146/annurev.anchem.1.031207.112754 26. Zheng X-S, Jahn IJ, Weber K, Cialla-May D, Popp J. Label-free SERS in biological and biomedical applications: Recent progress, current challenges and opportunities. Spectrochim Acta Part A Mol Biomol Spectrosc. 2018;197:56-77. https://doi.org/10.1016/j.saa.2018.01.063 27. Synytsya A, Judexova M, Hoskovec D, Miskovicova M, Petruzelka L. Raman spectroscopy at different excitation wavelengths (1064, 785 and 532 nm) as a tool for diagnosis of colon cancer. J Raman Spectrosc. 2014;45(10):903-911. https://doi.org/10.1002/jrs.4581 28. Butler HJ, Ashton L, Bird B, et al. Using Raman spectroscopy to characterize biological materials. Nat Protoc. 2016;11(4):664-687. https://doi.org/10.1038/nprot.2016.036 29. Matousek P, Morris M. Emerging Raman Applications and Techniques in Biomedical and Pharmaceutical Fields. (Matousek P, Morris MD, eds.). Berlin Heidelberg, S. 1-24: Springer; 2010. https://doi.org/10.1007/978-3-642-02649-2 30. Raman images explained. https://www.renishaw.de/de/raman-images-explained--25810. Accessed November 14, 2021. 31. He R, Xu Y, Zhang L, et al. Dual-phase stimulated Raman scattering microscopy for real-time two-color imaging. Optica. 2017;4(1):44-47. https://doi.org/10.1364/OPTICA.4.000044 32. Zhang B, Sun M, Yang Y, et al. Rapid, large-scale stimulated Raman histology with strip mosaicing and dual-phase detection. Biomed Opt Express. 2018;9(6):2604-2613. https://doi.org/10.1364/BOE.9.002604 33. Wei L, Shen Y, Xu F, et al. Imaging Complex Protein Metabolism in Live Organisms by Stimulated Raman Scattering Microscopy with Isotope Labeling. ACS Chem Biol. 2015;10(3):901-908. https://doi.org/10.1021/cb500787b 34. Hu F, Lamprecht MR, Wei L, Morrison B, Min W. Bioorthogonal chemical imaging of metabolic activities in live mammalian hippocampal tissues with stimulated Raman scattering. Sci Rep. 2016;6(1):39660. https://doi.org/10.1038/srep39660 35. Shi L. Raman imaging of metabolic activities in brain. In: Proc.SPIE. Vol 11497. ; 2020. https://doi.org/10.1117/12.2571112 36. Lu F-K, Calligaris D, Olubiyi OI, et al. Label-Free Neurosurgical Pathology with Stimulated Raman Imaging. Cancer Res. 2016;76(12):3451-3462. https://doi.org/10.1158/0008-5472.CAN-16-0270 37. Pezzotti G. Raman spectroscopy in cell biology and microbiology. J Raman Spectrosc. 2021;52(12):2348-2443. https://doi.org/10.1002/jrs.6204 38. Czamara K, Majzner K, Pacia MZ, Kochan K, Kaczor A, Baranska M. Raman spectroscopy of lipids: A review. J Raman Spectrosc. 2015;46(1):4-20. https://doi.org/10.1002/jrs.4607 39. Rygula A, Majzner K, Marzec KM, Kaczor A, Pilarczyk M, Baranska M. Raman spectroscopy of proteins: A review. J Raman Spectrosc. 2013;44(8):1061-1076. https://doi.org/10.1002/jrs.4335 40. Wiercigroch E, Szafraniec E, Czamara K, et al. Raman and infrared spectroscopy of carbohydrates: A review. Spectrochim Acta Part A Mol Biomol Spectrosc. 2017;185:317-335. https://doi.org/10.1016/j.saa.2017.05.045 41. Wilkosz N, Czaja M, Seweryn S, et al. Molecular Spectroscopic Markers of Abnormal Protein Aggregation. Molecules. 2020;25(11). https://doi.org/10.3390/molecules25112498 42. Clemens G, Hands JR, Dorling KM, Baker MJ. Vibrational spectroscopic methods for cytology and cellular research. Analyst. 2014;139(18):4411-4444. https://doi.org/10.1039/C4AN00636D 43. Benevides JM, Overman SA, Thomas GJ. Raman Spectroscopy of Proteins. Curr Protoc Protein Sci. 2003;33(1):1-35. https://doi.org/10.1002/0471140864.ps1708s33 44. Kurouski D, Van Duyne RP, Lednev IK. Exploring the structure and formation mechanism of amyloid fibrils by Raman spectroscopy: a review. Analyst. 2015;140(15):4967-4980. https://doi.org/10.1039/C5AN00342C 45. Krafft C, Neudert L, Simat T, Salzer R. Near infrared Raman spectra of human brain lipids. Spectrochim Acta Part A Mol Biomol Spectrosc. 2005;61(7):1529-1535. https://doi.org/10.1016/j.saa.2004.11.017 46. Vedad J, Mojica E-RE, Desamero RZB. Raman Spectroscopic Discrimination of Estrogens. Vib Spectrosc. 2018;96:93-100. https://doi.org/10.1016/j.vibspec.2018.02.011 47. Pezzotti G, Horiguchi S, Boschetto F, et al. Raman Imaging of Individual Membrane Lipids and Deoxynucleoside Triphosphates in Living Neuronal Cells during Neurite Outgrowth. ACS Chem Neurosci. 2018;9(12):3038-3048. https://doi.org/10.1021/acschemneuro.8b00235 48. Gorelik VS, Krylov AS, Sverbil VP. Local Raman spectroscopy of DNA. Bull Lebedev Phys Inst. 2014;41(11):310-315. https://doi.org/10.3103/S1068335614110025 49. Lee HJ, Zhang D, Jiang Y, et al. Label-Free Vibrational Spectroscopic Imaging of Neuronal Membrane Potential. J Phys Chem Lett. 2017;8(9):1932-1936. https://doi.org/10.1021/acs.jpclett.7b00575 50. Movasaghi Z, Rehman S, Rehman IU. Raman spectroscopy of biological tissues. Appl Spectrosc Rev. 2007;42(5):493-541. https://doi.org/10.1080/05704920701551530 51. De Gelder J, De Gussem K, Vandenabeele P, Moens L. Reference database of Raman spectra of biological molecules. J Raman Spectrosc. 2007. https://doi.org/10.1002/jrs.1734 52. Edwards HGM. Spectra-Structure Correlations in Raman Spectroscopy. In: Handbook of Vibrational Spectroscopy. ; 2006. https://doi.org/10.1002/0470027320.s4103 53. Grasselli JG, Snavely MK, Bulkin BJ. Applications of Raman spectroscopy. Phys Rep. 1980;65(4):231-344. https://doi.org/10.1016/0370-1573(80)90065-4 54. Visser T, Van Der Maas JH. Systematic interpretation of Raman spectra of organic compounds. II-Ethers. J Raman Spectrosc. 1977;6(3):114-116. https://doi.org/10.1002/jrs.1250060303 55. Visser T, van der Maas JH. Systematic interpretation of Raman spectra of organic compounds. III—carbonyl compounds. J Raman Spectrosc. 1978;7(3):125-129. https://doi.org/10.1002/jrs.1250070304 56. Visser T, Van Der Maas JH. Systematic interpretation of Raman spectra of organic compounds. IV—nitrogen compounds. J Raman Spectrosc. 1978;7(5):278-281. https://doi.org/10.1002/jrs.1250070510 57. Vankeirsbilck T, Vercauteren A, Baeyens W, et al. Applications of Raman spectroscopy in pharmaceutical analysis. TrAC Trends Anal Chem. 2002;21(12):869-877. https://doi.org/10.1016/S0165-9936(02)01208-6 58. Malgorzata Baranska Jan Cz. Dobrowolski, Hartwig Schulz, Rafal Baranski, MR. Recent Advances in Raman Analysis of Plants: Alkaloids, Carotenoids, and Polyacetylenes. Curr Anal Chem. 2013;9(1):108-127. https://doi.org/http://dx.doi.org/10.2174/1573411011309010108 59. Fullwood LM, Griffiths D, Ashton K, et al. Effect of substrate choice and tissue type on tissue preparation for spectral histopathology by Raman microspectroscopy. Analyst. 2014;139(2):446-454. https://doi.org/10.1039/C3AN01832F 60. Kerr LT, Byrne HJ, Hennelly BM. Optimal choice of sample substrate and laser wavelength for Raman spectroscopic analysis of biological specimen. Anal Methods. 2015;7(12):5041-5052. https://doi.org/10.1039/C5AY00327J 61. Gee AR, O’Shea DC, Cummins HZ. Raman scattering and fluorescence in calcium fluoride. Solid State Commun. 1966;4(1):43-46. https://doi.org/10.1016/0038-1098(66)90102-5 62. Cui L, Butler HJ, Martin-Hirsch PL, Martin FL. Aluminium foil as a potential substrate for ATR-FTIR, transflection FTIR or Raman spectrochemical analysis of biological specimens. Anal Methods. 2016;8(3):481-487. https://doi.org/10.1039/C5AY02638E 63. Thomas P V, Ramakrishnan V, Vaidyan VK. Oxidation studies of aluminum thin films by Raman spectroscopy. Thin Solid Films. 1989;170(1):35-40. https://doi.org/10.1016/0040-6090(89)90619-6 64. Hou H-C, Banadaki YM, Basu S, Sharifi S. A Cost-Efficient Surface Enhanced Raman Spectroscopy (SERS) Molecular Detection Technique for Clinical Applications. J Electron Mater. 2018;47(9):5378-5385. https://doi.org/10.1007/s11664-018-6429-9 65. Shim MG, Wilson BC. The Effects of ex vivo Handling Procedures on the Near-Infrared Raman Spectra of Normal Mammalian Tissues. Photochem Photobiol. 1996;63(5):662-671. https://doi.org/10.1111/j.1751-1097.1996.tb05671.x 66. Ó Faoláin E, Hunter MB, Byrne JM, et al. A study examining the effects of tissue processing on human tissue sections using vibrational spectroscopy. Vib Spectrosc. 2005;38(1):121-127. https://doi.org/10.1016/j.vibspec.2005.02.013 67. Candefjord S, Ramser K, Lindahl OA. Effects of snap-freezing and near-infrared laser illumination on porcine prostate tissue as measured by Raman spectroscopy. Analyst. 2009;134(9):1815-1821. https://doi.org/10.1039/B820931F 68. Huang Z, McWilliams A, Lam S, et al. Effect of formalin fixation on the near-infrared Raman spectroscopy of normal and cancerous human bronchial tissues. Int J Oncol. 2003;23(3):649-655. https://doi.org/10.3892/ijo.23.3.649 69. Mariani MM, Lampen P, Popp J, Wood BR, Deckert V. Impact of fixation on in vitro cell culture lines monitored with Raman spectroscopy. Analyst. 2009;134(6):1154-1161. https://doi.org/10.1039/B822408K 70. Faoláin EÓ, Hunter MB, Byrne JM, et al. Raman spectroscopic evaluation of efficacy of current paraffin wax section dewaxing agents. J Histochem Cytochem. 2005;53(1):121-129. https://doi.org/10.1369/jhc.4A6536.2005 71. Draux F, Gobinet C, Sulé-Suso J, et al. Raman spectral imaging of single cancer cells: Probing the impact of sample fixation methods. Anal Bioanal Chem. 2010;397(7):2727-2737. https://doi.org/10.1007/s00216-010-3759-8 72. Galli R, Uckermann O, Koch E, Schackert G, Kirsch M, Steiner G. Effects of tissue fixation on coherent anti-Stokes Raman scattering images of brain. J Biomed Opt. 2013;19(7):1-8. https://doi.org/10.1117/1.JBO.19.7.071402 73. Chan JW, Taylor DS, Thompson DL. The effect of cell fixation on the discrimination of normal and leukemia cells with laser tweezers Raman spectroscopy. Biopolymers. 2009;91(2):132-139. https://doi.org/10.1002/bip.21094 74. Krishna CM, Sockalingum GD, Vadhiraja BM, et al. Vibrational spectroscopy studies of formalin-fixed cervix tissues. Biopolymers. 2007;85(3):214-221. https://doi.org/10.1002/bip.20631 75. Mian SA, Colley HE, Thornhill MH, Rehman I. Development of a Dewaxing Protocol for Tissue-Engineered Models of the Oral Mucosa Used for Raman Spectroscopic Analysis. Appl Spectrosc Rev. 2014;49(8):614-617. https://doi.org/10.1080/05704928.2014.882348 76. Hackett MJ, McQuillan JA, El-Assaad F, et al. Chemical alterations to murine brain tissue induced by formalin fixation: implications for biospectroscopic imaging and mapping studies of disease pathogenesis. Analyst. 2011;136(14):2941-2952. https://doi.org/10.1039/C0AN00269K 77. Mazur AI, Marcsisin EJ, Bird B, Miljković M, Diem M. Evaluating Different Fixation Protocols for Spectral Cytopathology, Part 1. Anal Chem. 2012;84(3):1259-1266. https://doi.org/10.1021/ac202046d 78. Mazur AI, Marcsisin EJ, Bird B, Miljković M, Diem M. Evaluating Different Fixation Protocols for Spectral Cytopathology, Part 2: Cultured Cells. Anal Chem. 2012;84(19):8265-8271. https://doi.org/10.1021/ac3017407 79. Stefanakis M, Lorenz A, Bartsch JW, et al. Formalin Fixation as Tissue Preprocessing for Multimodal Optical Spectroscopy Using the Example of Human Brain Tumour Cross Sections. Severcan F, ed. J Spectrosc. 2021;2021:1-14. https://doi.org/10.1155/2021/5598309 80. Ali SM, Bonnier F, Tfayli A, et al. Raman spectroscopic analysis of human skin tissue sections ex-vivo: evaluation of the effects of tissue processing and dewaxing. J Biomed Opt. 2013;18(6):61202. https://doi.org/10.1117/1.JBO.18.6.061202 81. Gaifulina R, Maher AT, Kendall C, et al. Label-free Raman spectroscopic imaging to extract morphological and chemical information from a formalin-fixed, paraffin-embedded rat colon tissue section. Int J Exp Pathol. 2016;97(4):337-350. https://doi.org/10.1111/iep.12194 82. Kirkby CJ, Gala de Pablo J, Tinkler-Hundal E, Wood HM, Evans SD, West NP. Developing a Raman spectroscopy-based tool to stratify patient response to pre-operative radiotherapy in rectal cancer. Analyst. 2021;146(2):581-589. https://doi.org/10.1039/d0an01803a 83. Lyng FM, Faoláin EÓ, Conroy J, et al. Vibrational spectroscopy for cervical cancer pathology, from biochemical analysis to diagnostic tool. Exp Mol Pathol. 2007;82(2):121-129. https://doi.org/10.1016/j.yexmp.2007.01.001 84. Tan KM, Herrington CS, Brown CTA. Discrimination of normal from pre-malignant cervical tissue by Raman mapping of de-paraffinized histological tissue sections. J Biophotonics. 2011;4(1-2):40-48. https://doi.org/10.1002/jbio.201000083 85. Rehman S, Movasaghi Z, Tucker AT, et al. Raman spectroscopic analysis of breast cancer tissues: identifying differences between normal, invasive ductal carcinoma and ductal carcinomain situ of the breast tissue. J Raman Spectrosc. 2007;38(10):1345-1351. https://doi.org/10.1002/jrs.1774 86. Ning T, Li H, Chen Y, Zhang B, Zhang F, Wang S. Raman spectroscopy based pathological analysis and discrimination of formalin fixed paraffin embedded breast cancer tissue. Vib Spectrosc. 2021;115:103260. https://doi.org/10.1016/j.vibspec.2021.103260 87. Lazaro-Pacheco D, Shaaban AM, Titiloye NA, Rehman S, Rehman IU. Elucidating the chemical and structural composition of breast cancer using Raman micro-spectroscopy. EXCLI J. 2021;20:1118-1132. https://doi.org/10.17179/excli2021-3962 88. Haka AS, Shafer-Peltier KE, Fitzmaurice M, Crowe J, Dasari RR, Feld MS. Identifying Microcalcifications in Benign and Malignant Breast Lesions by Probing Differences in Their Chemical Composition Using Raman Spectroscopy. Cancer Res. 2002;62(18):5375-5380. 89. Krishna CM, Sockalingum GD, Venteo L, et al. Evaluation of the suitability of ex vivo handled ovarian tissues for optical diagnosis by Raman microspectroscopy. Biopolymers. 2005;79(5):269-276. https://doi.org/10.1002/bip.20346 90. Devpura S, Thakur JS, Sarkar FH, Sakr WA, Naik VM, Naik R. Detection of benign epithelia, prostatic intraepithelial neoplasia, and cancer regions in radical prostatectomy tissues using Raman spectroscopy. Vib Spectrosc. 2010;53(2):227-232. https://doi.org/10.1016/j.vibspec.2010.03.009 91. Jermyn M, Desroches J, Aubertin K, et al. A review of Raman spectroscopy advances with an emphasis on clinical translation challenges in oncology. Phys Med Biol. 2016;61(23):R370-R400. https://doi.org/10.1088/0031-9155/61/23/R370 92. Jermyn M, Desroches J, Mercier J, et al. Neural networks improve brain cancer detection with Raman spectroscopy in the presence of operating room light artifacts. J Biomed Opt. 2016;21(9):094002. https://doi.org/10.1117/1.JBO.21.9.094002 93. Desroches J, Laurence A, Jermyn M, et al. Raman spectroscopy in microsurgery: impact of operating microscope illumination sources on data quality and tissue classification. Analyst. 2017;142(8):1185-1191. https://doi.org/10.1039/C6AN02061E 94. Bury D, Morais C, Ashton K, Dawson T, Martin F. Ex Vivo Raman Spectrochemical Analysis Using a Handheld Probe Demonstrates High Predictive Capability of Brain Tumour Status. Biosensors. 2019;9(2):49. https://doi.org/10.3390/bios9020049 95. Dallaire F, Picot F, Tremblay J-P, et al. Quantitative spectral quality assessment technique validated using intraoperative in vivo Raman spectroscopy measurements. J Biomed Opt. 2020;25(4):1-8. https://doi.org/10.1117/1.JBO.25.4.040501 96. Zhao J, Short MA, Braun TA, M.D. HL, M.D. DIM, Zeng H. Clinical Raman measurements under special ambient lighting illumination. J Biomed Opt. 2014;19(11):1-4. https://doi.org/10.1117/1.JBO.19.11.111609 97. Beleites C, Neugebauer U, Bocklitz T, Krafft C, Popp J. Sample size planning for classification models. Anal Chim Acta. 2013;760:25-33. https://doi.org/10.1016/j.aca.2012.11.007 98. Zhang L, Henson MJ. A Practical Algorithm to Remove Cosmic Spikes in Raman Imaging Data for Pharmaceutical Applications. Appl Spectrosc. 2007;61(9):1015-1020. http://opg.optica.org/as/abstract.cfm?URI=as-61-9-1015. 99. Barton SJ, Hennelly BM. An Algorithm for the Removal of Cosmic Ray Artifacts in Spectral Data Sets. Appl Spectrosc. 2019;73(8):893-901. https://doi.org/10.1177/0003702819839098 100. Bowie BT, Chase DB, Lewis IR, Griffiths PR. Anomalies and Artifacts in Raman Spectroscopy. In: Handbook of Vibrational Spectroscopy. In: Griffiths PR, ed. Handbook of Vibrational Spectroscopy. Chichester, S. 2355-2378: John Wiley & Sons; 2006:2355-2378. https://doi.org/10.1002/9780470027325.s3103 101. Zhao J, Lui H, McLean DI, Zeng H. Automated autofluorescence background subtraction algorithm for biomedical Raman spectroscopy. Appl Spectrosc. 2007;61(11):1225-1232. https://doi.org/10.1366/000370207782597003 102. Cao A, Pandya AK, Serhatkulu GK, et al. A robust method for automated background subtraction of tissue fluorescence. J Raman Spectrosc. 2007;38(9):1199-1205. https://doi.org/10.1002/jrs.1753 103. Smith ZJ, Huser TR, Wachsmann-Hogiu S. Raman scattering in pathology. Anal Cell Pathol. 2012;35(3):145-163. https://doi.org/10.3233/ACP-2011-0048 104. Lieber CA, Mahadevan-Jansen A. Automated method for subtraction of fluorescence from biological Raman spectra. Appl Spectrosc. 2003;57(11):1363-1367. https://doi.org/10.1366/000370203322554518 105. Trevisan J, Angelov PP, Carmichael PL, Scott AD, Martin FL. Extracting biological information with computational analysis of Fourier-transform infrared (FTIR) biospectroscopy datasets: current practices to future perspectives. Analyst. 2012;137(14):3202-3215. https://doi.org/10.1039/C2AN16300D 106. Savitzky A, Golay MJE. Smoothing and Differentiation of Data by Simplified Least Squares Procedures. Anal Chem. 1964;36(8):1627-1639. https://doi.org/10.1021/ac60214a047 107. Lasch P. Spectral pre-processing for biomedical vibrational spectroscopy and microspectroscopic imaging. Chemom Intell Lab Syst. 2012;117:100-114. https://doi.org/10.1016/j.chemolab.2012.03.011 108. Menges F. "Spectragryph - optical spectroscopy software”, Version 1.2.14, 2020, http://www.effemm2.de/spectragryph/. 109. Jollife IT, Cadima J. Principal component analysis: A review and recent developments. Philos Trans R Soc A Math Phys Eng Sci. 2016;374(2065). https://doi.org/10.1098/rsta.2015.0202 110. Olson RS, Cava W La, Mustahsan Z, Varik A, Moore JH. Data-driven advice for applying machine learning to bioinformatics problems. Pac Symp Biocomput. 2018;23:192-203. https://pubmed.ncbi.nlm.nih.gov/29218881. 111. Meza Ramirez CA, Greenop M, Ashton L, Rehman I ur. Applications of machine learning in spectroscopy. Appl Spectrosc Rev. 2021;56(8-10):733-763. https://doi.org/10.1080/05704928.2020.1859525 112. Ralbovsky NM, Lednev IK. Towards development of a novel universal medical diagnostic method: Raman spectroscopy and machine learning. Chem Soc Rev. 2020;49(20):7428-7453. https://doi.org/10.1039/D0CS01019G 113. Hajian-Tilaki K. Receiver Operating Characteristic (ROC) Curve Analysis for Medical Diagnostic Test Evaluation. Casp J Intern Med. 2013;4(2):627-635. https://pubmed.ncbi.nlm.nih.gov/24009950. 114. ZHANG LEI, SHEALEY P, HAYDEN L, XIE C, LI Y-Q. STUDY OF BRAIN CELLS BY NEAR-INFRARED RAMAN SPECTROSCOPY. J North Carolina Acad Sci. 2005;121(1):41-44. http://www.jstor.org/stable/24336004. 115. Banerjee H nath, Zhang L. Deciphering the finger Prints of Brain Cancer Astrocytoma in comparison to Astrocytes by using near infrared Raman Spectroscopy. Mol Cell Biochem. 2007;295(1):237-240. https://doi.org/10.1007/s11010-006-9278-4 116. Hollon T, Orringer DA. Label-free brain tumor imaging using Raman-based methods. J Neurooncol. 2021;151(3):393-402. https://doi.org/10.1007/s11060-019-03380-z 117. Santos IP, Barroso EM, Bakker Schut TC, et al. Raman spectroscopy for cancer detection and cancer surgery guidance: translation to the clinics. Analyst. 2017;142(17):3025-3047. https://doi.org/10.1039/C7AN00957G 118. Iturrioz-Rodríguez N, De Pasquale D, Fiaschi P, Ciofani G. Discrimination of glioma patient-derived cells from healthy astrocytes by exploiting Raman spectroscopy. Spectrochim Acta A Mol Biomol Spectrosc. 2022;269:120773. https://doi.org/10.1016/j.saa.2021.120773 119. Aguiar RP, Silveira LJ, Falcão ET, Pacheco MTT, Zângaro RA, Pasqualucci CA. Discriminating neoplastic and normal brain tissues in vitro through Raman spectroscopy: a principal components analysis classification model. Photomed Laser Surg. 2013;31(12):595-604. https://doi.org/10.1089/pho.2012.3460 120. DePaoli D, Lemoine É, Ember K, et al. Rise of Raman spectroscopy in neurosurgery: a review. J Biomed Opt. 2020;25(05):050901. https://doi.org/10.1117/1.JBO.25.5.050901 121. Broadbent B, Tseng J, Kast R, et al. Shining light on neurosurgery diagnostics using Raman spectroscopy. J Neurooncol. 2016;130(1):1-9. https://doi.org/10.1007/s11060-016-2223-9 122. Brusatori M, Auner G, Noh T, Scarpace L, Broadbent B, Kalkanis SN. Intraoperative Raman Spectroscopy. Neurosurg Clin N Am. 2017;28(4):633-652. https://doi.org/10.1016/j.nec.2017.05.014 123. Shu C, Zheng W, Wang Z, Yu C, Huang Z. Development and characterization of a disposable submillimeter fiber optic Raman needle probe for enhancing real-time in vivo deep tissue and biofluids Raman measurements. Opt Lett. 2021;46(20):5197-5200. https://doi.org/10.1364/OL.438713 124. Brahimaj BC, Kochanski RB, Pearce JJ, et al. Structural and Functional Imaging in Glioma Management. Neurosurgery. 2021;88(2):211-221. https://doi.org/10.1093/neuros/nyaa360 125. Hollon T, Stummer W, Orringer D, Suero Molina E. Surgical Adjuncts to Increase the Extent of Resection: Intraoperative MRI, Fluorescence, and Raman Histology. Neurosurg Clin N Am. 2019;30(1):65-74. https://doi.org/10.1016/j.nec.2018.08.012 126. Luther E, Matus A, Eichberg DG, Shah AH, Ivan M. Stimulated Raman Histology for Intraoperative Guidance in the Resection of a Recurrent Atypical Spheno-orbital Meningioma: A Case Report and Review of Literature. Cureus. 2019;11(10):e5905. https://doi.org/10.7759/cureus.5905 127. Yuan Y, Shah N, Almohaisin MI, Saha S, Lu F. Assessing fatty acid-induced lipotoxicity and its therapeutic potential in glioblastoma using stimulated Raman microscopy. Sci Rep. 2021;11(1):7422. https://doi.org/10.1038/s41598-021-86789-9 128. Ricci M, Ragonese F, Gironi B, et al. Glioblastoma single-cell microRaman analysis under stress treatments. Sci Rep. 2018;8(1):7979. https://doi.org/10.1038/s41598-018-26356-x 129. Kopec M, Imiela A, Abramczyk H. Monitoring glycosylation metabolism in brain and breast cancer by Raman imaging. Sci Rep. 2019;9(1):166. https://doi.org/10.1038/s41598-018-36622-7 130. Abramczyk H, Surmacki JM, Brozek-Pluska B, Kopec M. Revision of Commonly Accepted Warburg Mechanism of Cancer Development: Redox-Sensitive Mitochondrial Cytochromes in Breast and Brain Cancers by Raman Imaging. Cancers (Basel). 2021;13(11). https://doi.org/10.3390/cancers13112599 131. Hollon T, Lewis S, Freudiger CW, Sunney Xie X, Orringer DA. Improving the accuracy of brain tumor surgery via Raman-based technology. Neurosurg Focus FOC. 2016;40(3):E9. https://doi.org/10.3171/2015.12.FOCUS15557 132. Soltani S, Guang Z, Zhang Z, Olson J, Robles F. Label-free detection of brain tumors in a 9L gliosarcoma rat model using stimulated Raman scattering-spectroscopic optical coherence tomography. J Biomed Opt. 2021;26(7). https://doi.org/10.1117/1.JBO.26.7.076004 133. Ji M, Orringer DA, Freudiger CW, et al. Rapid, Label-Free Detection of Brain Tumors with Stimulated Raman Scattering Microscopy. Sci Transl Med. 2013;5(201):201ra119-201ra119. https://doi.org/10.1126/scitranslmed.3005954 134. Pope I, Masia F, Ewan K, et al. Identifying subpopulations in multicellular systems by quantitative chemical imaging using label-free hyperspectral CARS microscopy. Analyst. 2021;146(7):2277-2291. https://doi.org/10.1039/d0an02381g 135. Gao X, Yue Q, Liu Z, et al. Guiding Brain-Tumor Surgery via Blood-Brain-Barrier-Permeable Gold Nanoprobes with Acid-Triggered MRI/SERRS Signals. Adv Mater. 2017;29(21). https://doi.org/10.1002/adma.201603917 136. Han L, Duan W, Li X, et al. Surface-Enhanced Resonance Raman Scattering-Guided Brain Tumor Surgery Showing Prognostic Benefit in Rat Models. ACS Appl Mater Interfaces. 2019;11(17):15241-15250. https://doi.org/10.1021/acsami.9b00227 137. Uckermann O, Galli R, Tamosaityte S, et al. Label-Free Delineation of Brain Tumors by Coherent Anti-Stokes Raman Scattering Microscopy in an Orthotopic Mouse Model and Human Glioblastoma. PLoS One. 2014;9(9):e107115. https://doi.org/10.1371/journal.pone.0107115. 138. Kast R, Auner G, Yurgelevic S, et al. Identification of regions of normal grey matter and white matter from pathologic glioblastoma and necrosis in frozen sections using Raman imaging. J Neurooncol. 2015;125(2):287-295. https://doi.org/10.1007/s11060-015-1929-4 139. Kalkanis SN, Kast RE, Rosenblum ML, et al. Raman spectroscopy to distinguish grey matter, necrosis, and glioblastoma multiforme in frozen tissue sections. J Neurooncol. 2014;116(3):477-485. https://doi.org/10.1007/s11060-013-1326-9 140. Koljenović S, Schut TCB, Wolthuis R, et al. Raman spectroscopic characterization of porcine brain tissue using a single fiber-optic probe. Anal Chem. 2007;79(2):557-564. https://doi.org/10.1021/ac0616512 PM - 17222020 M4 – Citavi 141. DePaoli DT, Lapointe N, Messaddeq Y, Parent M, Côté DC. Intact primate brain tissue identification using a completely fibered coherent Raman spectroscopy system. Neurophotonics. 2018;5(3):35005. https://doi.org/10.1117/1.NPh.5.3.035005 142. Buttolph ML, Mejooli MA, Sidorenko P, Eom C-Y, Schaffer CB, Wise FW. Synchronously pumped Raman laser for simultaneous degenerate and nondegenerate two-photon microscopy. Biomed Opt Express. 2021;12(4):2496-2507. https://doi.org/10.1364/BOE.421647 143. Daković M, Stojiljković AS, Bajuk-Bogdanović D, et al. Profiling differences in chemical composition of brain structures using Raman spectroscopy. Talanta. 2013;117:133-138. https://doi.org/10.1016/j.talanta.2013.08.058 144. Santos LF, Wolthuis R, Koljenović S, Almeida RM, Puppels GJ. Fiber-Optic Probes for in Vivo Raman Spectroscopy in the High-Wavenumber Region. Anal Chem. 2005;77(20):6747-6752. https://doi.org/10.1021/ac0505730 145. Sajid J, Elhaddaoui A, Turrell S. Fourier Transform Vibrational Spectroscopic Analysis of Human Cerebral Tissue. J Raman Spectrosc. 1997;28(2-3):165-169. https://doi.org/10.1002/(SICI)1097-4555(199702)28:2/3<165::AID-JRS76>3.0.CO;2-K 146. Zięba-Palus J, Wesełucha-Birczyńska A, Sacharz J, et al. 2D correlation Raman microspectroscopy of chosen parts of rat’s brain tissue. J Mol Struct. 2017;1147:310-316. https://doi.org/10.1016/j.molstruc.2017.06.117 147. Meyer T, Bergner N, Bielecki C, et al. Nonlinear microscopy, infrared, and Raman microspectroscopy for brain tumor analysis. J Biomed Opt. 2011;16(2):21113. https://doi.org/10.1117/1.3533268 148. Guo T, Ding F, Li D, Zhang W, Cao L, Liu Z. Full-Scale Label-Free Surface-Enhanced Raman Scattering Analysis of Mouse Brain Using a Black Phosphorus-Based Two-Dimensional Nanoprobe. Appl Sci. 2019;9(3). https://doi.org/10.3390/app9030398 149. Riva M, Sciortino T, Secoli R, et al. Glioma biopsies classification using raman spectroscopy and machine learning models on fresh tissue samples. Cancers (Basel). 2021;13(5):1-14. https://doi.org/10.3390/cancers13051073 150. Depciuch J, Tołpa B, Witek P, et al. Raman and FTIR spectroscopy in determining the chemical changes in healthy brain tissues and glioblastoma tumor tissues. Spectrochim Acta - Part A Mol Biomol Spectrosc. 2020. https://doi.org/10.1016/j.saa.2019.117526 151. Baria E, Pracucci E, Pillai V, Pavone FS, Ratto GM, Cicchi R. In vivo detection of murine glioblastoma through Raman and reflectance fiber-probe spectroscopies. Neurophotonics. 2020;7(4):45010. https://doi.org/10.1117/1.NPh.7.4.045010 152. Kowalska AA, Berus S, Szleszkowski Ł, et al. Brain tumour homogenates analysed by surface-enhanced Raman spectroscopy: Discrimination among healthy and cancer cells. Spectrochim Acta Part A Mol Biomol Spectrosc. 2020;231:117769. https://doi.org/10.1016/j.saa.2019.117769 153. Köhler M, Machill S, Salzer R, Krafft C. Characterization of lipid extracts from brain tissue and tumors using Raman spectroscopy and mass spectrometry. Anal Bioanal Chem. 2009;393(5):1513-1520. https://doi.org/10.1007/s00216-008-2592-9 154. Jelke F, Mirizzi G, Borgmann FK, et al. Intraoperative discrimination of native meningioma and dura mater by Raman spectroscopy. Sci Rep. 2021;11(1):23583. https://doi.org/10.1038/s41598-021-02977-7 155. Koljenović S, Schut TB, Vincent A, Kros JM, Puppels GJ. Detection of Meningioma in Dura Mater by Raman Spectroscopy. Anal Chem. 2005;77(24):7958-7965. https://doi.org/10.1021/ac0512599 156. Di L, Eichberg DG, Park YJ, et al. Rapid Intraoperative Diagnosis of Meningiomas using Stimulated Raman Histology. World Neurosurg. 2021;150:108-116. https://doi.org/10.1016/j.wneu.2021.02.097 157. Aydin O, Altaş M, Kahraman M, Bayrak OF, Culha M. Differentiation of healthy brain tissue and tumors using surface-enhanced Raman scattering. Appl Spectrosc. 2009;63(10):1095-1100. https://doi.org/10.1366/000370209789553219 158. Leslie DG, Kast RE, Poulik JM, et al. Identification of Pediatric Brain Neoplasms Using Raman Spectroscopy. Pediatr Neurosurg. 2012;48(2):109-117. https://doi.org/10.1159/000343285 159. Gajjar K, Heppenstall LD, Pang W, et al. Diagnostic segregation of human brain tumours using Fourier-transform infrared and/or Raman spectroscopy coupled with discriminant analysis. Anal Methods. 2013;5(1):89-102. https://doi.org/10.1039/C2AY25544H 160. Galli R, Meinhardt M, Koch E, et al. Rapid Label-Free Analysis of Brain Tumor Biopsies by Near Infrared Raman and Fluorescence Spectroscopy—A Study of 209 Patients. Front Oncol. 2019;9:1165. https://doi.org/10.3389/fonc.2019.01165 161. Krafft C, Sobottka SB, Schackert G, Salzer R. Near infrared Raman spectroscopic mapping of native brain tissue and intracranial tumors. Analyst. 2005;130(7):1070-1077. https://doi.org/10.1039/B419232J 162. Aguiar RP, Falcão ET, Pasqualucci CA, Silveira L. Use of Raman spectroscopy to evaluate the biochemical composition of normal and tumoral human brain tissues for diagnosis. Lasers Med Sci. 2020. https://doi.org/10.1007/s10103-020-03173-1 163. Zhou Y, Liu C-H, Sun Y, et al. Human brain cancer studied by resonance Raman spectroscopy. J Biomed Opt. 2012;17(11):116021. https://doi.org/10.1117/1.JBO.17.11.116021 164. Kopec M, Błaszczyk M, Radek M, Abramczyk H. Raman imaging and statistical methods for analysis various type of human brain tumors and breast cancers. Spectrochim Acta Part A Mol Biomol Spectrosc. 2021;262:120091. https://doi.org/10.1016/j.saa.2021.120091 165. Anna I, Bartosz P, Lech P, Halina A. Novel strategies of Raman imaging for brain tumor research. Oncotarget. 2017;8(49):85290-85310. https://doi.org/10.18632/oncotarget.19668 166. Bury D, Morais CLM, Martin FL, et al. Discrimination of fresh frozen non-tumour and tumour brain tissue using spectrochemical analyses and a classification model. Br J Neurosurg. 2020;34(1):40-45. https://doi.org/10.1080/02688697.2019.1679352 167. Bergner N, Bocklitz T, Romeike BFM, et al. Identification of primary tumors of brain metastases by Raman imaging and support vector machines. Chemom Intell Lab Syst. 2012;117:224-232. https://doi.org/10.1016/j.chemolab.2012.02.008 168. Bergner N, Romeike BFM, Reichart R, Kalff R, Krafft C, Popp J. Raman and FTIR Microspectroscopy for Detection of Brain Metastasis. In: Clinical and Biomedical Spectroscopy and Imaging II. Optical Society of America; 2011:80870X. https://doi.org/10.1364/ECBO.2011.80870X 169. Krafft C, Sobottka SB, Schackert G, Salzer R. Raman and infrared spectroscopic mapping of human primary intracranial tumors: a comparative study. J Raman Spectrosc. 2006;37(1-3):367-375. https://doi.org/10.1002/jrs.1450 170. Zhang Q, Yun KK, Wang H, Yoon SW, Lu F, Won D. Automatic cell counting from stimulated Raman imaging using deep learning. PLoS One. 2021;16(7):e0254586. https://doi.org/10.1371/journal.pone.0254586. 171. Koljenović S, Choo-Smith L-P, Bakker Schut TC, Kros JM, van den Berge HJ, Puppels GJ. Discriminating vital tumor from necrotic tissue in human glioblastoma tissue samples by Raman spectroscopy. Lab Invest. 2002;82(10):1265-1277. https://doi.org/10.1097/01.lab.0000032545.96931.b8 172. Krafft C, Belay B, Bergner N, et al. Advances in optical biopsy--correlation of malignancy and cell density of primary brain tumors using Raman microspectroscopic imaging. Analyst. 2012;137(23):5533-5537. https://doi.org/10.1039/c2an36083g PM - 23050263 M4 - Citavi 173. Kast RE, Auner GW, Rosenblum ML, et al. Raman molecular imaging of brain frozen tissue sections. J Neurooncol. 2014;120(1):55-62. https://doi.org/10.1007/s11060-014-1536-9 174. Amharref N, Beljebbar A, Dukic S, et al. Discriminating healthy from tumor and necrosis tissue in rat brain tissue samples by Raman spectral imaging. Biochim Biophys Acta - Biomembr. 2007;1768(10):2605-2615. https://doi.org/10.1016/j.bbamem.2007.06.032 175. Bae K, Xin L, Zheng W, Tang C, Ang B-T, Huang Z. Mapping the Intratumoral Heterogeneity in Glioblastomas with Hyperspectral Stimulated Raman Scattering Microscopy. Anal Chem. 2021;93(4):2377-2384. https://doi.org/10.1021/acs.analchem.0c04262 176. Eichberg DG, Shah AH, Di L, et al. Stimulated Raman histology for rapid and accurate intraoperative diagnosis of CNS tumors: Prospective blinded study. J Neurosurg. 2021;134(1):137-143. https://doi.org/10.3171/2019.9.JNS192075 177. Neidert N, Straehle J, Erny D, et al. Stimulated Raman histology in the neurosurgical workflow of a major European neurosurgical center — part A. Neurosurg Rev. 2021. https://doi.org/10.1007/s10143-021-01712-0 178. Yang Y, Chen L, Ji M. Stimulated Raman scattering microscopy for rapid brain tumor histology. J Innov Opt Health Sci. 2017;10(05):1730010. https://doi.org/10.1142/S1793545817300105 179. Lee M, Herrington CS, Ravindra M, et al. Recent advances in the use of stimulated Raman scattering in histopathology. Analyst. 2021;146(3):789-802. https://doi.org/10.1039/D0AN01972K 180. Hollon TC, Lewis S, Pandian B, et al. Rapid Intraoperative Diagnosis of Pediatric Brain Tumors Using Stimulated Raman Histology. Cancer Res. 2018;78(1):278-289. https://doi.org/10.1158/0008-5472.CAN-17-1974 181. Orringer DA, Pandian B, Niknafs YS, et al. Rapid intraoperative histology of unprocessed surgical specimens via fibre-laser-based stimulated Raman scattering microscopy. Nat Biomed Eng. 2017. https://doi.org/10.1038/s41551-016-0027 182. Jiang C, Bhattacharya A, Linzey JR, et al. Rapid Automated Analysis of Skull Base Tumor Specimens Using Intraoperative Optical Imaging and Artificial Intelligence. Neurosurgery. 2022;90(6). https://journals.lww.com/neurosurgery/Fulltext/2022/06000/Rapid_Automated_Analysis_of_Skull_Base_Tumor.14.aspx. 183. Straehle J, Erny D, Neidert N, et al. Neuropathological interpretation of stimulated Raman histology images of brain and spine tumors: part B. Neurosurg Rev. December 2021. https://doi.org/10.1007/s10143-021-01711-1 184. Di L, Eichberg DG, Huang K, et al. Stimulated Raman Histology for Rapid Intraoperative Diagnosis of Gliomas. World Neurosurg. 2021;150:e135-e143. https://doi.org/10.1016/j.wneu.2021.02.122 185. Shin KS, Francis AT, Hill AH, et al. Intraoperative assessment of skull base tumors using stimulated Raman scattering microscopy. Sci Rep. 2019;9(1):20392. https://doi.org/10.1038/s41598-019-56932-8 186. Wolthuis R, van Aken M, Fountas K, Robinson, Bruining HA, Puppels GJ. Determination of Water Concentration in Brain Tissue by Raman Spectroscopy. Anal Chem. 2001;73(16):3915-3920. https://doi.org/10.1021/ac0101306 187. Hollon TC, Pandian B, Urias E, et al. Rapid, label-free detection of diffuse glioma recurrence using intraoperative stimulated Raman histology and deep neural networks. Neuro Oncol. 2021;23(1):144-155. https://doi.org/10.1093/neuonc/noaa162 188. Kircher MF, de la Zerda A, Jokerst J V, et al. A brain tumor molecular imaging strategy using a new triple-modality MRI-photoacoustic-Raman nanoparticle. Nat Med. 2012;18(5):829-834. https://doi.org/10.1038/nm.2721 189. Hubbard TJE, Shore A, Stone N. Raman spectroscopy for rapid intra-operative margin analysis of surgically excised tumour specimens. Analyst. 2019;144(22):6479-6496. https://doi.org/10.1039/C9AN01163C 190. Daoust F, Nguyen T, Orsini P, et al. Handheld macroscopic Raman spectroscopy imaging instrument for machine-learning-based molecular tissue margins characterization. J Biomed Opt. 2021;26(2). https://doi.org/10.1117/1.JBO.26.2.022911 191. Pekmezci M, Morshed RA, Chunduru P, et al. Detection of glioma infiltration at the tumor margin using quantitative stimulated Raman scattering histology. Sci Rep. 2021;11(1):12162. https://doi.org/10.1038/s41598-021-91648-8 192. Neuschmelting V, Harmsen S, Beziere N, et al. Dual-Modality Surface-Enhanced Resonance Raman Scattering and Multispectral Optoacoustic Tomography Nanoparticle Approach for Brain Tumor Delineation. Small. 2018;14(23):e1800740. https://doi.org/10.1002/smll.201800740 193. Duan W, Yue Q, Liu Y, et al. A pH ratiometrically responsive surface enhanced resonance Raman scattering probe for tumor acidic margin delineation and image-guided surgery. Chem Sci. 2020;11(17):4397-4402. https://doi.org/10.1039/D0SC00844C 194. Jin Z, Yue Q, Duan W, et al. Intelligent SERS Navigation System Guiding Brain Tumor Surgery by Intraoperatively Delineating the Metabolic Acidosis. Adv Sci (Weinheim, Baden-Wurttemberg, Ger. January 2022:e2104935. https://doi.org/10.1002/advs.202104935 195. Galli R, Uckermann O, Temme A, et al. Assessing the efficacy of coherent anti-Stokes Raman scattering microscopy for the detection of infiltrating glioblastoma in fresh brain samples. J Biophotonics. 2017;10(3):404-414. https://doi.org/10.1002/jbio.201500323 196. Ji M, Lewis S, Camelo-Piragua S, et al. Detection of human brain tumor infiltration with quantitative stimulated Raman scattering microscopy. Sci Transl Med. 2015;7(309):309ra163-309ra163. https://doi.org/10.1126/scitranslmed.aab0195 197. Tanahashi K, Natsume A, Ohka F, et al. Assessment of tumor cells in a mouse model of diffuse infiltrative glioma by Raman spectroscopy. Biomed Res Int. 2014;2014:860241. https://doi.org/10.1155/2014/860241 198. Jermyn M, Desroches J, Mercier J, et al. Raman spectroscopy detects distant invasive brain cancer cells centimeters beyond MRI capability in humans. Biomed Opt Express. 2016;7(12):5129-5137. https://doi.org/10.1364/boe.7.005129 199. Beljebbar A, Dukic S, Amharref N, Manfait M. Ex vivo and in vivo diagnosis of C6 glioblastoma development by Raman spectroscopy coupled to a microprobe. Anal Bioanal Chem. 2010;398(1):477-487. https://doi.org/10.1007/s00216-010-3910-6 200. Bae K, Zheng W, Lin K, et al. Epi-Detected Hyperspectral Stimulated Raman Scattering Microscopy for Label-Free Molecular Subtyping of Glioblastomas. Anal Chem. 2018;90(17):10249-10255. https://doi.org/10.1021/acs.analchem.8b01677 201. Lemoine É, Dallaire F, Yadav R, et al. Feature engineering applied to intraoperative in vivo Raman spectroscopy sheds light on molecular processes in brain cancer: a retrospective study of 65 patients. Analyst. 2019;144(22):6517-6532. https://doi.org/10.1039/c9an01144g 202. Livermore LJ, Isabelle M, Bell IM, et al. Raman spectroscopy to differentiate between fresh tissue samples of glioma and normal brain: A comparison with 5-ALA-induced fluorescence-guided surgery. J Neurosurg. 2021;135(2):469-479. https://doi.org/10.3171/2020.5.JNS20376 203. Kairdolf BA, Bouras A, Kaluzova M, et al. Intraoperative Spectroscopy with Ultrahigh Sensitivity for Image-Guided Surgery of Malignant Brain Tumors. Anal Chem. 2016;88(1):858-867. https://doi.org/10.1021/acs.analchem.5b03453 204. Livermore LJ, Isabelle M, Bell I Mac, et al. Rapid intraoperative molecular genetic classification of gliomas using Raman spectroscopy. Neuro-Oncology Adv. 2019;1(1):vdz008. https://doi.org/10.1093/noajnl/vdz008 205. Sciortino T, Secoli R, D’amico E, et al. Raman spectroscopy and machine learning for idh genotyping of unprocessed glioma biopsies. Cancers (Basel). 2021;13(16):1-13. https://doi.org/10.3390/cancers13164196 206. Uckermann O, Yao W, Juratli TA, et al. IDH1 mutation in human glioma induces chemical alterations that are amenable to optical Raman spectroscopy. J Neurooncol. 2018;139(2):261-268. https://doi.org/10.1007/s11060-018-2883-8 207. Bukva M, Dobra G, Gomez-Perez J, et al. Raman Spectral Signatures of Serum-Derived Extracellular Vesicle-Enriched Isolates May Support the Diagnosis of CNS Tumors. Cancers . 2021;13(6). https://doi.org/10.3390/cancers13061407 208. Abramczyk H, Brozek-Pluska B, Kopec M, Surmacki J, Błaszczyk M, Radek M. Redox Imbalance and Biochemical Changes in Cancer by Probing Redox-Sensitive Mitochondrial Cytochromes in Label-Free Visible Resonance Raman Imaging. Cancers (Basel). 2021;13(5). https://doi.org/10.3390/cancers13050960 209. Giardina G, Micko A, Bovenkamp D, et al. Morpho-Molecular Metabolic Analysis and Classification of Human Pituitary Gland and Adenoma Biopsies Based on Multimodal Optical Imaging. Cancers (Basel). 2021;13(13). https://doi.org/10.3390/cancers13133234 210. Abramczyk H, Imiela A, Surmacki J. Novel strategies of Raman imaging for monitoring intracellular retinoid metabolism in cancer cells. J Mol Liq. 2021;334:116033. https://doi.org/10.1016/j.molliq.2021.116033 211. Nair JB, Mohapatra S, Joseph MM, et al. Tracking the Footprints of Paclitaxel Delivery and Mechanistic Action via SERS Trajectory in Glioblastoma Cells. ACS Biomater Sci Eng. 2020;6(9):5254-5263. https://doi.org/10.1021/acsbiomaterials.0c00717 212. Manciu FS, Guerrero J, Bennet KE, et al. Assessing Nordihydroguaiaretic Acid Therapeutic Effect for Glioblastoma Multiforme. Sensors (Basel). 2022;22(7). https://doi.org/10.3390/s22072643 213. Li J, Wang C, Yao Y, et al. Label-free discrimination of glioma brain tumors in different stages by surface enhanced Raman scattering. Talanta. 2020;216:120983. https://doi.org/10.1016/j.talanta.2020.120983 214. Zhou Y, Liu C-H, Wu B, et al. Optical biopsy identification and grading of gliomas using label-free visible resonance Raman spectroscopy. J Biomed Opt. 2019;24(09):095001. https://doi.org/10.1117/1.JBO.24.9.095001 215. Morais CLM, Lilo T, Ashton KM, et al. Determination of meningioma brain tumour grades using Raman microspectroscopy imaging. Analyst. 2019;144(23):7024-7031. https://doi.org/10.1039/C9AN01551E 216. Lilo T, Morais CLM, Ashton KM, et al. Raman hyperspectral imaging coupled to three-dimensional discriminant analysis: Classification of meningiomas brain tumour grades. Spectrochim Acta Part A Mol Biomol Spectrosc. 2022;273:121018. https://doi.org/10.1016/j.saa.2022.121018 217. Zhang L, Zhou Y, Wu B, et al. Intraoperative detection of human meningioma using a handheld visible resonance Raman analyzer. Lasers Med Sci. 2021. https://doi.org/10.1007/s10103-021-03390-2 218. Banerjee HN, Banerji A, Banerjee AN, et al. Deciphering the Finger Prints of Brain Cancer Glioblastoma Multiforme from Four Different Patients by Using Near Infrared Raman Spectroscopy. J Cancer Sci Ther. 2015;7(2):44-47. https://doi.org/10.4172/1948-5956.1000323 219. Bergner N, Medyukhina A, Geiger KD, et al. Hyperspectral unmixing of Raman micro-images for assessment of morphological and chemical parameters in non-dried brain tumor specimens. Anal Bioanal Chem. 2013;405(27):8719-8728. https://doi.org/10.1007/s00216-013-7257-7 220. Bergner N, Krafft C, Geiger KD, Kirsch M, Schackert G, Popp J. Unsupervised unmixing of Raman microspectroscopic images for morphochemical analysis of non-dried brain tumor specimens. Anal Bioanal Chem. 2012;403(3):719-725. https://doi.org/10.1007/s00216-012-5858-1 221. Zhang J, Fan Y, He M, et al. Accuracy of Raman spectroscopy in differentiating brain tumor from normal brain tissue. Oncotarget. 2017;8(22):36824-36831. https://doi.org/10.18632/oncotarget.15975 222. Wills H, Kast R, Stewart C, et al. Raman spectroscopy detects and distinguishes neuroblastoma and related tissues in fresh and (banked) frozen specimens. J Pediatr Surg. 2009;44(2):386-391. https://doi.org/10.1016/j.jpedsurg.2008.10.095 223. Rabah R, Weber R, Serhatkulu GK, et al. Diagnosis of neuroblastoma and ganglioneuroma using Raman spectroscopy. J Pediatr Surg. 2008;43(1):171-176. https://doi.org/10.1016/j.jpedsurg.2007.09.040 224. Ricciardi V, Perna G, Lasalvia M, et al. Raman micro-spectroscopy investigation on the effects of X-rays and polyphenols in human neuroblastoma cells. In: Clinical and Preclinical Optical Diagnostics II. Optical Society of America; 2019:11073_35. https://doi.org/10.1117/12.2526590 225. Polis B, Imiela A, Polis L, Abramczyk H. Raman spectroscopy for medulloblastoma. Childs Nerv Syst. 2018;34(12):2425-2430. https://doi.org/10.1007/s00381-018-3906-7 226. Bovenkamp D, Micko A, Püls J, et al. Line Scan Raman Microspectroscopy for Label-Free Diagnosis of Human Pituitary Biopsies. Molecules. 2019;24(19). https://doi.org/10.3390/molecules24193577 227. Das D, Bhattacharjee K, Barman MJ, et al. Pathologic evidence of retinoblastoma seeds supported by field emission scanning electron microscopy and Raman spectroscopy. Indian J Ophthalmol. 2021;69(12):3612-3617. https://doi.org/10.4103/ijo.IJO_436_21 228. Kirsch M, Schackert G, Salzer R, Krafft C. Raman spectroscopic imaging for in vivo detection of cerebral brain metastases. Anal Bioanal Chem. 2010;398(4):1707-1713. https://doi.org/10.1007/s00216-010-4116-7 229. Klamminger GG, Klein K, Mombaerts L, et al. Differentiation of primary CNS lymphoma and glioblastoma using Raman spectroscopy and machine learning algorithms. Free Neuropathol. 2021;2(SE-Original Papers):26. https://doi.org/10.17879/freeneuropathology-2021-3458 230. Doran CE, Frank CB, McGrath S, Packer RA. Use of Handheld Raman Spectroscopy for Intraoperative Differentiation of Normal Brain Tissue From Intracranial Neoplasms in Dogs. Front Vet Sci. 2022;8. https://doi.org/10.3389/fvets.2021.819200 231. Jermyn M, Mercier J, Aubertin K, et al. Highly Accurate Detection of Cancer In Situ with Intraoperative, Label-Free, Multimodal Optical Spectroscopy. Cancer Res. 2017;77(14):3942-3950. https://doi.org/10.1158/0008-5472.CAN-17-0668 232. Desroches J, Jermyn M, Pinto M, et al. A new method using Raman spectroscopy for in vivo targeted brain cancer tissue biopsy. Sci Rep. 2018;8(1):1792. https://doi.org/10.1038/s41598-018-20233-3 233. Lakomkin N, Hadjipanayis CG. The Use of Spectroscopy Handheld Tools in Brain Tumor Surgery: Current Evidence and Techniques. Front Surg. 2019;6:30. https://doi.org/10.3389/fsurg.2019.00030 234. Desroches J, Jermyn M, Mok K, et al. Characterization of a Raman spectroscopy probe system for intraoperative brain tissue classification. Biomed Opt Express. 2015;6(7):2380-2397. https://doi.org/10.1364/BOE.6.002380 235. Karabeber H, Huang R, Iacono P, et al. Guiding brain tumor resection using surface-enhanced Raman scattering nanoparticles and a hand-held Raman scanner. ACS Nano. 2014;8(10):9755-9766. https://doi.org/10.1021/nn503948b 236. Stevens OAC, Hutchings J, Gray W, Day JC. A low background Raman probe for optical biopsy of brain tissue. In: Proc.SPIE. Vol 8939. ; 2014. https://doi.org/10.1117/12.2044139 237. Desroches J, Lemoine É, Pinto M, et al. Development and first in-human use of a Raman spectroscopy guidance system integrated with a brain biopsy needle. J Biophotonics. 2019;12(3):1-7. https://doi.org/10.1002/jbio.201800396 238. Stables R, Clemens G, Butler HJ, et al. Feature driven classification of Raman spectra for real-time spectral brain tumour diagnosis using sound. Analyst. 2017;142(1):98-109. https://doi.org/10.1039/C6AN01583B 239. Nicolson F, Andreiuk B, Andreou C, Hsu H-T, Rudder S, Kircher MF. Non-invasive In Vivo Imaging of Cancer Using Surface-Enhanced Spatially Offset Raman Spectroscopy (SESORS). Theranostics. 2019;9(20):5899-5913. https://doi.org/10.7150/thno.36321 240. Devpura S, Thakur JS, Poulik JM, Rabah R, Naik VM, Naik R. Raman spectroscopic investigation of frozen and deparaffinized tissue sections of pediatric tumors: neuroblastoma and ganglioneuroma. J Raman Spectrosc. 2013;44(3):370-376. https://doi.org/10.1002/jrs.4223 241. Fullwood LM, Clemens G, Griffiths D, et al. Investigating the use of Raman and immersion Raman spectroscopy for spectral histopathology of metastatic brain cancer and primary sites of origin. Anal Methods. 2014;6(12):3948-3961. https://doi.org/10.1039/c3ay42190b 242. Klamminger GG, Gérardy J-J, Jelke F, et al. Application of Raman spectroscopy for detection of histologically distinct areas in formalin-fixed paraffin-embedded glioblastoma. Neuro-Oncology Adv. 2021;3(1):vdab077. https://doi.org/10.1093/noajnl/vdab077 243. Mehta K, Atak A, Sahu A, Srivastava S, C MK. An early investigative serum Raman spectroscopy study of meningioma. Analyst. 2018;143(8):1916-1923. https://doi.org/10.1039/C8AN00224J 244. Chen C, Wu W, Chen C, et al. Rapid diagnosis of lung cancer and glioma based on serum Raman spectroscopy combined with deep learning. J Raman Spectrosc. 2021;52(11):1798-1809. https://doi.org/10.1002/jrs.6224 245. Le Reste P, Pilalis E, Aubry M, et al. Integration of Raman spectra with transcriptome data in glioblastoma multiforme defines tumour subtypes and predicts patient outcome. J Cell Mol Med. 2021;(August):10846-10856. https://doi.org/10.1111/jcmm.16902 246. Selkoe DJ. Folding proteins in fatal ways. Nature. 2003;426(6968):900-904. https://doi.org/10.1038/nature02264 247. Chiti F, Dobson CM. Protein Misfolding, Functional Amyloid, and Human Disease. Annu Rev Biochem. 2006;75(1):333-366. https://doi.org/10.1146/annurev.biochem.75.101304.123901 248. Paul TJ, John H, H. FK. Toxic Proteins in Neurodegenerative Disease. Science (80- ). 2002;296(5575):1991-1995. https://doi.org/10.1126/science.1067122 249. Miller LM. Chapter 5 - Infrared spectroscopy and imaging for understanding neurodegenerative protein-misfolding diseases. In: Ozaki Y, Baranska M, Lednev IK, Wood BRBT-VS in PR, eds. Academic Press; 2020:121-142. https://doi.org/10.1016/B978-0-12-818610-7.00005-0 250. Paraskevaidi M, Martin-Hirsch PL, Martin FL. Vibrational spectroscopy: a promising approach to discriminate neurodegenerative disorders. Mol Neurodegener. 2018;13(1):20. https://doi.org/10.1186/s13024-018-0252-x 251. Paraskevaidi M, Martin-Hirsch PL, Martin FL. Progress and Challenges in the Diagnosis of Dementia: A Critical Review. ACS Chem Neurosci. 2018;9(3):446-461. https://doi.org/10.1021/acschemneuro.8b00007 252. Mitchell AL, Gajjar KB, Theophilou G, Martin FL, Martin-Hirsch PL. Vibrational spectroscopy of biofluids for disease screening or diagnosis: Translation from the laboratory to a clinical setting. J Biophotonics. 2014;7(3-4):153-165. https://doi.org/10.1002/jbio.201400018 253. Lopes J, Correia M, Martins I, et al. FTIR and Raman Spectroscopy Applied to Dementia Diagnosis Through Analysis of Biological Fluids. J Alzheimers Dis. 2016;52(3):801-812. https://doi.org/10.3233/JAD-151163 254. Paraskevaidi M, Morais CLM, Lima KMG, et al. Differential diagnosis of Alzheimer’s disease using spectrochemical analysis of blood. Proc Natl Acad Sci U S A. 2017;114(38):E7929-E7938. https://doi.org/10.1073/pnas.1701517114 255. Oladepo SA, Xiong K, Hong Z, Asher SA, Handen J, Lednev IK. UV Resonance Raman Investigations of Peptide and Protein Structure and Dynamics. Chem Rev. 2012;112(5):2604-2628. https://doi.org/10.1021/cr200198a 256. Lednev IK, Ermolenkov V V, He W, Xu M. Deep-UV Raman spectrometer tunable between 193 and 205 nm for structural characterization of proteins. Anal Bioanal Chem. 2005;381(2):431-437. https://doi.org/10.1007/s00216-004-2991-5 257. Barron LD, Hecht L, Blanch EW, Bell AF. Solution structure and dynamics of biomolecules from Raman optical activity. Prog Biophys Mol Biol. 2000;73(1):1-49. https://doi.org/10.1016/S0079-6107(99)00017-6 258. Barron LD, Buckingham AD. Rayleigh and Raman scattering from optically active molecules. Mol Phys. 1971;20(6):1111-1119. https://doi.org/10.1080/00268977100101091 259. Martial B, Lefèvre T, Auger M. Understanding amyloid fibril formation using protein fragments: structural investigations via vibrational spectroscopy and solid-state NMR. Biophys Rev. 2018;10(4):1133-1149. https://doi.org/10.1007/s12551-018-0427-2 260. Summers KL, Fimognari N, Hollings A, et al. A Multimodal Spectroscopic Imaging Method To Characterize the Metal and Macromolecular Content of Proteinaceous Aggregates ("Amyloid Plaques”). Biochemistry. 2017;56(32):4107-4116. https://doi.org/10.1021/acs.biochem.7b00262 261. Luo Z, Xu H, Liu L, Ohulchanskyy TY, Qu J. Optical Imaging of Beta-Amyloid Plaques in Alzheimer’s Disease. Biosensors. 2021;11(8):255. https://doi.org/10.3390/bios11080255 262. Ghosh C, Pramanik D, Mukherjee S, Dey A, Dey SG. Interaction of NO with Cu and Heme-Bound Aβ Peptides Associated with Alzheimer’s Disease. Inorg Chem. 2013;52(1):362-368. https://doi.org/10.1021/ic302131n 263. Moran SD, Zanni MT. How to Get Insight into Amyloid Structure and Formation from Infrared Spectroscopy. J Phys Chem Lett. 2014;5(11):1984-1993. https://doi.org/10.1021/jz500794d 264. Li H, Lantz R, Du D. Vibrational Approach to the Dynamics and Structure of Protein Amyloids. Molecules. 2019;24(1). https://doi.org/10.3390/molecules24010186 265. Ma J, Pazos IM, Zhang W, Culik RM, Gai F. Site-Specific Infrared Probes of Proteins. Annu Rev Phys Chem. 2015;66(1):357-377. https://doi.org/10.1146/annurev-physchem-040214-121802 266. Bloem R, Koziol K, Waldauer SA, et al. Ligand Binding Studied by 2D IR Spectroscopy Using the Azidohomoalanine Label. J Phys Chem B. 2012;116(46):13705-13712. https://doi.org/10.1021/jp3095209 267. Wang Z, Ye J, Zhang K, et al. Rapid Biomarker Screening of Alzheimer’s Disease by Interpretable Machine Learning and Graphene-Assisted Raman Spectroscopy. ACS Nano. 2022;16(4):6426-6436. https://doi.org/10.1021/acsnano.2c00538 268. Hanlon EB, Manoharan R, Koo TW, et al. Prospects for in vivo Raman spectroscopy. Phys Med Biol. 2000;45(2):R1-59. https://doi.org/10.1088/0031-9155/45/2/201 269. Dong J, Atwood CS, Anderson VE, et al. Metal Binding and Oxidation of Amyloid-β within Isolated Senile Plaque Cores: Raman Microscopic Evidence. Biochemistry. 2003;42(10):2768-2773. https://doi.org/10.1021/bi0272151 270. Sudworth CD, M.D. NK. Raman spectroscopy of Alzheimer’s diseased tissue. In: Proc.SPIE. Vol 5321. ; 2004. https://doi.org/10.1117/12.552869 271. Chen P, Shen A, Zhao W, Baek S-J, Yuan H, Hu J. Raman signature from brain hippocampus could aid Alzheimer’s disease diagnosis. Appl Opt. 2009;48(24):4743-4748. https://doi.org/10.1364/ao.48.004743 272. Paul TJ, Hoffmann Z, Wang C, et al. Structural and Mechanical Properties of Amyloid Beta Fibrils: A Combined Experimental and Theoretical Approach. J Phys Chem Lett. 2016;7(14):2758-2764. https://doi.org/10.1021/acs.jpclett.6b01066 273. Xiong J, JiJi RD. Insights into the aggregation mechanism of Aβ(25-40). Biophys Chem. 2017;220:42-48. https://doi.org/10.1016/j.bpc.2016.11.003 274. Popova LA, Kodali R, Wetzel R, Lednev IK. Structural Variations in the Cross-β Core of Amyloid β Fibrils Revealed by Deep UV Resonance Raman Spectroscopy. J Am Chem Soc. 2010;132(18):6324-6328. https://doi.org/10.1021/ja909074j 275. Xiong J, Roach CA, Oshokoya OO, et al. Role of Bilayer Characteristics on the Structural Fate of Aβ(1–40) and Aβ(25–40). Biochemistry. 2014;53(18):3004-3011. https://doi.org/10.1021/bi4016296 276. Cunha R, Lafeta L, Fonseca EA, et al. Nonlinear and vibrational microscopy for label-free characterization of amyloid-β plaques in Alzheimer’s disease model. Analyst. 2021;146(9):2945-2954. https://doi.org/10.1039/d1an00074h 277. Buividas R, Dzingelevičius N, Kubiliūtė R, et al. Statistically quantified measurement of an Alzheimer’s marker by surface-enhanced Raman scattering. J Biophotonics. 2015;8(7):567-574. https://doi.org/10.1002/jbio.201400017 278. Park HJ, Cho S, Kim M, Jung YS. Carboxylic Acid-Functionalized, Graphitic Layer-Coated Three-Dimensional SERS Substrate for Label-Free Analysis of Alzheimer’s Disease Biomarkers. Nano Lett. 2020;20(4):2576-2584. https://doi.org/10.1021/acs.nanolett.0c00048 279. Xia Y, Padmanabhan P, Sarangapani S, Gulyás B, Vadakke Matham M. Bifunctional Fluorescent/Raman Nanoprobe for the Early Detection of Amyloid. Sci Rep. 2019;9(1):8497. https://doi.org/10.1038/s41598-019-43288-2 280. Zhou Y, Liu J, Zheng T, Tian Y. Label-Free SERS Strategy for In Situ Monitoring and Real-Time Imaging of Aβ Aggregation Process in Live Neurons and Brain Tissues. Anal Chem. 2020;92(8):5910-5920. https://doi.org/10.1021/acs.analchem.9b05837 281. Yu X, Hayden EY, Xia M, et al. Surface enhanced Raman spectroscopy distinguishes amyloid Β-protein isoforms and conformational states. Protein Sci. 2018;27(8):1427-1438. https://doi.org/10.1002/pro.3434 282. Bonhommeau S, Talaga D, Hunel J, Cullin C, Lecomte S. Tip-Enhanced Raman Spectroscopy to Distinguish Toxic Oligomers from Aβ(1-42) Fibrils at the Nanometer Scale. Angew Chem Int Ed Engl. 2017;56(7):1771-1774. https://doi.org/10.1002/anie.201610399 283. D’Andrea C, Foti A, Cottat M, et al. Nanoscale Discrimination between Toxic and Nontoxic Protein Misfolded Oligomers with Tip-Enhanced Raman Spectroscopy. Small. 2018;14(36):e1800890. https://doi.org/10.1002/smll.201800890 284. Michael R, Lenferink A, Vrensen GFJM, Gelpi E, Barraquer RI, Otto C. Hyperspectral Raman imaging of neuritic plaques and neurofibrillary tangles in brain tissue from Alzheimer’s disease patients. Sci Rep. 2017;7(1):15603. https://doi.org/10.1038/s41598-017-16002-3 285. Lochocki B, Morrema THJ, Ariese F, Hoozemans JJM, de Boer JF. The search for a unique Raman signature of amyloid-beta plaques in human brain tissue from Alzheimer{’}s disease patients. Analyst. 2020;145(5):1724-1736. https://doi.org/10.1039/C9AN02087J 286. El Khoury Y, Schirer A, Patte-Mensah C, et al. Raman Imaging Reveals Accumulation of Hemoproteins in Plaques from Alzheimer’s Diseased Tissues. ACS Chem Neurosci. 2021;12(15):2940-2945. https://doi.org/10.1021/acschemneuro.1c00289 287. Röhr D, Boon BDC, Schuler M, et al. Label-free vibrational imaging of different Aβ plaque types in Alzheimer’s disease reveals sequential events in plaque development. Acta Neuropathol Commun. 2020;8(1):222. https://doi.org/10.1186/s40478-020-01091-5 288. Palombo F, Tamagnini F, Jeynes JCG, et al. Detection of Aβ plaque-associated astrogliosis in Alzheimer’s disease brain by spectroscopic imaging and immunohistochemistry. Analyst. 2018;143(4):850-857. https://doi.org/10.1039/c7an01747b 289. Kiskis J, Fink H, Nyberg L, Thyr J, Li J-Y, Enejder A. Plaque-associated lipids in Alzheimer’s diseased brain tissue visualized by nonlinear microscopy. Sci Rep. 2015;5(1):13489. https://doi.org/10.1038/srep13489 290. Li S, Luo Z, Zhang R, et al. Distinguishing Amyloid β-Protein in a Mouse Model of Alzheimer’s Disease by Label-Free Vibrational Imaging. Biosensors. 2021;11(10):365. https://doi.org/10.3390/bios11100365 291. Fonseca EA, Lafetá L, Cunha R, et al. A fingerprint of amyloid plaques in a bitransgenic animal model of Alzheimer{’}s disease obtained by statistical unmixing analysis of hyperspectral Raman data. Analyst. 2019;144(23):7049-7056. https://doi.org/10.1039/C9AN01631G 292. Lochocki B, Boon BDC, Verheul SR, et al. Multimodal, label-free fluorescence and Raman imaging of amyloid deposits in snap-frozen Alzheimer’s disease human brain tissue. Commun Biol. 2021;4(1):474. https://doi.org/10.1038/s42003-021-01981-x 293. Tabatabaei M, Caetano FA, Pashee F, Ferguson SSG, Lagugné-Labarthet F. Tip-enhanced Raman spectroscopy of amyloid β at neuronal spines. Analyst. 2017;142(23):4415-4421. https://doi.org/10.1039/C7AN00744B 294. Liu K, Li J, Raghunathan R, Zhao H, Li X, Wong STC. The Progress of Label-Free Optical Imaging in Alzheimer’s Disease Screening and Diagnosis. Front Aging Neurosci. 2021;13:455. https://doi.org/10.3389/fnagi.2021.699024 295. Ji M, Arbel M, Zhang L, et al. Label-free imaging of amyloid plaques in Alzheimer’s disease with stimulated Raman scattering microscopy. Sci Adv. 2018;4(11):eaat7715. https://doi.org/10.1126/sciadv.aat7715 296. Michael R, Otto C, Lenferink A, et al. Absence of amyloid-beta in lenses of Alzheimer patients: A confocal Raman microspectroscopic study. Exp Eye Res. 2014;119:44-53. https://doi.org/10.1016/j.exer.2013.11.016 297. Fonseca EA, Lafeta L, Luiz Campos J, et al. Micro-Raman spectroscopy of lipid halo and dense-core amyloid plaques: aging process characterization in the Alzheimer{’}s disease APPswePS1ΔE9 mouse model. Analyst. 2021;146(19):6014-6025. https://doi.org/10.1039/D1AN01078F 298. Lee JH, Kim DH, Song WK, Oh M-K, Ko D-K. Label-free imaging and quantitative chemical analysis of Alzheimer’s disease brain samples with multimodal multiphoton nonlinear optical microspectroscopy. J Biomed Opt. 2015;20(5):1-7. https://doi.org/10.1117/1.JBO.20.5.056013 299. Huang C-C, Isidoro C. Raman Spectrometric Detection Methods for Early and Non-Invasive Diagnosis of Alzheimer’s Disease. J Alzheimers Dis. 2017;57(4):1145-1156. https://doi.org/10.3233/JAD-161238 300. Hrubešová K, Fousková M, Habartová L, et al. Search for biomarkers of Alzheimer’s disease: Recent insights, current challenges and future prospects. Clin Biochem. 2019;72:39-51. https://doi.org/10.1016/j.clinbiochem.2019.04.002 301. Eravuchira PJ, Banchelli M, D’Andrea C, Angelis M De, Matteini P, Gannot I. Hollow core photonic crystal fiber-assisted Raman spectroscopy as a tool for the detection of Alzheimer’s disease biomarkers. J Biomed Opt. 2020;25(7):1-10. https://doi.org/10.1117/1.JBO.25.7.077001 302. Oyarzún MP, Tapia-Arellano A, Cabrera P, Jara-Guajardo P, Kogan MJ. Plasmonic Nanoparticles as Optical Sensing Probes for the Detection of Alzheimer’s Disease. Sensors (Basel). 2021;21(6). https://doi.org/10.3390/s21062067 303. Cennamo G, Montorio D, Morra VB, et al. Surface-enhanced Raman spectroscopy of tears: toward a diagnostic tool for neurodegenerative disease identification. J Biomed Opt. 2020;25(8):1-12. https://doi.org/10.1117/1.JBO.25.8.087002 304. Ralbovsky NM, Halámková L, Wall K, Anderson-Hanley C, Lednev IK. Screening for Alzheimer’s Disease Using Saliva: A New Approach Based on Machine Learning and Raman Hyperspectroscopy. J Alzheimers Dis. 2019;71(4):1351-1359. https://doi.org/10.3233/JAD-190675 305. Ryzhikova E, Ralbovsky NM, Sikirzhytski V, et al. Raman spectroscopy and machine learning for biomedical applications: Alzheimer’s disease diagnosis based on the analysis of cerebrospinal fluid. Spectrochim Acta Part A Mol Biomol Spectrosc. 2021;248:119188. https://doi.org/10.1016/j.saa.2020.119188 306. Chou I-H, Benford M, Beier HT, et al. Nanofluidic Biosensing for β-Amyloid Detection Using Surface Enhanced Raman Spectroscopy. Nano Lett. 2008;8(6):1729-1735. https://doi.org/10.1021/nl0808132 307. Stiebing C, Jahn IJ, Schmitt M, et al. Biochemical Characterization of Mouse Retina of an Alzheimer’s Disease Model by Raman Spectroscopy. ACS Chem Neurosci. 2020;11(20):3301-3308. https://doi.org/10.1021/acschemneuro.0c00420 308. Carmona P, Molina M, Calero M, Bermejo-Pareja F, Martínez-Martín P, Toledano A. Discrimination analysis of blood plasma associated with Alzheimer’s disease using vibrational spectroscopy. J Alzheimers Dis. 2013;34(4):911-920. https://doi.org/10.3233/JAD-122041 309. Carmona P, Molina M, López-Tobar E, Toledano A. Vibrational spectroscopic analysis of peripheral blood plasma of patients with Alzheimer’s disease. Anal Bioanal Chem. 2015;407(25):7747-7756. https://doi.org/10.1007/s00216-015-8940-7 310. Paraskevaidi M, Morais CLM, Halliwell DE, et al. Raman Spectroscopy to Diagnose Alzheimer’s Disease and Dementia with Lewy Bodies in Blood. ACS Chem Neurosci. 2018;9(11):2786-2794. https://doi.org/10.1021/acschemneuro.8b00198 <311. Habartová L, Hrubešová K, Syslová K, et al. Blood-based molecular signature of Alzheimer’s disease via spectroscopy and metabolomics. Clin Biochem. 2019;72:58-63. https://doi.org/10.1016/j.clinbiochem.2019.04.004 312. Ralbovsky NM, Fitzgerald GS, McNay EC, Lednev IK. Towards development of a novel screening method for identifying Alzheimer’s disease risk: Raman spectroscopy of blood serum and machine learning. Spectrochim Acta A Mol Biomol Spectrosc. 2021;254:119603. https://doi.org/10.1016/j.saa.2021.119603 313. Demeritte T, Viraka Nellore BP, Kanchanapally R, et al. Hybrid Graphene Oxide Based Plasmonic-Magnetic Multifunctional Nanoplatform for Selective Separation and Label-Free Identification of Alzheimer’s Disease Biomarkers. ACS Appl Mater Interfaces. 2015;7(24):13693-13700. https://doi.org/10.1021/acsami.5b03619 314. Yang J-K, Hwang I-J, Cha MG, et al. Reaction Kinetics-Mediated Control over Silver Nanogap Shells as Surface-Enhanced Raman Scattering Nanoprobes for Detection of Alzheimer’s Disease Biomarkers. Small. 2019;15(19):e1900613. https://doi.org/10.1002/smll.201900613 315. Yu D, Yin Q, Wang J, et al. SERS-Based Immunoassay Enhanced with Silver Probe for Selective Separation and Detection of Alzheimer’s Disease Biomarkers. Int J Nanomedicine. 2021;16:1901-1911. https://doi.org/10.2147/IJN.S293042 316. Ryzhikova E, Kazakov O, Halamkova L, et al. Raman spectroscopy of blood serum for Alzheimer’s disease diagnostics: specificity relative to other types of dementia. J Biophotonics. 2015;8(7):584-596. https://doi.org/10.1002/jbio.201400060 317. Hao N, Wang Z, Liu P, et al. Acoustofluidic multimodal diagnostic system for Alzheimer’s disease. Biosens Bioelectron. 2022;196:113730. https://doi.org/10.1016/j.bios.2021.113730 318. Carlomagno C, Cabinio M, Picciolini S, Gualerzi A, Baglio F, Bedoni M. SERS-based biosensor for Alzheimer disease evaluation through the fast analysis of human serum. J Biophotonics. 2020;13(3):e201960033. https://doi.org/10.1002/jbio.201960033 319. Chen P, Tian Q, Baek SJ, et al. Laser Raman detection of platelet as a non-invasive approach for early and differential diagnosis of Alzheimer’s disease. Laser Phys Lett. 2011;8(7):547-552. https://doi.org/10.1002/lapl.201110016 320. Monfared AMT, Tiwari VS, Trudeau VL, Anis H. Surface-enhanced raman scattering spectroscopy for the detection of glutamate and γ-Aminobutyric acid in serum by partial least squares analysis. IEEE Photonics J. 2015;7(3). https://doi.org/10.1109/JPHOT.2015.2423284 321. Ardini M, Huang J-A, Sánchez CS, et al. Live Intracellular Biorthogonal Imaging by Surface Enhanced Raman Spectroscopy using Alkyne-Silver Nanoparticles Clusters. Sci Rep. 2018;8(1):12652. https://doi.org/10.1038/s41598-018-31165-3 322. Lee W, Kang B-H, Yang H, et al. Spread spectrum SERS allows label-free detection of attomolar neurotransmitters. Nat Commun. 2021;12(1):159. https://doi.org/10.1038/s41467-020-20413-8 323. Moody AS, Sharma B. Multi-metal, Multi-wavelength Surface-Enhanced Raman Spectroscopy Detection of Neurotransmitters. ACS Chem Neurosci. 2018;9(6):1380-1387. https://doi.org/10.1021/acschemneuro.8b00020 324. Moody AS, Baghernejad PC, Webb KR, Sharma B. Surface Enhanced Spatially Offset Raman Spectroscopy Detection of Neurochemicals Through the Skull. Anal Chem. 2017;89(11):5688-5692. https://doi.org/10.1021/acs.analchem.7b00985 325. Moody AS, Payne TD, Barth BA, Sharma B. Surface-enhanced spatially-offset Raman spectroscopy (SESORS) for detection of neurochemicals through the skull at physiologically relevant concentrations. Analyst. 2020;145(5):1885-1893. https://doi.org/10.1039/C9AN01708A 326. Cao X, Qin M, Li P, et al. Probing catecholamine neurotransmitters based on iron-coordination surface-enhanced resonance Raman spectroscopy label. Sensors Actuators B Chem. 2018;268:350-358. https://doi.org/10.1016/j.snb.2018.04.117 327. Zhou B, Li X, Tang X, Li P, Yang L, Liu J. Highly Selective and Repeatable Surface-Enhanced Resonance Raman Scattering Detection for Epinephrine in Serum Based on Interface Self-Assembled 2D Nanoparticles Arrays. ACS Appl Mater Interfaces. 2017;9(8):7772-7779. https://doi.org/10.1021/acsami.6b15205 328. Ciubuc JD, Bennet KE, Qiu C, Alonzo M, Durrer WG, Manciu FS. Raman Computational and Experimental Studies of Dopamine Detection. Biosensors. 2017;7(4). https://doi.org/10.3390/bios7040043 329. Silwal AP, Yadav R, Sprague JE, Lu HP. Raman Spectroscopic Signature Markers of Dopamine–Human Dopamine Transporter Interaction in Living Cells. ACS Chem Neurosci. 2017;8(7):1510-1518. https://doi.org/10.1021/acschemneuro.7b00048 330. Manciu FS, Manciu M, Ciubuc JD, et al. Simultaneous Detection of Dopamine and Serotonin-A Comparative Experimental and Theoretical Study of Neurotransmitter Interactions. Biosensors. 2018;9(1). https://doi.org/10.3390/bios9010003 331. Shi L, Liu M, Zhang L, Tian Y. A Liquid Interfacial SERS Platform on a Nanoparticle Array Stabilized by Rigid Probes for the Quantification of Norepinephrine in Rat Brain Microdialysates. Angew Chem Int Ed Engl. March 2022:e202117125. https://doi.org/10.1002/anie.202117125 332. Miura T, Suzuki K, Kohata N, Takeuchi H. Metal Binding Modes of Alzheimer’s Amyloid β-Peptide in Insoluble Aggregates and Soluble Complexes. Biochemistry. 2000;39(23):7024-7031. https://doi.org/10.1021/bi0002479 333. Miura T, Suzuki K, Takeuchi H. Binding of iron(III) to the single tyrosine residue of amyloid β-peptide probed by Raman spectroscopy. J Mol Struct. 2001;598:79-84. https://doi.org/10.1016/S0022-2860(01)00807-9 334. Yugay D, Goronzy DP, Kawakami LM, et al. Copper Ion Binding Site in β-Amyloid Peptide. Nano Lett. 2016;16(10):6282-6289. https://doi.org/10.1021/acs.nanolett.6b02590 335. Ren H, Zhang Y, Guo S, et al. Identifying Cu(ii)–amyloid peptide binding intermediates in the early stages of aggregation by resonance Raman spectroscopy: a simulation study. Phys Chem Chem Phys. 2017;19(46):31103-31112. https://doi.org/10.1039/C7CP06206K 336. Suzuki K, Miura T, Takeuchi H. Inhibitory effect of copper(II) on zinc(II)-induced aggregation of amyloid beta-peptide. Biochem Biophys Res Commun. 2001;285(4):991-996. https://doi.org/10.1006/bbrc.2001.5263 337. Miura T, Mitani S, Takanashi C, Mochizuki N. Copper selectively triggers β-sheet assembly of an N-terminally truncated amyloid β-peptide beginning with Glu3. J Inorg Biochem. 2004;98(1):10-14. https://doi.org/10.1016/j.jinorgbio.2003.10.008 338. Syme CD, Blanch EW, Holt C, et al. A Raman optical activity study of rheomorphism in caseins, synucleins and tau. New insight into the structure and behaviour of natively unfolded proteins. Eur J Biochem. 2002;269(1):148-156. https://doi.org/10.1046/j.0014-2956.2001.02633.x 339. Ramachandran G, Milán-Garcés EA, Udgaonkar JB, Puranik M. Resonance Raman Spectroscopic Measurements Delineate the Structural Changes that Occur during Tau Fibril Formation. Biochemistry. 2014;53(41):6550-6565. https://doi.org/10.1021/bi500528x 340. Zengin A, Tamer U, Caykara T. A SERS-based sandwich assay for ultrasensitive and selective detection of Alzheimer’s tau protein. Biomacromolecules. 2013;14(9):3001-3009. https://doi.org/10.1021/bm400968x 341. Maurer V, Frank C, Porsiel JC, Zellmer S, Garnweitner G, Stosch R. Step‐by‐step monitoring of a magnetic and SERS‐active immunosensor assembly for purification and detection of tau protein. J Biophotonics. 2020;13(3). https://doi.org/10.1002/jbio.201960090 342. Sereda V, Lednev IK. Polarized Raman Spectroscopy of Aligned Insulin Fibrils. J Raman Spectrosc. 2014;45(8):665-671. https://doi.org/10.1002/jrs.4523 343. Deckert-Gaudig T, Kurouski D, Hedegaard MAB, Singh P, Lednev IK, Deckert V. Spatially resolved spectroscopic differentiation of hydrophilic and hydrophobic domains on individual insulin amyloid fibrils. Sci Rep. 2016;6(1):33575. https://doi.org/10.1038/srep33575 344. Kurouski D, Deckert-Gaudig T, Deckert V, Lednev IK. Surface characterization of insulin protofilaments and fibril polymorphs using tip-enhanced Raman spectroscopy (TERS). Biophys J. 2014;106(1):263-271. https://doi.org/10.1016/j.bpj.2013.10.040 345. Kurouski D, Sorci M, Postiglione T, Belfort G, Lednev IK. Detection and structural characterization of insulin prefibrilar oligomers using surface enhanced Raman spectroscopy. Biotechnol Prog. 2014;30(2):488-495. https://doi.org/10.1002/btpr.1852 346. Rivas-Arancibia S, Rodríguez-Martínez E, Badillo-Ramírez I, López-González U, Saniger JM. Structural Changes of Amyloid Beta in Hippocampus of Rats Exposed to Ozone: A Raman Spectroscopy Study. Front Mol Neurosci. 2017;10:137. https://doi.org/10.3389/fnmol.2017.00137 347. Maiti NC, Apetri MM, Zagorski MG, Carey PR, Anderson VE. Raman Spectroscopic Characterization of Secondary Structure in Natively Unfolded Proteins: α-Synuclein. J Am Chem Soc. 2004;126(8):2399-2408. https://doi.org/10.1021/ja0356176 348. Apetri MM, Maiti NC, Zagorski MG, Carey PR, Anderson VE. Secondary Structure of α-Synuclein Oligomers: Characterization by Raman and Atomic Force Microscopy. J Mol Biol. 2006;355(1):63-71. https://doi.org/10.1016/j.jmb.2005.10.071 349. Flynn JD, McGlinchey RP, Walker RL 3rd, Lee JC. Structural features of α-synuclein amyloid fibrils revealed by Raman spectroscopy. J Biol Chem. 2018;293(3):767-776. https://doi.org/10.1074/jbc.M117.812388 350. Sevgi F, Brauchle EM, Carvajal Berrio DA, et al. Imaging of α-Synuclein Aggregates in a Rat Model of Parkinson’s Disease Using Raman Microspectroscopy. Front cell Dev Biol. 2021;9:664365. https://doi.org/10.3389/fcell.2021.664365 351. Mensch C, Konijnenberg A, Van Elzen R, Lambeir AM, Sobott F, Johannessen C. Raman optical activity of human α-synuclein in intrinsically disordered, micelle-bound α-helical, molten globule and oligomeric β-sheet state. J Raman Spectrosc. 2017;48(7):910-918. https://doi.org/10.1002/jrs.5149 352. Freitas A, Aroso M, Barros A, et al. Characterization of the Striatal Extracellular Matrix in a Mouse Model of Parkinson’s Disease. Antioxidants (Basel, Switzerland). 2021;10(7). https://doi.org/10.3390/antiox10071095 353. Palanisamy S, Yan L, Zhang X, He T. Surface enhanced Raman scattering-active worm-like Ag clusters for sensitive and selective detection of dopamine. Anal Methods. 2015;7(8):3438-3447. https://doi.org/10.1039/C4AY03061C 354. Lim JW, Kang IJ. Fabrication of chitosan-gold nanocomposites combined with optical fiber as SERS substrates to detect dopamine molecules. Bull Korean Chem Soc. 2014;35(1):25-29. https://doi.org/10.5012/bkcs.2014.35.1.25 355. An J-H, El-Said WA, Yea C-H, Kim T-H, Choi J-W. Surface-enhanced Raman scattering of dopamine on self-assembled gold nanoparticles. J Nanosci Nanotechnol. 2011;11(5):4424-4429. https://doi.org/10.1166/jnn.2011.3688 356. Ranc V, Markova Z, Hajduch M, et al. Magnetically Assisted Surface-Enhanced Raman Scattering Selective Determination of Dopamine in an Artificial Cerebrospinal Fluid and a Mouse Striatum Using Fe3O4/Ag Nanocomposite. Anal Chem. 2014;86(6):2939-2946. https://doi.org/10.1021/ac500394g 357. Phung V-D, Jung W-S, Nguyen T-A, Kim J-H, Lee S-W. Reliable and quantitative SERS detection of dopamine levels in human blood plasma using a plasmonic Au/Ag nanocluster substrate. Nanoscale. 2018;10(47):22493-22503. https://doi.org/10.1039/C8NR06444J 358. Sharma A, Müller J, Schuetze K, et al. Comprehensive Profiling of Blood Coagulation and Fibrinolysis Marker Reveals Elevated Plasmin-Antiplasmin Complexes in Parkinson’s Disease. Biology (Basel). 2021;10(8). https://doi.org/10.3390/biology10080716 359. Carlomagno C, Bertazioli D, Gualerzi A, et al. Identification of the Raman Salivary Fingerprint of Parkinson’s Disease Through the Spectroscopic- Computational Combinatory Approach. Front Neurosci. 2021;15:704963. https://doi.org/10.3389/fnins.2021.704963 360. Schipper HM, Kwok CS, Rosendahl SM, et al. Spectroscopy of human plasma for diagnosis of idiopathic Parkinson’s disease. Biomark Med. 2008;2(3):229-238. https://doi.org/10.2217/17520363.2.3.229 361. Mammadova N, Summers CM, Kokemuller RD, et al. Accelerated accumulation of retinal α-synuclein (pSer129) and tau, neuroinflammation, and autophagic dysregulation in a seeded mouse model of Parkinson’s disease. Neurobiol Dis. 2019;121:1-16. https://doi.org/10.1016/j.nbd.2018.09.013 362. Tian F, Yang W, Mordes DA, et al. Monitoring peripheral nerve degeneration in ALS by label-free stimulated Raman scattering imaging. Nat Commun. 2016;7(1):13283. https://doi.org/10.1038/ncomms13283 363. Picardi G, Spalloni A, Generosi A, et al. Tissue degeneration in ALS affected spinal cord evaluated by Raman spectroscopy. Sci Rep. 2018;8(1):13110. https://doi.org/10.1038/s41598-018-31469-4 364. Zhang Q-J, Chen Y, Zou X-H, et al. Prognostic analysis of amyotrophic lateral sclerosis based on clinical features and plasma surface-enhanced Raman spectroscopy. J Biophotonics. 2019;12(8):e201900012. https://doi.org/10.1002/jbio.201900012 365. Zhang QJ, Chen Y, Zou XH, et al. Promoting identification of amyotrophic lateral sclerosis based on label-free plasma spectroscopy. Ann Clin Transl Neurol. 2020;7(10):2010-2018. https://doi.org/10.1002/acn3.51194 366. Morasso CF, Sproviero D, Mimmi MC, et al. Raman spectroscopy reveals biochemical differences in plasma derived extracellular vesicles from sporadic Amyotrophic Lateral Sclerosis patients. Nanomedicine Nanotechnology, Biol Med. 2020;29:102249. https://doi.org/10.1016/j.nano.2020.102249 367. Carlomagno C, Banfi PI, Gualerzi A, et al. Human salivary Raman fingerprint as biomarker for the diagnosis of Amyotrophic Lateral Sclerosis. Sci Rep. 2020;10(1):10175. https://doi.org/10.1038/s41598-020-67138-8 368. Miao K, Wei L. Live-Cell Imaging and Quantification of PolyQ Aggregates by Stimulated Raman Scattering of Selective Deuterium Labeling. ACS Cent Sci. 2020;6(4):478-486. https://doi.org/10.1021/acscentsci.9b01196 369. Xiong K, Punihaole D, Asher SA. UV resonance Raman spectroscopy monitors polyglutamine backbone and side chain hydrogen bonding and fibrillization. Biochemistry. 2012;51(29):5822-5830. https://doi.org/10.1021/bi300551b 370. Perney NM, Braddick L, Jurna M, et al. Polyglutamine Aggregate Structure In Vitro and In Vivo; New Avenues for Coherent Anti-Stokes Raman Scattering Microscopy. PLoS One. 2012;7(7):e40536. https://doi.org/10.1371/journal.pone.0040536. 371. Huefner A, Kuan W-L, Mason SL, Mahajan S, Barker RA. Serum Raman spectroscopy as a diagnostic tool in patients with Huntington{’}s disease. Chem Sci. 2020;11(2):525-533. https://doi.org/10.1039/C9SC03711J 372. Muratore M. Raman spectroscopy and partial least squares analysis in discrimination of peripheral cells affected by Huntington’s disease. Anal Chim Acta. 2013;793:1-10. https://doi.org/10.1016/j.aca.2013.06.012 373. Shashilov V, Xu M, Makarava N, Savtchenko R, Baskakov I V, Lednev IK. Dissecting Structure of Prion Amyloid Fibrils by Hydrogen–Deuterium Exchange Ultraviolet Raman Spectroscopy. J Phys Chem B. 2012;116(27):7926-7930. https://doi.org/10.1021/jp2122455 374. McColl IH, Blanch EW, Gill AC, et al. A New Perspective on β-Sheet Structures Using Vibrational Raman Optical Activity: From Poly(l-lysine) to the Prion Protein. J Am Chem Soc. 2003;125(33):10019-10026. https://doi.org/10.1021/ja021464v 375. Zhu F, Davies P, Thompsett AR, et al. Raman Optical Activity and Circular Dichroism Reveal Dramatic Differences in the Influence of Divalent Copper and Manganese Ions on Prion Protein Folding. Biochemistry. 2008;47(8):2510-2517. https://doi.org/10.1021/bi7022893 376. Miura T, Hori-i A, Mototani H, Takeuchi H. Raman Spectroscopic Study on the Copper(II) Binding Mode of Prion Octapeptide and Its pH Dependence. Biochemistry. 1999;38(35):11560-11569. https://doi.org/10.1021/bi9909389 377. Miura T, Hori-i A, Takeuchi H. Metal-dependent α-helix formation promoted by the glycine-rich octapeptide region of prion protein. FEBS Lett. 1996;396(2-3):248-252. https://doi.org/10.1016/0014-5793(96)01104-0 378. Krasnoslobodtsev A V, Portillo AM, Deckert-Gaudig T, Deckert V, Lyubchenko YL. Nanoimaging for prion related diseases. Prion. 2010;4(4):265-274. https://doi.org/10.4161/pri.4.4.13125 379. Carmona P, Monleón E, Monzón M, Badiola JJ, Monreal J. Raman Analysis of Prion Protein in Blood Cell Membranes from Naturally Affected Scrapie Sheep. Chem Biol. 2004;11(6):759-764. https://doi.org/10.1016/j.chembiol.2004.04.005 380. Pezzotti G, Adachi T, Miyamoto N, et al. Raman Probes for In Situ Molecular Analyses of Peripheral Nerve Myelination. ACS Chem Neurosci. 2020;11(15):2327-2339. https://doi.org/10.1021/acschemneuro.0c00284 381. Carmona P, Ramos JM, De Cózar M, Monreal J. Conformational features of lipids and proteins in myelin membranes using Raman and infrared spectroscopy. J Raman Spectrosc. 1987;18(7):473-476. https://doi.org/10.1002/jrs.1250180704 382. Hu C-R, Zhang D, Slipchenko MN, Cheng J, Hu B. Label-free real-time imaging of myelination in the Xenopus laevis tadpole by in vivo stimulated Raman scattering microscopy. J Biomed Opt. 2014;19(8):086005. https://doi.org/10.1117/1.jbo.19.8.086005 383. Turcotte R, Rutledge DJ, Bélanger E, Dill D, Macklin WB, Côté DC. Intravital assessment of myelin molecular order with polarimetric multiphoton microscopy. Sci Rep. 2016;6(1):31685. https://doi.org/10.1038/srep31685 384. Huang J-R, Cheng Y-C, Huang HJ, Chiang H-P. Confocal mapping of myelin figures with micro-Raman spectroscopy. Appl Phys A. 2017;124(1):58. https://doi.org/10.1007/s00339-017-1450-z 385. Wang H, Fu Y, Zickmund P, Shi R, Cheng J-X. Coherent Anti-Stokes Raman Scattering Imaging of Axonal Myelin in Live Spinal Tissues. Biophys J. 2005;89(1):581-591. https://doi.org/10.1529/biophysj.105.061911 386. Fu Y, Huff TB, Wang H-W, Wang H, Cheng J-X. Ex vivo and in vivo imaging of myelin fibers in mouse brain by coherent anti-Stokes Raman scattering microscopy. Opt Express. 2008;16(24):19396-19409. https://doi.org/10.1364/OE.16.019396 387. Lucas A, Poleg S, Klug A, McCullagh EA. Myelination Deficits in the Auditory Brainstem of a Mouse Model of Fragile X Syndrome. Front Neurosci. 2021;15:772943. https://doi.org/10.3389/fnins.2021.772943 388. Poulen G, Gerber YN, Perez J-C, et al. Coherent Anti-Stokes Raman Scattering Microscopy: A Label-Free Method to Compare Spinal Cord Myelin in Different Species. Front Phys. 2021;9:438. https://doi.org/10.3389/fphy.2021.665650 389. Ramos IR, Lyng FM, Rehman IU, Sharrack B, Woodroofe MN. The use of vibrational spectroscopy to study the pathogenesis multiple sclerosis and other neurological conditions. Appl Spectrosc Rev. 2017;52(10):868-882. https://doi.org/10.1080/05704928.2017.1336450 390. Ozsvár A, Szipőcs R, Ozsvár Z, et al. Quantitative analysis of lipid debris accumulation caused by cuprizone induced myelin degradation in different CNS areas. Brain Res Bull. 2018;137:277-284. https://doi.org/10.1016/j.brainresbull.2018.01.003 391. Poon KWC, Brideau C, Klaver R, Schenk GJ, Geurts JJ, Stys PK. Lipid biochemical changes detected in normal appearing white matter of chronic multiple sclerosis by spectral coherent Raman imaging. Chem Sci. 2018;9(6):1586-1595. https://doi.org/10.1039/C7SC03992A 392. Poon KW, Brideau C, Schenk GJ, et al. Quantitative biochemical investigation of various neuropathologies using high-resolution spectral CARS microscopy. In: Proc.SPIE. Vol 9305. ; 2015. https://doi.org/10.1117/12.2076654 393. Poon KW, Brideau C, Teo W, et al. Investigation of human multiple sclerosis lesions using high resolution spectrally unmixed CARS microscopy. In: Proc.SPIE. Vol 8565. ; 2013. https://doi.org/10.1117/12.2005504 394. Imitola J, Côté D, Rasmussen S, et al. Multimodal coherent anti-Stokes Raman scattering microscopy reveals microglia-associated myelin and axonal dysfunction in multiple sclerosis-like lesions in mice. J Biomed Opt. 2011;16(2):21109. https://doi.org/10.1117/1.3533312 395. Dessai CVP, Pliss A, Kuzmin AN, Furlani EP, Prasad PN. Coherent Raman spectroscopic imaging to characterize microglia activation pathway. J Biophotonics. 2019;12(5):e201800133. https://doi.org/10.1002/jbio.201800133 396. Fu Y, Frederick TJ, Huff TB, Goings GE, Miller SD, Cheng J-X. Paranodal myelin retraction in relapsing experimental autoimmune encephalomyelitis visualized by coherent anti-Stokes Raman scattering microscopy. J Biomed Opt. 2011;16(10):106006. https://doi.org/10.1117/1.3638180 397. Gasecka P, Jaouen A, Bioud F-Z, et al. Lipid Order Degradation in Autoimmune Demyelination Probed by Polarized Coherent Raman Microscopy. Biophys J. 2017;113(7):1520-1530. https://doi.org/10.1016/j.bpj.2017.07.033 398. Alba-Arbalat S, Andorra M, Sanchez-Dalmau B, et al. In Vivo Molecular Changes in the Retina of Patients With Multiple Sclerosis. Invest Ophthalmol Vis Sci. 2021;62(6):11. https://doi.org/10.1167/iovs.62.6.11 399. Stiebing C, Schie IW, Knorr F, et al. Nonresonant Raman spectroscopy of isolated human retina samples complying with laser safety regulations for in vivo measurements. Neurophotonics. 2019;6(4):41106. https://doi.org/10.1117/1.NPh.6.4.041106 400. Rodionova NN, Allakhverdiev ES, Maksimov G V. Study of myelin structure changes during the nerve fibers demyelination. PLoS One. 2017;12(9):1-12. https://doi.org/10.1371/journal.pone.0185170 401. Hajjar H, Boukhaddaoui H, Rizgui A, et al. Label-free non-linear microscopy to measure myelin outcome in a rodent model of Charcot-Marie-Tooth diseases. J Biophotonics. 2018;11(12):e201800186. https://doi.org/10.1002/jbio.201800186 402. Canta A, Chiorazzi A, Carozzi VA, et al. Age-related changes in the function and structure of the peripheral sensory pathway in mice. Neurobiol Aging. 2016;45:136-148. https://doi.org/10.1016/j.neurobiolaging.2016.05.014 403. Shi Y, Zhang D, Huff TB, et al. Longitudinal in vivo coherent anti-Stokes Raman scattering imaging of demyelination and remyelination in injured spinal cord. J Biomed Opt. 2011;16(10):106012. https://doi.org/10.1117/1.3641988 404. Bélanger E, Henry FP, Vallée R, et al. In vivo evaluation of demyelination and remyelination in a nerve crush injury model. Biomed Opt Express. 2011;2(9):2698-2708. https://doi.org/10.1364/BOE.2.002698 405. Morisaki S, Ota C, Matsuda K, et al. Application of Raman spectroscopy for visualizing biochemical changes during peripheral nerve injury in vitro and in vivo. J Biomed Opt. 2013;18(11):1-9. https://doi.org/10.1117/1.JBO.18.11.116011 406. Bae K, Zheng W, Huang Z. Quantitative assessment of spinal cord injury using circularly polarized coherent anti-Stokes Raman scattering microscopy. Appl Phys Lett. 2017;111(6):63704. https://doi.org/10.1063/1.4991792 407. Boissonnas A, Louboutin F, Laviron M, et al. Imaging resident and recruited macrophage contribution to Wallerian degeneration. J Exp Med. 2020;217(11). https://doi.org/10.1084/jem.20200471 408. Blat A, Dybas J, Chrabaszcz K, et al. FTIR, Raman and AFM characterization of the clinically valid biochemical parameters of the thrombi in acute ischemic stroke. Sci Rep. 2019;9(1):15475. https://doi.org/10.1038/s41598-019-51932-0 409. Matthäus C, Dochow S, Bergner G, et al. In Vivo Characterization of Atherosclerotic Plaque Depositions by Raman-Probe Spectroscopy and in Vitro Coherent Anti-Stokes Raman Scattering Microscopic Imaging on a Rabbit Model. Anal Chem. 2012;84(18):7845-7851. https://doi.org/10.1021/ac301522d 410. Lattermann A, Matthäus C, Bergner N, et al. Characterization of atherosclerotic plaque depositions by Raman and FTIR imaging. J Biophotonics. 2013;6(1):110-121. https://doi.org/10.1002/jbio.201200146 411. Qin Z, Chon CH, Lam AKN, Kwok JCK, Yuen MMF, Lam DCC. Feasibility examination of isolated zonal thrombolysis using Raman spectroscopy. Annu Int Conf IEEE Eng Med Biol Soc IEEE Eng Med Biol Soc Annu Int Conf. 2015;2015:1353-1356. https://doi.org/10.1109/EMBC.2015.7318619 412. Jiménez-Altayó F, Marzi J, Galan M, et al. Arachnoid membrane as a source of sphingosine-1-phosphate that regulates mouse middle cerebral artery tone. J Cereb blood flow Metab Off J Int Soc Cereb Blood Flow Metab. September 2021:271678X211033362. https://doi.org/10.1177/0271678X211033362 413. Jung GB, Kang SW, Lee G-J, Kim D. Biochemical Characterization of the Brain Hippocampal Areas after Cerebral Ischemia-Reperfusion Using Raman Spectroscopy. Appl Spectrosc. 2018;72(10):1479-1486. https://doi.org/10.1177/0003702818776627 414. Liu J, Liu Z, Wang W, Tian Y. Real-time Tracking and Sensing of Cu(+) and Cu(2+) with a Single SERS Probe in the Live Brain: Toward Understanding Why Copper Ions Were Increased upon Ischemia. Angew Chem Int Ed Engl. 2021;60(39):21351-21359. https://doi.org/10.1002/anie.202106193 415. Russo V, Candeloro P, Malara N, et al. Key Role of Cytochrome C for Apoptosis Detection Using Raman Microimaging in an Animal Model of Brain Ischemia with Insulin Treatment. Appl Spectrosc. 2019;73(10):1208-1217. https://doi.org/10.1177/0003702819858671 416. Yamazoe S, Naya M, Shiota M, et al. Large-Area Surface-Enhanced Raman Spectroscopy Imaging of Brain Ischemia by Gold Nanoparticles Grown on Random Nanoarrays of Transparent Boehmite. ACS Nano. 2014;8(6):5622-5632. https://doi.org/10.1021/nn4065692 417. Caine S, Hackett MJ, Hou H, et al. A novel multi-modal platform to image molecular and elemental alterations in ischemic stroke. Neurobiol Dis. 2016;91:132-142. https://doi.org/10.1016/j.nbd.2016.03.006 418. Fan Y, Chen C, Xie X, et al. Rapid noninvasive screening of cerebral ischemia and cerebral infarction based on tear Raman spectroscopy combined with multiple machine learning algorithms. Lasers Med Sci. 2022;37(1):417-424. https://doi.org/10.1007/s10103-021-03273-6 419. Lee B-R, Joo K-I, Choi ES, Jahng J, Kim H, Kim E. Evans blue dye-enhanced imaging of the brain microvessels using spectral focusing coherent anti-Stokes Raman scattering microscopy. PLoS One. 2017;12(10):e0185519. https://doi.org/10.1371/journal.pone.0185519 420. Brazhe NA, Thomsen K, Lønstrup M, et al. Monitoring of blood oxygenation in brain by resonance Raman spectroscopy. J Biophotonics. 2018;11(6):e201700311. https://doi.org/10.1002/jbio.201700311 421. Williamson MR, Dietrich K, Hackett MJ, et al. Rehabilitation Augments Hematoma Clearance and Attenuates Oxidative Injury and Ion Dyshomeostasis After Brain Hemorrhage. Stroke. 2017;48(1):195-203. https://doi.org/10.1161/STROKEAHA.116.015404 422. Zhao P, Sun J, Zhao S, et al. SERS-based immunoassay based on gold nanostars modified with 5,5’-dithiobis-2-nitrobenzoic acid for determination of glial fibrillary acidic protein. Mikrochim Acta. 2021;188(12):428. https://doi.org/10.1007/s00604-021-05081-9 423. Kim W, Lee SH, Ahn YJ, et al. A label-free cellulose SERS biosensor chip with improvement of nanoparticle-enhanced LSPR effects for early diagnosis of subarachnoid hemorrhage-induced complications. Biosens Bioelectron. 2018;111:59-65. https://doi.org/10.1016/j.bios.2018.04.003 424. Kawon K, Setkowicz Z, Drozdz A, Janeczko K, Chwiej J. The methods of vibrational microspectroscopy reveals long-term biochemical anomalies within the region of mechanical injury within the rat brain. Spectrochim Acta Part A Mol Biomol Spectrosc. 2021;263:120214. https://doi.org/10.1016/j.saa.2021.120214 425. Saxena T, Deng B, Hasenwinkel JM, Stelzner D, Chaiken J. Raman spectroscopic investigation of spinal cord injury in a rat model. J Biomed Opt. 2011;16(2):1-14. https://doi.org/10.1117/1.3549700 426. Saxena T, Deng B, Lewis-Clark E, et al. Near infrared Raman spectroscopic study of reactive gliosis and the glial scar in injured rat spinal cords. In: Biomedical Vibrational Spectroscopy IV: Advances in Research and Industry. Vol 7560. ; 2010:75600I. https://doi.org/10.1117/12.846897 427. Banbury C, Styles I, Eisenstein N, et al. Spectroscopic detection of traumatic brain injury severity and biochemistry from the retina. Biomed Opt Express. 2020;11(11):6249-6261. https://doi.org/10.1364/BOE.399473 428. Surmacki JM, Ansel-Bollepalli L, Pischiutta F, Zanier ER, Ercole A, Bohndiek SE. Label-free monitoring of tissue biochemistry following traumatic brain injury using Raman spectroscopy. Analyst. 2017;142(1):132-139. https://doi.org/10.1039/C6AN02238C 429. Khalenkow D, Donche S, Braeckman K, Vanhove C, Skirtach AG. Added Value of Microscale Raman Chemical Analysis in Mild Traumatic Brain Injury (TBI): A Comparison with Macroscale MRI. ACS Omega. 2018;3(12):16806-16811. https://doi.org/10.1021/acsomega.8b02404 430. Tay L-L, Tremblay RG, Hulse J, Zurakowski B, Thompson M, Bani-Yaghoub M. Detection of acute brain injury by Raman spectral signature. Analyst. 2011;136(8):1620-1626. https://doi.org/10.1039/C0AN00897D 431. Li D, Yang M, Li H, Mao L, Wang Y, Sun B. SERS based protocol using flow glass-hemostix for detection of neuron-specific enolase in blood plasma. New J Chem. 2019;43(15):5925-5931. https://doi.org/10.1039/C8NJ02561D 432. Gao X, Zheng P, Kasani S, et al. Paper-Based Surface-Enhanced Raman Scattering Lateral Flow Strip for Detection of Neuron-Specific Enolase in Blood Plasma. Anal Chem. 2017;89(18):10104-10110. https://doi.org/10.1021/acs.analchem.7b03015 433. Rickard JJS, Di-Pietro V, Smith DJ, Davies DJ, Belli A, Oppenheimer PG. Rapid optofluidic detection of biomarkers for traumatic brain injury via surface-enhanced Raman spectroscopy. Nat Biomed Eng. 2020;4(6):610-623. https://doi.org/10.1038/s41551-019-0510-4 434. Gao X, Boryczka J, Zheng P, et al. A "hot Spot”-Enhanced paper lateral flow assay for ultrasensitive detection of traumatic brain injury biomarker S-100β in blood plasma. Biosens Bioelectron. 2021;177:112967. https://doi.org/10.1016/j.bios.2021.112967 435. Wang Y, Zhao P, Mao L, Hou Y, Li D. Determination of brain injury biomarkers by surface-enhanced Raman scattering using hollow gold nanospheres. RSC Adv. 2018;8(6):3143-3150. https://doi.org/10.1039/C7RA12410D 436. Mowbray M, Banbury C, Rickard JJS, Davies DJ, Goldberg Oppenheimer P. Development and Characterization of a Probe Device toward Intracranial Spectroscopy of Traumatic Brain Injury. ACS Biomater Sci Eng. 2021;7(3):1252-1262. https://doi.org/10.1021/acsbiomaterials.0c01156 437. Kočović DM, Bajuk-Bogdanović D, Pećinar I, Nedeljković BB, Daković M, Andjus PR. Assessment of cellular and molecular changes in the rat brain after gamma radiation and radioprotection by anisomycin. J Radiat Res. 2021;62(5):793-803. https://doi.org/10.1093/jrr/rrab045 438. Stevens AR, Stickland CA, Harris G, et al. Raman Spectroscopy as a Neuromonitoring Tool in Traumatic Brain Injury: A Systematic Review and Clinical Perspectives. Cells. 2022;11(7). https://doi.org/10.3390/cells11071227 439. Niedieker D, GrosserÜschkamp F, Schreiner A, et al. Label-free identification of myopathological features with coherent anti-Stokes Raman scattering. Muscle Nerve. 2018;58(3):456-459. https://doi.org/10.1002/mus.26140 440. Alix JJP, Plesia M, Lloyd GR, et al. Rapid identification of human muscle disease with fibre optic Raman spectroscopy. Analyst. 2022. https://doi.org/10.1039/D1AN01932E 441. Gautam R, Vanga S, Madan A, Gayathri N, Nongthomba U, Umapathy S. Raman Spectroscopic Studies on Screening of Myopathies. Anal Chem. 2015;87(4):2187-2194. https://doi.org/10.1021/ac503647x 442. Plesia M, Stevens OA, Lloyd GR, et al. In Vivo Fiber Optic Raman Spectroscopy of Muscle in Preclinical Models of Amyotrophic Lateral Sclerosis and Duchenne Muscular Dystrophy. ACS Chem Neurosci. 2021;12(10):1768-1776. https://doi.org/10.1021/acschemneuro.0c00794 443. Hentschel A, Czech A, Münchberg U, et al. Protein signature of human skin fibroblasts allows the study of the molecular etiology of rare neurological diseases. Orphanet J Rare Dis. 2021;16(1):73. https://doi.org/10.1186/s13023-020-01669-1 444. Ralbovsky NM, Dey P, Galfano A, Dey BK, Lednev IK. Diagnosis of a model of Duchenne muscular dystrophy in blood serum of mdx mice using Raman hyperspectroscopy. Sci Rep. 2020;10(1):11734. https://doi.org/10.1038/s41598-020-68598-8 445. Wallach DF, Verma SP, Singer WE. A protein anomaly in erythrocyte membranes of patients with Duchenne muscular dystrophy. J Exp Med. 1983;157(6):2017-2028. https://doi.org/10.1084/jem.157.6.2017 446. Driskell JD, Zhu Y, Kirkwood CD, Zhao Y, Dluhy RA, Tripp RA. Rapid and Sensitive Detection of Rotavirus Molecular Signatures Using Surface Enhanced Raman Spectroscopy. PLoS One. 2010;5(4):e10222. https://doi.org/10.1371/journal.pone.0010222. 447. Palchaudhuri S, Rehse SJ, Hamasha K, et al. Raman spectroscopy of xylitol uptake and metabolism in Gram-positive and Gram-negative bacteria. Appl Environ Microbiol. 2011;77(1):131-137. https://doi.org/10.1128/AEM.01458-10 448. Harz M, Kiehntopf M, Stöckel S, et al. Direct analysis of clinical relevant single bacterial cells from cerebrospinal fluid during bacterial meningitis by means of micro-Raman spectroscopy. J Biophotonics. 2009;2(1-2):70-80. https://doi.org/10.1002/jbio.200810068 449. Gracie K, Correa E, Mabbott S, et al. Simultaneous detection and quantification of three bacterial meningitis pathogens by SERS. Chem Sci. 2014;5(3):1030-1040. https://doi.org/10.1039/C3SC52875H 450. Sathyavathi R, Dingari NC, Barman I, et al. Raman spectroscopy provides a powerful, rapid diagnostic tool for the detection of tuberculous meningitis in ex vivo cerebrospinal fluid samples. J Biophotonics. 2013;6(8):567-572. https://doi.org/10.1002/jbio.201200110 451. Kamińska A, Witkowska E, Kowalska A, et al. Highly efficient SERS-based detection of cerebrospinal fluid neopterin as a diagnostic marker of bacterial infection. Anal Bioanal Chem. 2016;408(16):4319-4327. https://doi.org/10.1007/s00216-016-9535-7 452. Harz M, Kiehntopf M, Stöckel S, Rösch P, Deufel T, Popp J. Analysis of single blood cells for CSF diagnostics via a combination of fluorescence staining and micro-Raman spectroscopy. Analyst. 2008;133(10):1416-1423. https://doi.org/10.1039/B716132H 453. Steelman Z, Meng Z, Traverso AJ, Yakovlev V V. Brillouin spectroscopy as a new method of screening for increased CSF total protein during bacterial meningitis. J Biophotonics. 2015;8(5):408-414. https://doi.org/10.1002/jbio.201400047 454. Ladiwala U, Bankapur A, Barkur S, Thakur B, Santhosh C, Mathur D. Raman spectroscopic detection of rapid, reversible, early-stage inflammatory cytokine-induced apoptosis of adult hippocampal progenitors/stem cells: A preliminary study. Proc Indian Natl Sci Acad. 2015;81(5):1223-1236. https://doi.org/10.16943/ptinsa/2015/v81i5/48343 455. Tanuma M, Kasai A, Bando K, et al. Direct visualization of an antidepressant analog using surface-enhanced Raman scattering in the brain. JCI insight. 2020;5(6):e133348. https://doi.org/10.1172/jci.insight.133348 456. Pogocki D, Kisała J, Cebulski J. Depression as is Seen by Molecular Spectroscopy. Phospholipid- Protein Balance in Affective Disorders and Dementia. Curr Mol Med. 2020;20(6):484-487. https://doi.org/10.2174/1566524020666191219102746 457. Depciuch J, Sowa-Kućma M, Nowak G, et al. Phospholipid-protein balance in affective disorders: Analysis of human blood serum using Raman and FTIR spectroscopy. A pilot study. J Pharm Biomed Anal. 2016;131:287-296. https://doi.org/10.1016/j.jpba.2016.08.037 458. Depciuch J, Parlinska-Wojtan M. Comparing dried and liquid blood serum samples of depressed patients: An analysis by Raman and infrared spectroscopy methods. J Pharm Biomed Anal. 2018;150:80-86. https://doi.org/10.1016/j.jpba.2017.11.074 459. Chaichi A, Hasan SMA, Mehta N, et al. Label-free lipidome study of paraventricular thalamic nucleus (PVT) of rat brain with post-traumatic stress injury by Raman imaging. Analyst. 2021;146(1):170-183. https://doi.org/10.1039/d0an01615b 460. Xu J, Potter M, Tomas C, et al. A new approach to find biomarkers in chronic fatigue syndrome/myalgic encephalomyelitis (CFS/ME) by single-cell Raman micro-spectroscopy. Analyst. 2019;144(3):913-920. https://doi.org/10.1039/C8AN01437J 461. González-Cebrián A, Almenar-Pérez E, Xu J, et al. Diagnosis of Myalgic Encephalomyelitis/Chronic Fatigue Syndrome With Partial Least Squares Discriminant Analysis: Relevance of Blood Extracellular Vesicles. Front Med. 2022;9:842991. https://doi.org/10.3389/fmed.2022.842991 462. Guo S, Popp J, Bocklitz T. Chemometric analysis in Raman spectroscopy from experimental design to machine learning–based modeling. Nat Protoc. 2021;16(12):5426-5459. https://doi.org/10.1038/s41596-021-00620-3 463. Wang W, McGregor H, Short M, Zeng H. Clinical utility of Raman spectroscopy: current applications and ongoing developments. Adv Heal Care Technol. June 2016:13. https://doi.org/10.2147/AHCT.S96486 464. Li Z, Sun W, Duan W, et al. Guiding Epilepsy Surgery with an LRP1-Targeted SPECT/SERRS Dual-Mode Imaging Probe. ACS Appl Mater Interfaces. May 2022. https://doi.org/10.1021/acsami.2c02540 465. Mosca S, Conti C, Stone N, Matousek P. Spatially offset Raman spectroscopy. Nat Rev Methods Prim. 2021;1(1):21. https://doi.org/10.1038/s43586-021-00019-0 466. Liao C-S, Wang P, Huang CY, et al. In Vivo and in Situ Spectroscopic Imaging by a Handheld Stimulated Raman Scattering Microscope. ACS Photonics. 2018;5(3):947-954. https://doi.org/10.1021/acsphotonics.7b01214 467. Louis DN, Perry A, Wesseling P, et al. The 2021 WHO Classification of Tumors of the Central Nervous System: a summary. Neuro Oncol. 2021;23(8):1231-1251. https://doi.org/10.1093/neuonc/noab106 468. Cicerone MT, Camp CH. Histological coherent Raman imaging: a prognostic review. Analyst. 2018;143(1):33-59. https://doi.org/10.1039/C7AN01266G 469. Stevens O, Iping Petterson IE, Day JCC, Stone N. Developing fibre optic Raman probes for applications in clinical spectroscopy. Chem Soc Rev. 2016;45(7):1919-1934. https://doi.org/10.1039/C5CS00850F 470. Baker MJ, Byrne HJ, Chalmers J, et al. Clinical applications of infrared and Raman spectroscopy: state of play and future challenges. Analyst. 2018;143(8):1735-1757. https://doi.org/10.1039/C7AN01871A 471. Bassan P, Mellor J, Shapiro J, Williams KJ, Lisanti MP, Gardner P. Transmission FT-IR Chemical Imaging on Glass Substrates: Applications in Infrared Spectral Histopathology. Anal Chem. 2014;86(3):1648-1653. https://doi.org/10.1021/ac403412n 472. Ibrahim O, Maguire A, Meade AD, et al. Improved protocols for pre-processing Raman spectra of formalin fixed paraffin preserved tissue sections. Anal Methods. 2017;9(32):4709-4717. https://doi.org/10.1039/C6AY03308C 473. V F. Optical scanners for melanoma detection [Issues in emerging health technologies, Issue 123]. Ottawa: Canadian Agency for Drugs and Technologies in Health; 2014. 474. CBC News. Skin cancer detector approved | CBC News. https://www.cbc.ca/news/health/skin-cancer-detector-approved-1.1121389 . Published 2011. Accessed March 25, 2022. 475. Sulukan E, Baran A, Şenol O, et al. The synergic toxicity of temperature increases and nanopolystrene on zebrafish brain implies that global warming may worsen the current risk based on plastic debris. Sci Total Environ. 2021;808:152092. https://doi.org/10.1016/j.scitotenv.2021.152092 476. Li S, Li Y, Yi R, Liu L, Qu J. Coherent Anti-Stokes Raman Scattering Microscopy and Its Applications . Front Phys . 2020;8. https://www.frontiersin.org/article/10.3389/fphy.2020.598420. 477. Robert B. Resonance Raman spectroscopy. Photosynth Res. 2009;101(2-3):147-155. https://doi.org/10.1007/s11120-009-9440-4 478. Bruzas I, Lum W, Gorunmez Z, Sagle L. Advances in surface-enhanced Raman spectroscopy (SERS) substrates for lipid and protein characterization: sensing and beyond. Analyst. 2018;143(17):3990-4008. https://doi.org/10.1039/C8AN00606G 479. Campion A, Kambhampati P. Surface-enhanced Raman scattering. Chem Soc Rev. 1998;27(4):241-250. https://doi.org/10.1039/A827241Z 480. Muehlethaler C, Leona M, Lombardi JR. Review of Surface Enhanced Raman Scattering Applications in Forensic Science. Anal Chem. 2016;88(1):152-169. https://doi.org/10.1021/acs.analchem.5b04131 481. Mirsadeghi S, Dinarvand R, Ghahremani MH, et al. Protein corona composition of gold nanoparticles/nanorods affects amyloid beta fibrillation process. Nanoscale. 2015;7(11):5004-5013. https://doi.org/10.1039/C4NR06009A 482. Nandakumar P, Kovalev A, Volkmer A. Vibrational imaging Based on stimulated Raman scattering microscopy. New J Phys. 2009;11. https://doi.org/10.1088/1367-2630/11/3/033026 483. Lin H, Lee HJ, Tague N, et al. Microsecond fingerprint stimulated Raman spectroscopic imaging by ultrafast tuning and spatial-spectral learning. Nat Commun. 2021;12(1):3052. https://doi.org/10.1038/s41467-021-23202-z 484. W. FC, Wei M, G. SB, et al. Label-Free Biomedical Imaging with High Sensitivity by Stimulated Raman Scattering Microscopy. Science (80- ). 2008;322(5909):1857-1861. https://doi.org/10.1126/science.1165758 485. Topp MR. Pulsed Laser Spectroscopy. Appl Spectrosc Rev. 1978;14(1):1-100. https://doi.org/10.1080/05704927808060389 486. Zumbusch A, Holtom GR, Xie XS. Three-Dimensional Vibrational Imaging by Coherent Anti-Stokes Raman Scattering. Phys Rev Lett. 1999;82(20):4142-4145. https://doi.org/10.1103/PhysRevLett.82.4142 487. Potma EO, Xie XS. CARS Microscopy for Biology and Medicine. Opt Photon News. 2004;15(11):40-45. https://doi.org/10.1364/OPN.15.11.000040
Copyright: © 2022 The author(s). This is an open access article distributed under the terms of the Creative Commons Attribution 4.0 International License (https://creativecommons.org/licenses/by/4.0/), which permits unrestricted use, distribution, and reproduction in any medium, provided the original author and source are credited, a link to the Creative Commons license is provided, and any changes are indicated. The Creative Commons Public Domain Dedication waiver (https://creativecommons.org/publicdomain/zero/1.0/) applies to the data made available in this article, unless otherwise stated. |