|
|
|
Free Neuropathology 2:26 (2021) |
|
Original Paper |
|
Differentiation of primary CNS lymphoma and glioblastoma using Raman spectroscopy and machine learning algorithms |
|
Gilbert Georg Klamminger*1,2,3, Karoline Klein*1,4, Laurent Mombaerts*6, Finn Jelke1,4, Giulia Mirizzi1,4, Rédouane Slimani5,7, Andreas Husch6, Michel Mittelbronn2,3,6,7,8,9, Frank Hertel1,4,6, Felix B. Kleine Borgmann3,6,7 |
|
1 Saarland University Medical Center and Faculty of Medicine, Homburg, Germany |
|
Corresponding author: |
|
Submitted: 04 August 2021 Accepted: 27 September 2021 Copyedited by: Vanessa S. Goodwill Published: 04 October 2021 |
|
Additional resources and electronic supplementary material: supplementary material |
|
Keywords: Raman spectroscopy, PCNSL, Glioblastoma, Machine learning |
|
Abstract
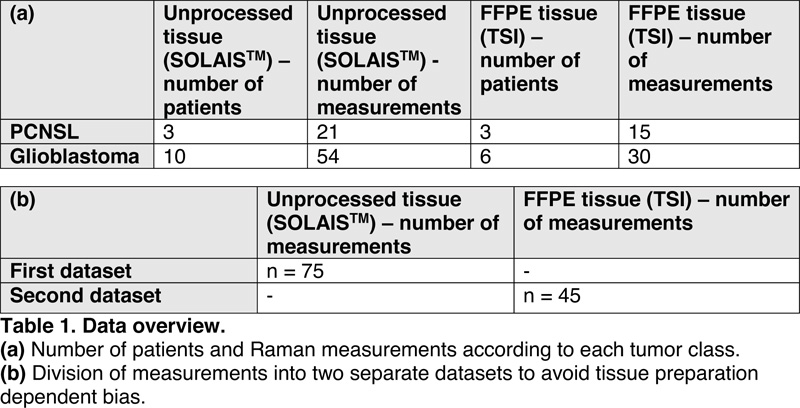
Objective and Methods: Timely discrimination between primary CNS lymphoma (PCNSL) and glioblastoma is crucial for diagnosis and therapy, but also determines the intraoperative surgical course. Advanced radiological methods allow for their distinction to a certain extent but ultimately, biopsies are still necessary for final diagnosis. As an upcoming method that enables tissue analysis by tracking changes in the vibrational state of molecules via inelastic scattered photons, we used Raman Spectroscopy (RS) as a label free method to examine specimens of both tumor entities intraoperatively, as well as postoperatively in formalin fixed paraffin embedded (FFPE) samples. Introduction The highly malignant and rare non-Hodgkin primary central nervous system lymphoma (PCNSL) accounts for only 3% of all brain tumors1. The common practice to confirm the suspicion of a PCNSL is a stereotactic biopsy, according to which it can be histopathologically diagnosed and the following treatment adjusted2. Due to similar initial clinical presentations and imaging properties, an important differential diagnosis of primary CNS lymphoma is diffuse high-grade glioma, especially glioblastoma, WHO grade IV. The clinical management and treatment, however, considerably vary between these entities. While gross surgical resection of the tumor followed by combined radio-chemotherapy is standard of care in the treatment of glioblastoma, surgery plays a subordinate role in PCNSL therapy3-4. It is essential to differentiate between these tumors as early as possible5. Recent magnetic resonance imaging (MRI) studies have shown potential, using, amongst other parameters, the signal of the tumor blood flow (TBF) and diffusion tensor imaging (DTI) characteristics preoperatively5. Furthermore, discrimination was described using the levels of myo-inositol concentration measured with magnetic resonance spectroscopy6. Nevertheless, stereotactic biopsies remain necessary to confirm the diagnosis in the majority of cases. As a promising method in tumor diagnostics, Raman Spectroscopy (RS) allows fast and non-destructive, label-free tissue classification even perioperatively. So far, it has been successfully used to distinguish different entities and grades of brain tumors, such as meningiomas and gliomas7,8,9,10. Due to their inherent ability of tissue recognition, inelastic scattered photons caused by changes in the vibrational state of molecules are used as a “molecular fingerprint” of the examined tissue. RS has already been shown to be capable of detecting intraocular lymphoma cells11. RS is also able to distinguish between diffuse large B-cells and chronic lymphocytic leukemia in blood samples12, as well as to predict the malignancy status of lymph nodes13. Assessment of tumor tissue via RS during diagnostic stereotactic interventions may lead to early changes of the intraoperative surgical course by favoring immediate surgical intervention in the case of glioblastoma or rather to cessation of the procedure in lymphoma patients without waiting for more detailed histopathological analysis. RS may further be applied on processed tissue14, such as on formalin fixed paraffin-embedded (FFPE) tissue in the pathology department to distinguish between PCNSL and malignant glioma. Here, we applied RS on freshly resected tissue within the operating room (OR) and after histopathological diagnosis of FFPE tissue. We then tested linear and nonlinear machine learning algorithms with the goal to create a classifier that in the future may be useful both in the OR and in the pathological diagnostics for the differentiation between PCNSL and glioblastoma. Materials and methods Patient data 75 measurements from 3 PCNSL patients (due to a low prevalence the number of samples remains limited) and 10 glioblastoma patients were carried out intraoperatively on freshly resected tissue without further processing (2 patients) and after formalin fixation (1 patient). 45 measurements from 3 PCNSL patients and 6 glioblastoma samples were carried out on FFPE tissue. Table 1 provides a more detailed overview about conducted measurements, Supplemental Table 1 and 2 contain additional information about the glioblastoma samples.
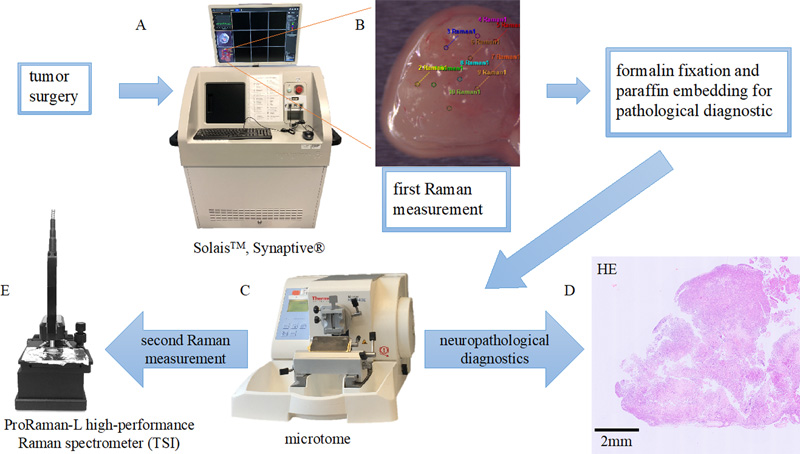
All tumor samples underwent neuropathological diagnostics (histology, immunohistochemistry, epigenetic and genetic analysis), performed by a board certified neuropathologist at the National Center of Pathology (NCP) at the Laboratoire nationale de santé (LNS, Luxembourg). The patient data were collected between 2018-2020; all patients were part of the INSITU® study (Nr. 201804/08), which has been authorized by the ‘Comité National d’Ethique de Recherche’ (CNER) and was performed according to the 'EU General Data Protection Regulation' GDPR15, as well as the World Medical Association (WMA) Declaration of Helsinki. 16 Data acquisition and tissue preparation Tumor samples of PCNSL biopsies and glioblastoma resections were collected during surgery / biopsy and put into vials with physiological saline solution. This intraoperative standard procedure prevents drying of the tissue and further degradation. For intraoperative data acquisition, we then put the tissue samples directly into an aluminum cup. The insignificant spectral attribution of aluminum allows unimpaired examination of biological tissue and minimizes influencing spectra from the surroundings. For the measurement itself, we used a robotized visualization and spectroscopic acquisition system (Solais™, Synaptive®, Toronto, Canada) enabling the determination of exact measuring points. All points were distributed uniformly on the sample; we included data that showed representative coverage of characteristic histopathological features of the subsequent pathologic diagnosis. Visible light images of the tissue and the selected measurement spots were acquired for comparison and traceability (Figure 1).
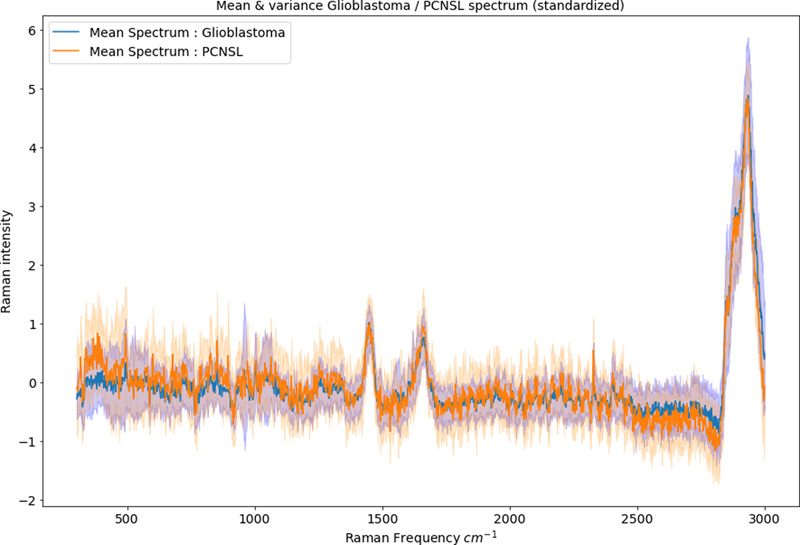
Figure 1. Overview about our workflow and the different Raman devices used for tissue examination. A) Tumor tissue is measured in the OR using the Solais™ device. B) Primary CNS lymphoma biopsy with intraoperatively set Raman measurement points (colored). C) FFPE tissue blocks are cut using a standard microtome and D) diagnosed by a neuropathologist (corresponding histological sample of the tissue in B). E) Consecutive cuts are mounted on a CaF2 slide and used for Raman measurements on processed tissue with the TSI ProRaman device. For neuropathological diagnosis, the tumor samples were then fixed in a formalin solution and subsequently embedded in paraffin; resulting FFPE blocks were cut with a standard microtome. The first cuts were used for routine diagnosis (Hematoxylin and eosin (HE) staining and immunohistochemistry). The consecutive cuts (7 μm) were left unstained and placed on a CaF2 (calcium fluoride; Crystran, Poole, UK) slide, allowing for microscopic examination of the section, which is not possible on aluminum with transmitted light. Due to a low amount of spectral background (precisely one single peak at 321 cm-1) the CaF2 substrate allows appropriate spectroscopical examination of even thin tissue fragments17. To reduce paraffin signals from residual wax within the tissue18, the slides were dewaxed using our in-house dewaxing protocol. This procedure includes a 60 min incubation period (at 60°C) to melt the paraffin and xylene/ethanol baths afterwards (2 x 15 min xylene; 3 x 2 min ethanol) to dewax the tissue chemically. First, areas with vital tumor cells were identified by means of light microscopy on the diagnostic HE slides (surrounding blood and fibrin residuals were excluded), then the corresponding area on the unstained CaF2 slides was marked (encircled) with a slide marking pen. The Raman measurement of the FFPE tissue was carried out repeatedly at several sites within the marked area using the ProRaman-L high-performance Raman spectrometer (TSI, Shoreview, USA). Additionally, see Figure 1 for an overview of our workflow. Raman Spectroscopy For data acquisition on intraoperative and FFPE tissue, two different Raman spectrometers were used. As our permanent tool in the operating room, the SOLAIS™ Raman system consists of an automatic data acquisition and visualization system. Via a robotized stage the tumor tissue can be exposed to the excitation laser (785 nm). The measuring points can be set individually on the tissue using a camera and an integrated coordination system. Acquisition parameters were set to 2 seconds with 6-30 averages for each measuring point. For the Raman measurement on FFPE tissue in the neuropathology unit, the portable TSI Raman spectrometer was used. It also provides an excitation laser at 785 nm and a CCD sensor; the used lens has a 7 mm working distance and a 100 μm laser spot size. With the ProRaman Reader software Version 8.3.6 (TSI, Shoreview, USA) acquired spectra can be displayed, baseline correction can be applied, and acquisition parameters can be defined (10 seconds, 30 averages, 90 mW) according to the request of the user. Data analysis and machine learning To reduce bias, data acquired at different time points and states of fixation were analyzed separately and divided into two data sets. To reduce the impact of patient dependent clustering, the same number of measurements for each patient was carried out in the majority of cases and all of them were recorded with the same acquisition time in the respective systems. Using a custom-made Python script, data cleaning was carried out on intraoperatively acquired Raman measurements (n = 75), including outliers and trend removal, as well as removal of artifacts and standardization of spectra. The mean spectra and the variance were visualized (Figure 2). Afterwards, three different machine learning algorithms were applied to distinguish between the two tumor entities and performance statistics were calculated (accuracy/sensitivity/specificity/ROC/PR curve). Starting with the linear algorithm of Logistic Regression we continued with Random Forest classification, which may be more favorable in this study due to non-independent data points within a Raman measurement. To further reduce the bias of patient-dependent clustering, Random Forest classifiers were trained with randomly split data distribution and a distribution split by patients; results were internally checked for comparability and suggested no relevant bias. As the third machine learning algorithm, we used XGBoost classification, in which parameters could be set individually.
Figure 2. Mean spectra and variance of the perioperatively acquired RS after standardization. The x-axis displays the wavenumbers (in cm-1) of the inelastic scattered photons (= the Raman shift) and the y-axis the corresponding intensity value. Figure 3 gives an overview of our data processing and statistical approach. We identified characteristic wavenumbers usable for spectral tumor discrimination and compared our findings with the underlying biochemical composition of the tissue. The Raman measurements acquired in the neuropathology department on FFPE tissue (second data set, n total = 45) were classified using a Random Forest algorithm. Due to a low number of patients, the data was not split into a training and an external validation set. In order to create a representative sample of the performance of the algorithms, particular attention was instead made on the internal validation (for example intrinsic re-validation based on bootstrap subsamples). Classification was validated using specific parameters of algorithm performance (AUROC, AUPR), as well as internal comparison of the performance based on randomly shuffling of measurement points with a patient stratified distribution. For a deeper technical insight in our way of machine learning (e.g., way of hyperparameter optimization) and a visualization of sample individual Raman spectra, see supplementary material.
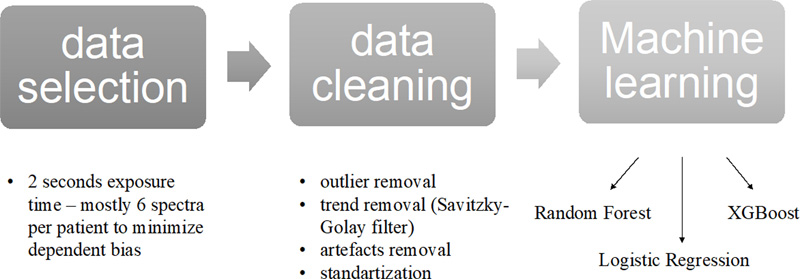
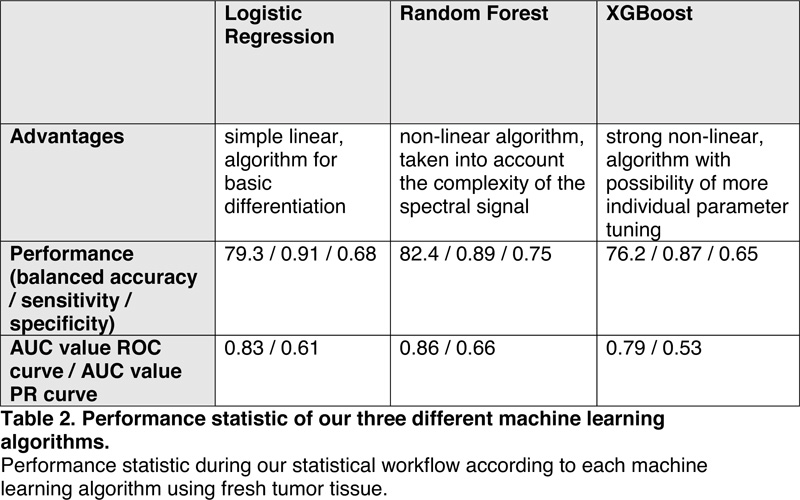
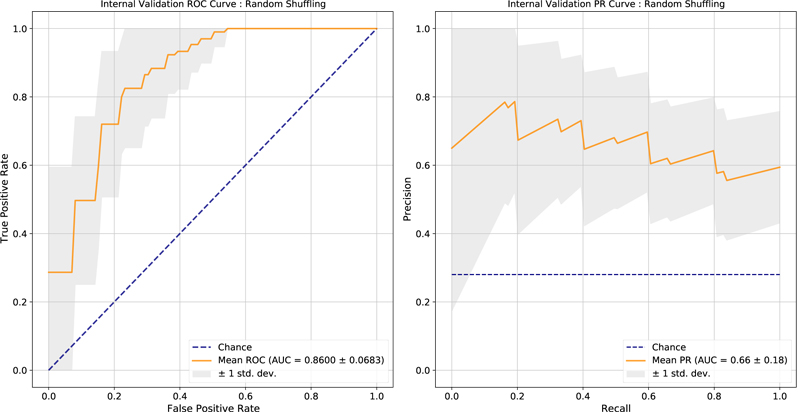
Figure 3. Workflow of data selection and machine learning for the intraoperative measurements. Results Efficient differentiation of distinct tumor entities on freshly resected tissue using linear and nonlinear machine learning algorithms For an accurate overview of the performance of each of our classifiers, see Table 2. Our trained Logistic Regression algorithm distinguishes with a balanced accuracy of 79.3% between the intraoperative measured PCNSL versus glioblastoma tumor tissue. Our Random Forest classifier discriminates between these two tumor entities with an overall accuracy of 82.4% (balanced), with a sensitivity of 0.89 ± 0.13 and a specificity of 75 ± 0.12. As an indicator of the classifier performance, we used the ROC (receiver operating characteristics) curve, in which each threshold is visualized according to the resulting specificity and sensitivity, and the AUC (area under the curve) value. The AUC value of the Random Forest classification for the PCNSL class was 0.86 ± 0.07 (Figure 4). Since the ROC curve may be biased due to an imbalance in the data set, we additionally used the PR (precision – recall) curve, where instead the ratio between PPV (Positive predictive value=precision) and Recall (=sensitivity) of every possible cut-off is displayed. Figure 4 shows our resulting PR curve with the resulting AUC value (0.66 ± 0.2) for the PCNSL class.
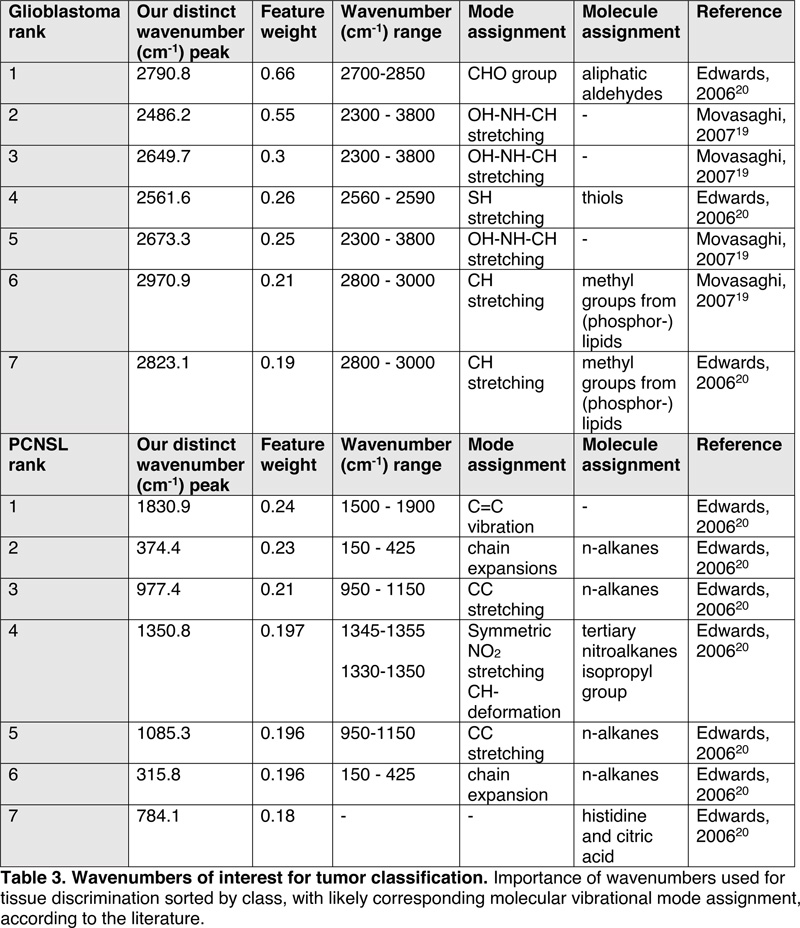
Figure 4. Left: ROC curve of Random Forest classification with AUROC value of 0.86 ± 0.07. Right: corresponding PR curve with an AUPR value of 0.66 ± 0.2. In order to evaluate our trained models in more detail, sensitivity and specificity were calculated for all algorithms and displayed in Table 2 according to the optimal threshold (maximizing sensitivity and specificity). For all resulting plots of statistic performance, see Supplementary material. Biochemical insights from spectral analysis In order to determine certain wavenumbers of Raman shift for more detailed analysis of the underlying biochemical substrates, we arranged wavenumbers of interest in descending order, according to the distinct tumor class and importance as a feature coefficient for the logistic regression. Table 3 displays the class-defining wavenumbers (i.e., positive and negative weights).
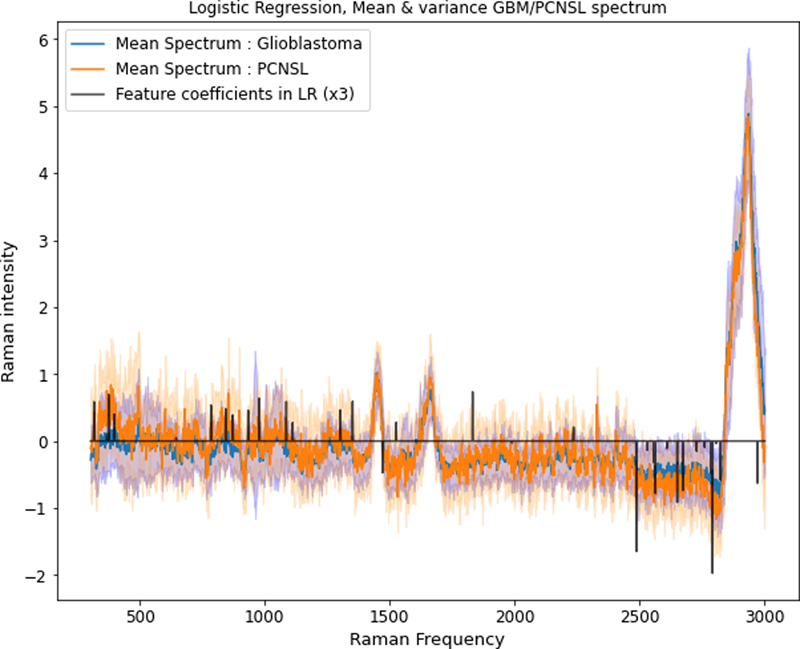
As wavenumbers with highest attribution for glioblastoma classification distinct peaks in the region 2450 to 3000 cm-1 can be detected (2791, 2486, 2650, 2562, 2673, 2971, 2823 cm-1); most of them likely representing CH stretching / OH - NH - CH stretching motions. In particular, peaks occurring in the region between 2700 to 3000 cm-1 are known to be related to underlying methyl groups from phospholipids19,20,21. On the contrary, the wavenumbers of interest for PCNSL classification cannot be assigned to the high wavenumber region. For PCNSL classification, the most important peak at 1831 cm-1 seems to be related to changes in the vibrational state of C=C compounds22; followed by bins at 374 cm-1 and 977 cm-1, respectively. Those latter bins are, according to the literature19-20, related to chain expansions and CC-stretching of n-alkanes. Other important peaks for PCNSL classification, notably 1085 cm-1 and 316 cm-1, may also be attributed to n-alkanes, whereas 784 cm-1 is caused by ring vibrations – as the spectral region from 600 to 800 cm-1 is mainly contributed to DNA molecules21. Figure 5 provides an overview of the wavenumbers with highest impact and their distribution in relation to the mean spectra of the examined tumor entities.
Figure 5. Feature importance for classification between primary CNS lymphoma and glioblastoma. The ascending bins are important for PCNSL detection; the descending bins for glioblastoma detection. See Table 3 for further explanation of the wavenumbers behind the frequency bins. Tumor classification on chemically aggressively treated formalin fixed paraffin-embedded tissue To analyze our measurements of the FFPE tumor tissue (second dataset with n = 45), we chose a Random Forest algorithm, as it showed the best performance on fresh tumor tissue in our analysis. Applying RS on histopathological proven tumor areas, we were able to establish a classifier with a balanced accuracy of 94%, a sensitivity of 0.93 ± 0.09 and a specificity of 0.95 ± 0.05. The AUROC value was 0.98 ± 0.03; the AUPR was 0.97 ± 0.05. For a deeper understanding of our results, we investigated the wavenumber regions used to classify between glioblastoma and PCNSL. We detected two regions (around 690 - 700 cm-1 and 2820 - 2890 cm-1) contributing to the classification performance. Pure paraffin wax was described to have spectra with peaks at 1133, 1296, and 1441 cm-1 23,18, but we also saw significant paraffin contribution in higher wavenumber regions, especially around 2820 to 2910 cm-1. Therefore, we suppose that, in addition to tissue-originating spectra, different and potentially characteristic amounts of residual paraffin or its reaction products with the tumor tissue may play a role, which, together with the possible influence of other materials related to the dewaxing process and experimental setup, needs to be considered when applying RS on FFPE tissue. Discussion In this study, we show that Raman Spectroscopy can be used as a non-destructive, label-free, fast technique for perioperative tissue classification to address the differential diagnosis between glioblastoma and primary CNS lymphoma at an early stage in the diagnostic workflow. We suggest RS as a future additional method in the OR. In the current application, the method would complement the biopsy procedure by giving a fast-feedback diagnostic tool that would allow for a direct treatment decision without waiting for lengthy histopathological examination. This could be advantageous, for example by giving the surgeon the opportunity to immediately proceed with surgical resection in the case of a diagnosis of glioblastoma. Additionally, the tool could be modified in such a way that an optical probe could replace the biopsy needle and yield an invasive but non-destructive stereotactic assessment of the tissue24-25. With our machine learning algorithms, the spectral data obtained from intraoperative tumor samples could be classified with linear (logistic regression) and nonlinear classifiers (Random Forest), with the latter displaying the highest potential with an overall balanced accuracy of 82.4%. To our knowledge, we describe for the first-time important wavenumbers to distinguish PCNSL from glioblastoma. The most important numbers for the detection of the WHO grade IV glioblastoma are mainly arising from the spectral region 2450 to 3000 cm-1, which is not in contradiction with previous findings. Zhou et al. 10 described three major peaks (2850, 2885, 2932 cm-1) in that specific region associated with healthy brain tissue, and the mainly phospholipid-derived peaks in the high-wavenumber region also showed the potential to distinguish between different WHO grades of gliomas. Our suggested peaks for primary CNS lymphoma most likely arise from vibrational changes in n-alkane molecules (316, 374, 977, 1085 cm-1) and partially also from backbone vibration of nuclei acids (784 cm-1). To our knowledge, these peaks have not yet been used for the differentiation between PCNSL and other tumor entities. So far, Shiramizu et al. 26 showed the possibility to discriminate between B-cell lymphoma cells and non-neoplastic lymphocytes by using RS and set the fingerprint wavenumber region to 600 – 1800 cm-1. Manago et al. 27 described certain Raman peaks of non-neoplastic lymphocytes and lymphoma cells (amongst other peaks in the region 700-800 cm-1). They differentiated between non-neoplastic B-cells and three B-cell lymphoma cell lines and tracked changes in the resulting Raman spectra during treatment application27. Furthermore, our results demonstrate the capability of RS to distinguish tumor entities on highly processed FFPE tissue in the neuropathology department. Here, precise regions of the tissue can be measured at the price of aggressive chemical treatment and spectral contamination by residual paraffin wax, fixation and washing agents. Since spectral regions initially attributed to paraffin may even play an influencing role in FFPE tissue classification, standardized dewaxing protocols and tried and tested processes are essential. A potential role for RS in the neuropathological toolbox is the examination of tissue fragments with little requirements for tissue integrity and neuropathological expertise. Recent studies investigate this possibility14. Future studies will show whether the use of this “spectral molecular fingerprint” holds true, and can also be applied on multiclass differentiation of several tissue entities. Due to a low prevalence of primary CNS lymphoma, the quantity of measurements in our data set remained limited. To deal with resulting imbalance and to minimize the impact of patient-dependent clustering, several efforts have been made. Not only were the number of measurements per patient correlated for both tumor groups to reduce insensitivity on imbalanced data, but we additionally evaluated our statistical algorithms with the balanced accuracy, the PR curve, and the corresponding AUPR value. While cross validation and bootstrapping techniques have been used to provide an indicative assessment of the model performance in future patients, external validation would be required to implement such a prediction model in clinical practice. Although our classification shows reasonably good results and a distinct separation of classes, for practical application, the number of reads of one single patient (and therefore the number of reads related to tumor tissue and not surrounding brain) is key. Therefore, multiple reads from one sample, which is also preferable to further reduce the bias of patient depending clustering, will improve the diagnostic accuracy in a real-world perioperative setting. Further studies are required to see if our proposed model of tissue classification holds true when using RS for the differentiation of other tumors, such as metastasis, and non-neoplastic lesions e.g., brain abscess. More extensive knowledge of the amount of tumor cells needed to get a tumor-specific Raman signal would aid the surgeon to find the tumor borders28. In a next step, RS may also be able to provide early insights into genetic / epigenetic alterations of tissue29; as well as insights into therapeutic effects of chemo- or radiotherapy27. RS might also be used in combination with additional spectral analysis such as IR (Infrared) or mass spectroscopy as complementary techniques30-31, and in addition as an image-forming technique32. Conclusion In conclusion, our study shows that machine learning algorithms can be successfully applied on spectroscopic data of brain tumor tissue and fulfill the need of early differential diagnosis between primary CNS lymphoma and glioblastoma to determine an individual clinical treatment at an early stage. Disclosures We thank the Fondation Cancer Luxemburg (grant to Frank Hertel, Michel Mittelbronn, Andreas Husch and Felix Kleine Borgmann) for the generous support. Michel Mittelbronn would like to thank the Luxembourg National Research Fund (FNR) for the generous support (PEARL P16/BM/11192868 grant). The authors declare no conflicts of interest. References
Copyright: © 2021 The author(s). This is an open access article distributed under the terms of the Creative Commons Attribution 4.0 International License (https://creativecommons.org/licenses/by/4.0/), which permits unrestricted use, distribution, and reproduction in any medium, provided the original author and source are credited, a link to the Creative Commons license is provided, and any changes are indicated. The Creative Commons Public Domain Dedication waiver (https://creativecommons.org/publicdomain/zero/1.0/) applies to the data made available in this article, unless otherwise stated. |