![]()
Frontline Learning Research Vol.8 No. 4 (2020) 37
- 51
ISSN 2295-3159
aBehavioural Science Institute,
Radboud University, The Netherlands
Article received 12 March 2020 / revised 20 May / accepted 18 June / available online 13 July
In technology empowered classrooms teachers receive real-time data about students’ performance and progress on teacher dashboards. Dashboards have the potential to enhance teachers’ feedback practices and complement human-prompted feedback that is initiated by teachers themselves or students asking questions. However, such enhancement requires teachers to integrate dashboards into their professional routines. How teachers shift between dashboard- and human-prompted feedback could be indicative of this integration. We therefore examined in 65 K-12 lessons: i) differences between human- and dashboard-prompted feedback; ii) how teachers alternated between human- and dashboard-prompted feedback (distribution patterns); and iii) how these distribution patterns were associated with the given feedback type: task, process, personal, metacognitive, and social feedback. The three sources of feedback resulted in different types of feedback: Teacher-prompted feedback was predominantly personal and student-prompted feedback mostly resulted in task feedback, whereas dashboard-prompted feedback was equally likely to be task, process, or personal feedback. We found two distribution patterns of dashboard-prompted feedback within a lesson: either given in one sequence together (blocked pattern) or alternated with student- and teacher-prompted feedback (mixed pattern). The distribution pattern affected the type of dashboard-prompted feedback given. In blocked patterns, dashboard-prompted feedback was mostly personal, whereas in mixed patterns task feedback was most prevalent. Hence, both sources of feedback instigation as well as the distribution of dashboard-prompted feedback affected the type of feedback given by teachers. Moreover, when teachers advanced the integration of dashboard-prompted feedback in their professional routines as indicated by mixed patterns, more effective types of feedback were given.
Keywords: Teacher dashboards; Feedback; Adaptive Learning Technologies
With the growing use of educational technologies, teacher dashboards are increasingly available in classrooms. While students are practising with educational technologies, dashboards provide teachers with concurrent information about students’ performance, pace, and progress (Van Leeuwen, Janssen, Erkens, & Brekelmans, 2014; Molenaar & van Schaik, 2016). Teachers can use dashboards with additional information to improve their feedback practices with dashboard-prompted feedback. This complements human-prompted feedback, which teachers initiate themselves and/or give in response to students’ questions. So far, most studies concerning teacher dashboards have primarily focused on how teachers understand dashboard information and translate this into action (Molenaar & Knoop-van Campen, 2019; Verbert, et al., 2014). To the best of our knowledge, how the source of feedback, e.g. human- versus dashboard-prompted feedback, is related to the type of feedback given has not yet been investigated. Nor is it known how teachers alternate between human- and dashboard-prompted feedback during teaching and whether this distribution pattern is related to the feedback given. In this paper, we postulate that dashboard-prompted feedback is given alongside human-prompted feedback and that the way teachers alternate between dashboard- and human-prompted feedback could be indicative of how well they have incorporated dashboards into their professional routines. We therefore examined: i) differences between human- and dashboard-prompted feedback; ii) how teachers alternated between human- and dashboard-prompted feedback (distribution patterns); and iii) how these distribution patterns were associated with the type of feedback given. By investigating all feedback and not only dashboard-prompted feedback, this paper takes a broad perspective on how dashboards are integrated into teachers’ feedback practices.
Providing feedback in classroom situations is a complex professional task (Roelofs & Sanders, 2007). Decisions on how to help students during learning are based on teachers’ pedagogical knowledge base, which consists of information on students’ knowledge and abilities, teachers’ perceptions of their students, teachers’ content knowledge combined with more general knowledge and beliefs about effective pedagogical practices (Meijer, Verloop, & Driel, 2001; Roelofs & Sanders, 2007). This pedagogical knowledge base therefore combines content, pedagogy and learners’ characteristics in such a way that teachers can take effective pedagogical actions (Gudmuindsdottir & Shulman, 1987). The practical impact of teachers’ professional knowledge base is visible in their professional routines, i.e., “patterns and routines of action, interaction, and sense-making” (Ballet, & Kelchtermans, 2009, p. 1153). Such routines are indicative of the way teachers apply their pedagogical knowledge base and also extend to feedback provided by teachers to their students.
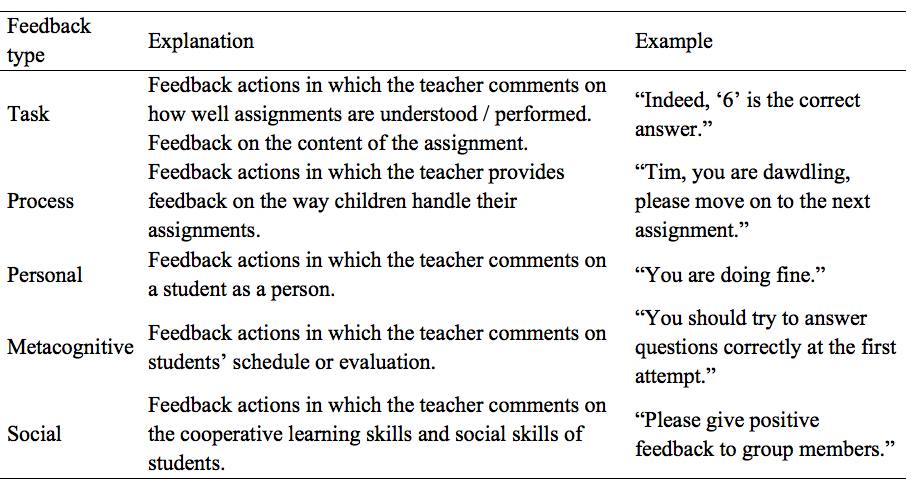
In order for teachers to provide appropriate feedback, it is important to identify students’ current level of performance and knowledge and target feedback at identified needs of the students (Wood, Brunner, & Ross, 1976). In the classroom context, feedback can be defined as information provided by the teacher regarding aspects of the students’ performance or behaviour (Hattie, & Timperley, 2007). Five types of feedback are often distinguished: process, metacognitive, task, social, and personal feedback (Hattie, & Timperley, 2007; Keuvelaar-van den Bergh, 2013). Process feedback gives information about students’ progress towards learning goals (Hattie, & Timperley, 2007), while metacognitive feedback helps students to control and monitor their learning (de Jager, Jansen, & Reezigt, 2005). These two types of feedback are the most effective types of feedback to improve learning as they increase students’ self-regulation and strategic handling (Hattie, 2012). Next, task feedback informs students about the state of their performance and helps them to reflect on their current understanding (Butler, & Winne, 1995; Hattie, & Timperley, 2007). As task feedback directly supports task execution, it is also supportive for learning (Keuvelaar-van den Bergh, 2013). Social feedback helps students to adequately collaborate with other students and is found to be important in collaborative learning settings to enhance learning outcomes (Keuvelaar-van den Bergh, 2013). Personal feedback, which supports students to improve their behaviour during learning, is considered less effective as it does not explain how student behaviour is related to task or process elements and therefore entails little direction to improve learning (Shute, 2008). Teachers are thus not only challenged to diagnose when students are in need of feedback, but also to select the appropriate and effective type of feedback accordingly.
Even though much has been written about feedback, less is known about which types of feedback teachers actually give during lessons (Bennett, 2011; Voerman, Meijer, Korthagen, & Simons, 2012). We found only two studies that investigated teachers’ actual feedback practices in classrooms. In these studies, observations were performed to identify the feedback types teachers gave in class. One study observed 32 teachers in primary education and showed that they mostly gave task and process feedback, whereas metacognitive, social, and personal feedback were hardly used (Keuvelaar-van den Bergh, 2013). This indicated that in primary education one of the most effective types of feedback, namely metacognitive feedback, is scarce. A second study (Voerman, Meijer, Korthagen, & Simons, 2012), in which 78 teachers in secondary education were observed, found that these teachers mostly provided students with non-specific feedback, for example providing personal encouragement such as “well done” and this did not give students directions to improve learning. Additionally, they also noticed that only 7% of all feedback given was process feedback. This is problematic, as process feedback is helpful for students to improve their learning. The authors concluded that teachers seldom provided effective feedback during classroom activities (Voerman, Meijer, Korthagen, & Simons, 2012). Combined, these two studies indicate that the type of feedback provided in classrooms is not always effective and that there are still considerable gains to be achieved with regards to teachers' feedback practices.
In addition to human-prompted feedback given by teachers on their own initiative (teacher-prompted feedback) or in response to students’ questions (student-prompted feedback), feedback can also be elicited from information teachers view on their dashboards. Teacher dashboards are increasingly used in K-12 education. These dashboards provide additional information on students’ performance, pace and progress and, as such, can be viewed as tools to augment teachers’ pedagogical knowledge base (Holstein, McLaren, & Aleven, 2017; Molenaar & Knoop-van Campen, 2019). During learning, software captures real-time data on learner performance which is immediately displayed to the teachers on their laptop or computer screen (dashboards). As such, dashboards provide teachers with organized visualizations giving information about individual students or the whole class. Class dashboards often provide an overview of all of the students’ correct and incorrect answers on problems. Individual dashboards mostly show individual students’ progress on different learning goals and the development of their knowledge and skills, while predictive analytics are also presented. However, merely providing this information on dashboards is not enough to impact teachers’ feedback practices.
Even though professional routines are flexible and develop continuously (Lacourse, 2011), actively and intentionally changing these professional routines by integrating new tools, such as dashboards, involves several stages of implementation. The learning analytics process model identifies four stages which teachers have to go through before dashboard data can impact their teaching practices (Verbert, et al., 2014). First, teachers need to become consciously aware of data on the dashboards and build understanding as to when they can use this information during teaching (awareness stage). Second, teachers have to be able to formulate questions for the data to answer (reflection stage). For example, “How can I see when a student needs help and which feedback is most appropriate?” Third, teachers have to analyse the data to answer these questions (sense-making stage). For example, “Lia makes a lot of mistakes; she needs additional help”. Fourth and last, teachers need to determine which response to the data is appropriate and fits their analysis of the situation best (impact stage). For example, “Lia does not seem to understand how to simplify mixed fractions, I should explain to her that she needs to extract the whole numbers first”. For dashboard data to be converted into feedback, teachers need to enact all stages of the learning analytics process model. During this process, they transform data into meaningful feedback actions to improve their teaching (Molenaar & Knoop-van Campen, 2019).
The learning analytics process model described above provides a theoretical model to understand how teachers translate data into action. However, how teachers apply this in their real-life professional routines remains unclear. There are only limited empirical insights into the actual impact of dashboards on teachers’ feedback practices in classrooms (Van Leeuwen, Janssen, Erkens, & Brekelmans, 2014). Some initial evidence has been found for the enactment of the learning analytics process model in practice; teacher awareness of dashboards was found to positively influence the feedback they gave to students (Molenaar & Knoop-van Campen, 2017a). When teachers consulted dashboards more often, they activated more and also more diverse knowledge in their pedagogical knowledge base. Furthermore, teachers who activated more diverse knowledge also gave more and more different types of feedback to students (Molenaar & Knoop-van Campen, 2019). Other studies have also provided evidence that dashboards changed teachers’ feedback practices. Teachers tend to provide more feedback when they are supported by dashboards compared to situations without dashboards (Van Leeuwen, Janssen, Erkens, & Brekelmans, 2014). In addition, regarding feedback allocation, one study showed that teachers who received real-time notifications about student performance directed their attention to low performing students more than they did without dashboards (Martinez-Maldonado, Clayphan, Yacef, & Kay, 2014). This in turn led to improvements in these students’ performance. Another study indicated that teachers also gave more feedback to good students who were struggling (Knoop-van Campen, Wise, & Molenaar, submitted.). This study also showed that dashboard-prompted feedback given to low performing students entailed equal amounts of task and process feedback while human-prompted feedback to this group consisted mostly of task feedback. Lastly, an augmented reality dashboard that indicated which students needed additional support while practising in an intelligent tutor system caused teachers to spend more time on students who showed poor productivity in learning, which consequently had a positive impact on their learning (Holstein, Hong, Tegene, McLaren, & Aleven, 2018). Thus, there is initial evidence that dashboard-prompted feedback is profoundly different from human-prompted feedback and can enhance learning outcomes.
Dashboards not only increased the amount of feedback given, but also elicited more effective types of feedback. In these studies, however, there was great variation in the frequency of dashboard-use and the type of feedback given during lessons (e.g. Martinez-Maldonado, Clayphan, Yacef, & Kay, 2014; Molenaar & Knoop-van Campen, 2017a, 2019). Given the positive benefits of teacher dashboards on students’ learning, it is important to examine how this variation can be explained. With the learning analytics process model and the importance of enacting all stages in mind, a possible explanation may be the level at which teachers incorporated dashboards into their professional routines. The way teachers alternate between human- and dashboard-prompted feedback in their daily classroom activities may reflect how well they have integrated dashboards into their professional routines and this may be related to how well they enact the stages of the learning analytics process model. Properly enacting the stages of the model enables teachers to optimally translate the dashboard data into practice. Better integration of the dashboard into their feedback practices could therefore be followed by more effective types of feedback (i.e., more specific and more responsive feedback) after consulting the dashboard.
There is initial evidence that dashboards have a positive impact on teachers’ feedback practices, but only when they effectively integrate the dashboard information into their professional routines. Previous studies have not specifically addressed dashboard-prompted feedback, as differences between dashboard- and human-prompted feedback and how teachers integrate dashboards into their professional routines have not been investigated. Therefore, we examined i) differences between human- and dashboard-prompted feedback; ii) how teachers alternated between human- and dashboard-prompted feedback (distribution patterns); and iii) how these distribution patterns were associated with the type of feedback given.
We expected that dashboard-prompted feedback would elicit more effective types of feedback (e.g., task and process feedback) than human-prompted feedback. Regarding the integration of dashboard-feedback into lessons, we expected to see two distribution patterns. First, when teachers have not (or not yet) fully integrated dashboards into their professional routines, they will likely use them only during a particular phase of the lesson. We hypothesize that this may result in a blocked pattern with dashboard-prompted feedback in one part of the lesson and human-prompted feedback in the other parts of the lesson. In contrast, when teachers become more proficient in using dashboards and have incorporated them into their professional routines, we expect more flexible dashboard use during the lesson. This may result in patterns displaying a mix of human- and dashboard prompted feedback (mixed patterns), in which teachers use teacher-, student- and dashboard-prompted feedback interchangeably. Better integration of dashboards into teachers’ professional routines is expected to result in more effective types of feedback being given after consulting the dashboards.
In total, 65 lessons were observed: 45 teachers were observed of whom 20 were observed twice. All lessons were 50 minutes long and taught in year group 2 (8-year-old students) to year group 6 (12-year-old students). Lessons were arithmetic or spelling lessons, dealing with topics on the regular school curriculum. The teachers were mostly female (75%), between 20 and 65 years old spread evenly across the age range and with a corresponding range of teaching experience between 2 and 30 years. Adaptive learning technology was used in these classrooms on a daily basis. While students worked on problems in the adaptive learning technology, real-time data was shown on the teacher dashboards. Teachers had between 1 and 3 years of experience in working with this technology.
2.2.1 Adaptive Learning Technology
The adaptive learning technology (ALT) used in this study called ‘Snappet’ , ran on tablet computers and is widely used for arithmetic and spelling across schools in the Netherlands (Molenaar & Knoop-van Campen, 2016). The arithmetic problems in the ALT were comparable to those done by students in regular classrooms. The ALT offered both adaptive and non-adaptive problems. Non-adaptive problems were pre-selected for a particular topic and all students in the class received the same non-adaptive problems in a lesson. The adaptive problems adjusted to the skills of the individual student. A derivative of the Elo algorithm adapted problems to the current knowledge level of the student (Klinkenberg, Straatemeier, & Van Der Maas, 2011). The algorithm worked with a student’s knowledge score; the representation of a student’s current level of knowledge on a particular topic. The knowledge score was calculated based on all problems that a student had worked on. Every problem in the system had a difficulty level which was automatically generated and updated by the system based on all of the student’s answers (Klinkenberg, Straatemeier, & Van Der Maas, 2011). Based on the student’s knowledge level, the ALT selected the next practice problem. The problem was selected in such a way that the student had a 75% probability of answering correctly.
2.2.2 Dashboards
Teachers viewed a visualization of students’ data on the dashboard (see Figure 1). The software captures real-time data on learner performance which was immediately displayed to the teachers on dashboards. The dashboard showed information on problems students had worked on. After a student’s name, it indicated how many problems students had solved (progress) and whether the problems were answered correctly (performance). The circles indicated problems answered. Green indicated a correct answer, red an incorrect response and combined green with red circles indicated a correct response on the second attempt. A blue open circle indicated the current problem. The first section of the dashboard dealt with non-adaptive problems that were part of the lesson, the second section indicated adaptive problems with the topic the students were working on in the heading above the circles. Finally, the progress indictor (human icon in front of students’ names) showed which students were making progress (green icon), not making progress (red icon) or were currently unknown (grey icon). The system defined these aspects based on an algorithm and visualized it with color-coding of these icons.
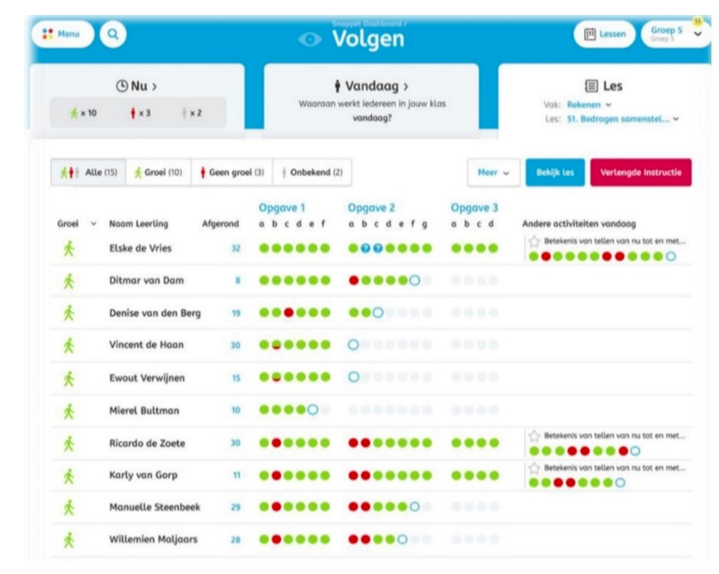
Figure. 1. Teacher Dashboard (anonymized)
2.2.3 The observations
The classroom observation app (Molenaar & Knoop-van Campen, 2017b) was used to track the sources and feedback types. Observations were performed by trained student assistants using the observation app. These observers were instructed to code all feedback actions during a lesson. For each feedback action, the source (teacher, student, dashboard) and the type (task, process, personal, metacognitive, and social feedback; see Table 1) were coded (Hattie, & Timperley, 2007; Keuvelaar-van den Bergh, 2013). Teachers accessed the dashboards on their computer screen, laptop, or tablet. Computers and laptops were situated in such a way that they were accessible to the teacher during lessons.
Table 1.
Types of feedback
2.3 Data analyses
To examine differences between human- and dashboard-prompted feedback, we ran a Chi-square with Bonferroni column proportion comparisons. The column proportions tests were used to determine the relative ordering of categories of the columns (type of feedback) in terms of the category proportions of the rows (source of feedback). To examine how teachers alternated between human- and dashboard-prompted feedback, we plotted feedback actions within one lesson on three distinct levels (teacher, student, dashboard) on the y-axis and all feedback actions on the x-axis (see Figure 4). A grounded approach was used to determine the codes on a subset of the sample. The subset of plots was inspected and this comparison lead to three categories: no dashboard-prompted feedback, blocked distribution pattern, or mixed distribution pattern (see Figure 4 in the Results section). The remaining plots were then coded by two independent coders, with a very high Cohen's Kappa (K = .93). Where the two coders disagreed, codes were discussed until agreement was reached. Chi-square analysis with Bonferroni column proportions were used to understand how these distribution patterns were associated with the type of feedback given.
In 65 lessons, 3,410 feedback actions were observed. The source was recorded for 3,330 actions (80 missing) and the type was recorded for 3,237 actions (173 missing). Overall, teacher-prompted feedback was most prevalent (1,869 times (56%)), followed by student-prompted feedback (867 times (26%)) and dashboard-prompted feedback (594 times (18%)) (see Figure 2a). Regarding all feedback actions, task feedback was given most often (997 times (31%)) closely followed by process feedback (980 times (30%)) and personal feedback (894 times (28%)). Both metacognitive feedback (199 times (6%)) and social feedback (167 times (5%)) were less frequent (see Figure 2b).

Figure 2a. Feedback source
Figure 2b. Type of feedback
First, we examined the association between source and feedback type. There was a significant association, χ2 (8, N = 3157) = 466.81, p < .001 (see Figure 3). The most likely feedback types differed depending on the source of the feedback. Below we further specify the results for teacher-, student- and dashboard-prompted feedback. Bonferroni column proportions were used to determine how the type of feedback was associated with the source of feedback.
When teachers triggered feedback themselves (teacher-prompted feedback), personal feedback (N = 692, 37%) was most frequently given followed by process (N = 477, 26%) and task feedback (N = 410, 22%). Social (N = 146, 8%) and metacognitive feedback (N = 126, 7%) were less frequently given. Bonferroni column proportions indicated a significant difference between all the feedback types in how often each feedback type was given. This means that personal feedback was most likely to follow when teachers prompted feedback, followed by process, task, social and metacognitive feedback.
When teachers reacted to students’ questions (student-prompted feedback), task feedback (N = 413, 48%) was most frequently given, followed by process feedback (N = 354, 41%). Personal feedback (N = 56, 7%), metacognitive (N = 33, 4%) and social feedback (N = 6, 1%) were less frequent. Bonferroni column proportions indicated that task and process feedback were equally likely to occur after students’ questions. Both task and process were more likely to be given in response to students’ questions than personal, social, and metacognitive feedback. Metacognitive feedback was more likely to be given than social feedback but less likely than the other types of feedback.
When teachers provided feedback after dashboard consultation (dashboard-prompted feedback), task feedback (N = 160, 36%) was most frequently given, followed by personal (N = 125, 28%) and process feedback (N = 124, 28%). Again metacognitive (N = 31, 7%) and social feedback (N = 4, 1%) were less frequent. Bonferroni column proportions indicated that except for social feedback, which was less likely to be given, the other four types of feedback were equally likely.
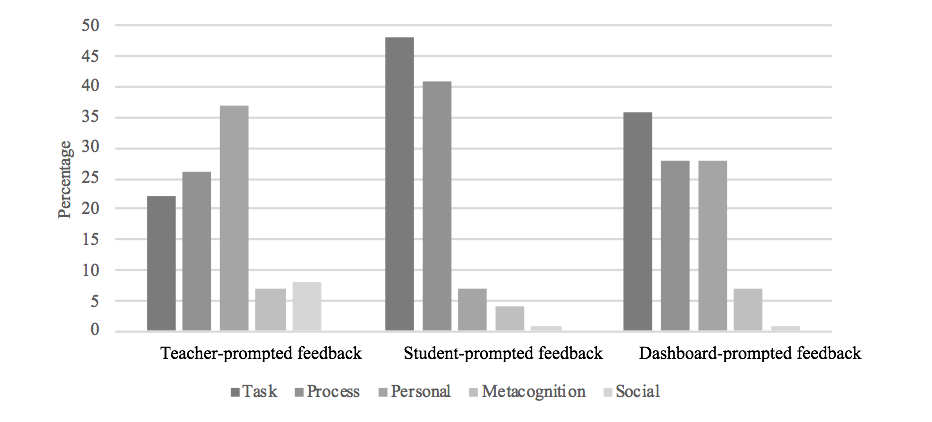
Figure 3. Feedback type for teacher-, student- and
dashboard-prompted feedback
Second, we examined how teachers alternated between human- and dashboard-prompted feedback. Thirteen lessons (20%) did not show any dashboard-prompted feedback (see Figure 4a for an example: there was no feedback prompted by the dashboard). Furthermore, we found two different distribution patterns: fifteen lessons (23%) showed a blocked distribution pattern (see Figure 4b for an example: dashboard prompted-feedback occurred in one or more chunks during the lesson), and thirty-seven lessons (57%) showed a mixed pattern where dashboard feedback was alternated with teacher and student feedback (see Figure 4c for an example: the feedback source interchanged during the lesson). Each figure shows all feedback actions in that specific lesson sequentially on the x-axis and in three rows dashboard-, student-, and teacher-prompted feedback on the y-axis.
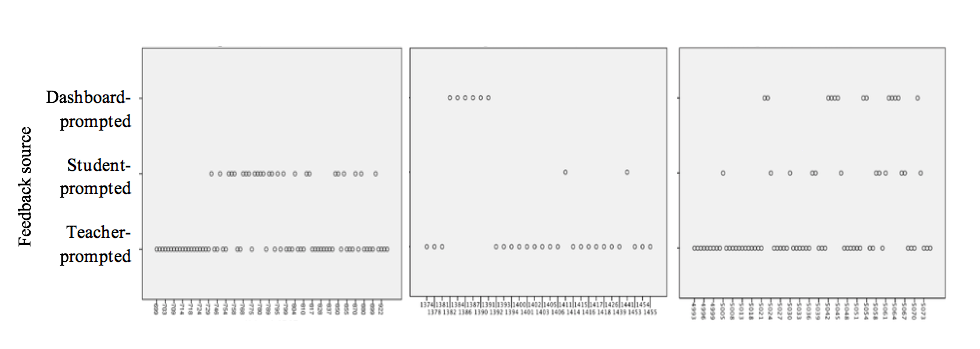
Figure 4a. No dashboard-prompted feedback Figure
4b. Blocked Pattern Figure 4c. Mixed Pattern
Third, we investigated how the two distribution patterns (blocked and mixed) were associated with the type of dashboard-prompted feedback given. There was a significant association between the distribution pattern and the feedback type, χ2 (4, N = 438) = 33.56, p < .001 (see Figure 5). The most likely feedback types differed between the two distribution patterns.
In lessons with a block pattern, most dashboard-prompted feedback was personal (N = 38, 36%), process (N = 26, 25%), or task feedback (N = 23, 22%). Some metacognitive (N = 18, 17%) and no social feedback (N = 0, 0%) was given. Bonferroni column proportions indicated that personal feedback was equally likely to be given as process, but more likely than task or metacognitive feedback. Metacognitive feedback was less likely to be given than task and process feedback, but just as likely as social feedback.
In lessons with a mixed pattern, most dashboard-prompted feedback was task (N = 135, 41%), process (N = 95, 29%), and personal feedback (N = 87, 26%). Some metacognitive (N = 12, 4%) and social feedback (N = 4, 1%) was given. Bonferroni column proportions indicated that all types of feedback, except for social feedback, were equally likely to be given. Social feedback was less likely to be given than the other types, but just as likely as metacognitive feedback.
To conclude, during blocked pattern lessons personal feedback was most likely to be given, whereas in mixed pattern lessons task feedback was most frequent. In Figure 5, we can observe a reversed pattern of task, process, and personal feedback in the blocked versus the mixed patterns.

Figure 5. Dashboard-prompted feedback per distribution
pattern
Dashboards have the potential to enhance teachers’ feedback practices and complement human-prompted feedback that is initiated by teachers themselves or students asking questions. However, such enhancement requires teachers to integrate dashboards into their professional routines. How teachers shift between dashboard- and human-prompted feedback could be indicative of this integration. Therefore, we examined i) differences between human- and dashboard-prompted feedback; ii) how teachers alternated between human- and dashboard-prompted feedback (distribution patterns); and iii) how these distribution patterns were associated with the type of feedback given. Results will foster new understanding on how dashboards are integrated into teachers’ feedback practices.
Regarding the first research question, results indicated that, in line with our expectation, feedback source and feedback type were related. Teacher-prompted feedback was predominantly personal and student-prompted feedback mostly resulted in task feedback, whereas dashboard-prompted feedback was equally likely to be task, process, or personal feedback. This indicates that dashboards induce more diverse feedback practices. Moreover, as teacher-prompted feedback constitutes mostly personal feedback which is less effective, we postulate that dashboard-prompted feedback may be more efficient. Moreover, dashboards stimulated the less frequently used process feedback, which is known to be positively associated with learning (Hattie, 2012). Whereas Van Leeuwen, Janssen, Erkens, and Brekelmans (2014) showed that dashboards changed the number of teachers’ feedback actions, we found that dashboards also changed the quality of feedback, by increasing the number of effective feedback practices.
Secondly, we investigated how teachers alternated between human- and dashboard-prompted feedback and whether so-called distribution patterns of dashboard-prompted feedback could be observed. The two expected distribution patterns were found. There were lessons in which dashboard-prompted feedback occurred in one part of the lesson and human-prompted feedback in another part of the lesson (blocked pattern). There were also lessons in which teachers used teacher-, student- and dashboard-prompted feedback interchangeably and where dashboard-prompted feedback was mixed with human-prompted feedback throughout the whole lesson (mixed pattern). These distribution patterns indicate that there was not only variation in the extent to which teachers used the dashboard, but also in how they integrated dashboards into their professional routines. Additionally, it is important to note that there was also a group of teachers (20%) who did not give any dashboard-prompted feedback. These teachers did not integrate the dashboards into their feedback practices.
Thirdly, we examined how the observed patterns of dashboard-prompted feedback were associated with feedback type. In line with our expectations, the type of dashboard-prompted feedback was found to be affected by the distribution pattern it occurred in. Dashboard-prompted feedback in blocked patterns was mostly personal feedback, while in mixed patterns task feedback was most prevalent. Ergo, higher levels of alternation of dashboard-prompted feedback with other feedback sources, leads to more task feedback. We postulate that different patterns might be indicative of differential development of teachers’ professional routines with regards to the analysis and application of dashboard information. Even though all teachers who use teacher dashboards enact the learning analytics process (Verbert, et al., 2014), the achieved depth and effectiveness of their awareness, reflection, sense-making, and implementation in their feedback actions differs between teachers. The patterns we observed visualized these differences in implementation and showed that along with integration of dashboard-feedback among their other feedback, teachers also gave more efficient types of feedback. Teachers who gave dashboard-prompted feedback in blocked patterns mostly gave personal feedback, which resembles the main feedback type also initiated by themselves. This may indicate that teachers recognized a specific student was in need of support, but only acted on a general level providing personal feedback. Still, teachers showing mixed patterns have developed their analytic skills to integrate the dashboard information within their existing knowledge base and consequently are able to follow up with task-related support (Butler & Winne, 1995; Hattie & Timperly, 2007). Hence, this informs a hypothesis that teachers go through different stages in learning how to integrate dashboards into their daily practices and that distribution patterns may be indicative of their current level of integration. Future research should further explore the relation between distribution patterns of dashboard-prompted feedback in lessons and teacher proficiency in these feedback practices.
The limitation of this study was that it was a naturalistic study of teachers’ feedback practices in lessons. There was no strict study design and hence cause and effect relations could not be detected. However, the study did provide ecologically validated data on how teachers in real life use and integrate dashboard data, which cannot be simulated in a lab setting. To understand teachers’ feedback actions in response to dashboards, it is vital to take into account their pedagogical knowledge base and thus investigate their professional routines in their class with children they know and work with on a daily basis.
Future research could investigate how the integration of dashboard-prompted feedback develops over time. As more integrated use of dashboards seems to relate to positive changes in feedback type, a training intervention could be envisaged, in which teachers would be taught to enhance their analytical abilities. This could support understanding and interpretation of the information on the dashboard and could enhance teachers’ capacities to integrate dashboard information into their existing pedagogical knowledge base. Future research in turn could investigate whether this enhances teachers’ feedback practices. It would also be useful to examine whether particular teacher characteristics, for example teachers' experience with the dashboard or their analytical skills, relate to the integration of dashboard-prompted feedback.
Practical implications of this study are fourfold. First, we now know that dashboards elicit more diverse feedback practices compared to human-prompted feedback. Hence, dashboards seem to sustain rich feedback practices especially with respect to inducing more process feedback. Second, we learned that different sources of feedback are related to different types of feedback. In professional training the function of different sources of feedback could be highlighted. Third, mixed patterns are more inductive to task feedback, hence teacher training could focus on how teachers integrate dashboard-prompted feedback into their overall feedback practices. Fourth, even though dashboard-prompted feedback is more diverse than human-prompted, both social and metacognitive feedback are underrepresented. Social feedback is less inherent to the context studied, but metacognitive feedback could be beneficial for students. Especially as young learners’ metacognitive skill have not yet fully developed (Veenman et al. 2006), it is important that teachers support the acquisition of these skills by providing feedback. Hence, dashboard designers should consider how to include information that can elicit metacognitive feedback.
To conclude, we showed that dashboard-prompted feedback is more diverse than feedback provided on teachers’ own initiative and in response to students’ questions. The way dashboard-prompted feedback is distributed in a lesson affected the feedback type teachers gave. This distribution may be indicative of teachers’ professional routines regarding dashboard usage and dashboard-prompted feedback and more specifically be indicative of the extent to which dashboards are integrated into educational practice. In technology empowered classrooms, dashboards thus provide the opportunity to optimize teachers’ feedback practices when integrated into their professional routines.
This work was supported by the NRO Doorbraak project awarded to Inge Molenaar (grant number: 405-15-823).
The authors wish to thank the students of the Radboud University for collecting the data, all the schools and teachers who participated in this study, and Dr. J.A. Houwman for proofreading the manuscript.
Ballet, K., & Kelchtermans, G. (2009). Struggling with
workload: Primary teachers’ experience of intensification. Teaching
and teacher education, 25(8), 1150-1157.
doi.10.1016/j.tate.2009.02.012
Bennett, R. E. (2011). Formative assessment: A critical review.Assessment
in Education: Principles, Policy & Practice, 18(1),
5-25. doi.10.1080/0969594X.2010.513678
Butler, D. L., & Winne, P. H. (1995). Feedback and
self-regulated learning: A theoretical synthesis. Review of
educational research, 65(3), 245-281.
doi.10.3102/00346543065003245
de Jager, B., Jansen, M., & Reezigt, G. (2005). The
development of metacognition in primary school learning
environments. School effectiveness and school improvement,
16(2), 179-196. doi. 10.1080/09243450500114181
Gudmundsdottir, S., & Shulman, L. (1987). Pedagogical content
knowledge in social studies. Scandinavian Journal of Educational
Research, 31(2), 59-70. doi.10.1080/0031383870310201
Hattie, J. & Timperley, H. (2007). The power of feedback. Review
of educational research, 77(1), 81-112.
doi.10.3102/003465430298487
Hattie, J. (2012). Visible learning for teachers: Maximizing
impact on learning. Routledge. doi.10.4324/9780203181522
Holstein, K., Hong, G., Tegene, M., McLaren, B. M., & Aleven,
V. (2018, March). The classroom as a dashboard: co-designing
wearable cognitive augmentation for K-12 teachers. In
Proceedings of the 8th international conference on learning
Analytics and knowledge (pp. 79-88).
doi.10.1145/3170358.3170377
Holstein, K., McLaren, B. M., & Aleven, V. (2017, March).
Intelligent tutors as teachers' aides: exploring teacher needs for
real-time analytics in blended classrooms. In Proceedings of
the Seventh International Learning Analytics & Knowledge
Conference (pp. 257-266). ACM.
doi.10.1145/3027385.3027451
Keuvelaar-van den Bergh, L. (2013). Teacher Feedback during Active
Learning: The development and Evaluation of a Professional
Development Programme.
Klinkenberg, S., Straatemeier, M., & van der Maas, H. L.
(2011). Computer adaptive practice of maths ability using a new
item response model for on the fly ability and difficulty
estimation. Computers & Education, 57(2),
1813-1824. doi.10.1016/j.compedu.2011.02.003
Knoop-van Campen, C.A.N., Wise, A.F., & Molenaar, I. (subm.).
The equalizing effect of teacher dashboards on feedback in a K-12
classroom.
Lacourse, F. (2011). An Element of Practical Knowledge in
Education: Professional routines. McGill Journal of
Education / Revue des sciences de l'éducation de McGill ,
46 (1), 73–90. doi.10.7202/1005670ar
Leeuwen, A. van, Janssen, J., Erkens, G., & Brekelmans, M.
(2014). Supporting teachers in guiding collaborating students:
Effects of learning analytics in CSCL. Computers &
Education, 79, 28-39.
doi.10.1016/j.compedu.2014.07.007
Martinez-Maldonado, R., Clayphan, A., Yacef, K., & Kay, J.
(2014). MTFeedback: providing notifications to enhance teacher
awareness of small group work in the classroom. IEEE
Transactions on Learning Technologies, 8(2),
187-200. doi.10.1109/TLT.2014.2365027.
Molenaar, I., & Knoop-van Campen, C. A. N. (2016, April).
Learning analytics in practice: the effects of adaptive
educational technology Snappet on students' arithmetic skills. In
Proceedings of the Sixth International Conference on Learning
Analytics & Knowledge (pp. 538-539).
doi.10.1145/2883851.2883892
Molenaar, I., & Knoop-van Campen, C.A.N. (2017a, September).
Teacher dashboards in practice: Usage and impact. In European
Conference on Technology Enhanced Learning (pp. 125-138).
Springer, Cham. doi.10.1007/978-3-319-66610-5_10
Molenaar, I., & Knoop-van Campen, C.A.N. (2017b, September).
How Teachers Differ in Using Dashboards: the Classroom Observation
App. Presented at the workshop “Multimodal Learning Analytics
Across (Physical and Digital) Spaces” at European Conference on
Technology Enhanced Learning. Springer, Cham.. Springer, Cham.
Molenaar, I., & Knoop-van Campen, C.A.N. (2019). How teachers
make dashboard information actionable. IEEE Transactions on
Learning Technologies, 12(3), 347-355.
doi.10.1109/TLT.2018.2851585.
Molenaar, I., & Schaik, A. van (2016) A methodology to
investigate classroom usage of educational technologies on
tablets. In: Aufenanger, S., Bastian, J. (eds.) Tablets in
Schule und Unterricht. Forschungsergebnisse zum Einsatz
digitaler Medien , pp. 87–116. Springer, Wiesbaden.
doi.10.1007/978-3-658-13809-7_5
Roelofs, E., & Sanders, P. (2007). Towards a Framework for
Assessing Teacher Competence. European journal of vocational
training, 40(1), 123-139.
Shute, V. J. (2008). Focus on formative feedback. Review of
educational research, 78(1), 153-189.
doi.10.3102/0034654307313795
Schwartz, R. M. (2005). Decisions, decisions: Responding to
primary students during guided reading. The Reading Teacher,
58 (5), 436-443. doi.10.1598/RT.58.5.3
Verbert, K., Govaerts, S., Duval, E., Santos, J. L., Assche, F.,
Parra, G., & Klerkx, J. (2014). Learning dashboards: an
overview and future research opportunities. Personal and
Ubiquitous Computing, 18(6), 1499-1514. doi.
10.1007/s00779-013-0751-2
Verloop, N., Van Driel, J., & Meijer, P. (2001). Teacher
knowledge and the knowledge base of teaching. International
journal of educational research, 35(5), 441-461.
doi.10.1016/S0883-0355(02)00003-4
Voerman, L., Meijer, P. C., Korthagen, F. A., & Simons, R. J.
(2012). Types and frequencies of feedback interventions in
classroom interaction in secondary education. Teaching and
Teacher Education, 28 (8), 1107-1115.
doi.10.1016/j.tate.2012.06.006
Wood, D., Bruner, J. S., & Ross, G. (1976). The role of
tutoring in problem solving. Journal of child psychology and
psychiatry, 17(2), 89-100.
doi.10.1111/j.1469-7610.1976.tb00381.x