![]()
Frontline Learning Research Vol.7 No. 2 (2019) 57
- 74
ISSN 2295-3159
a ITEC, imec research group at
KU Leuven, Etienne Sabbelaan 51, Kortrijk, Belgium
b Imec, Kapeldreef 75, Leuven, Belgium
Article received 27 August 2018 / revised 2 December / accepted 2 May / available online 10 May
Cognitive load theory is one of the most influential theoretical explanations of cognitive processing during learning. Despite its success, attempts to assess cognitive load during learning have proven difficult. Therefore, in the current study, students’ self-reported cognitive load after the problem- solving process has been combined with measures of physiological data, namely, electrodermal activity (EDA) and skin temperature (ST) during the problem-solving process. Data was collected from 15 students during a high and low complex task about learning and teaching geometry. This study first investigated the differences between subjective and physiological data during the problem- solving process of a high and low complex task. Additionally, correlations between subjective and physiological data were examined. Finally, learning behavior that is retrieved from log-data, was related with EDA. Results reveal that the manipulation of task complexity was not reflected by physiological data. Nevertheless, when investigating individual differences, EDA seems to be related to mental effort.
Keywords: cognitive load; physiological data; electrodermal activity; skin temperature; complex learning
As society and work environments become more complex it is increasingly relevant that learning environments mirror this complexity of the real world (Jonassen, 2000; Kirschner, Ayres & Chandler, 2011; Merrill, 2009; van Merriënboer, Kirschner & Kester, 2003). Nevertheless, a risk of complex learning environments is that the cognitive load imposed by the complex learning tasks is often excessive (Larmuseau, Elen & Depaepe, 2018; van Merriënboer & Sluijsmans, 2009). This phenomenon can be explained by Cognitive Load Theory (CLT) introduced by Sweller (1994). CLT uses current knowledge about the human cognitive architecture as a baseline to develop the instructional design for complex learning environments (Martin, 2014). CLT distinguishes three types of cognitive load, intrinsic, extraneous and germane load (Brunken, Plass & Leutner, 2003; Paas, Tuovinen, Tabbers & Van Gerven, 2010; Sweller, 2010). The level of intrinsic load is assumed to be determined by the complexity of the task or learning material and cannot be directly altered by the instructional designer. Extraneous load is mainly imposed by instructional procedures that are suboptimal, whereas germane load refers to the learners’ working memory resources available to deal with the complexity of the task or learning material (Sweller, 2010). Both extraneous and germane load can by facilitated by the instructional designer. An instructional designer should find a balance between keeping the matter sufficiently challenging but still within the cognitive capacities of the learner. Exceeding learners’ cognitive capacities can induce cognitive overload which could hamper learning. Specifically, this means that when the content is very complex due to high element interactivity (i.e., the amount of interrelations between knowledge, procedures, formulas etc.) which affects intrinsic load, instructional designers should keep extraneous load to a minimum (e.g., by providing clear instructions, provide embedded support) and subsequently foster germane load (Kirschner, Kester & Corbalan, 2011; Sweller, 2010).
In order to align the instructional design with students’ cognitive abilities, we should be able to measure cognitive load during complex learning. Former studies investigated cognitive load by using subjective measurements such as self-reported questionnaires (Boekaerts, 2017; Zheng & Cook, 2012). Those self-reported questionnaires have some important disadvantages (e.g., subjective measures, assumption of constant workload capacity, see section 2.2 ; DeLeeuw & Mayer, 2008; Raaijmakers, Baars, Schaap, Paas & van Gog, 2017; Spanjers, van Gog & van Merriënboer, 2012). As a result, more researchers show interest in using objective, real-time measures. Physiological measures provide objective data and can be unobtrusively collected while dealing with a task or learning material. Moreover, physiological data might provide an indication of changes in cognitive functioning throughout the process of solving a task (Boekaerts, 2017). Former studies already indicated that electrodermal activity (EDA) and skin temperature (ST) can be linked to different levels of task complexity (Haapalainen, Kim, Forlizzi & Dey, 2010; Nourbakhs, Wang, Chen & Calvo, 2012; Shi, Ruiz, Taib, Choi & Chen, 2007).
Nevertheless, it is unclear whether these physiological measures are related to self-reported intrinsic load, extraneous load, germane load and the overall mental effort during complex problem solving (Leppink, Paas, Van der Vleuten, Van Gog & Van Merriënboer, 2013). Therefore, in the current study, a high and low complex task was developed relating to the learning and teaching of geometry. The complexity of the task was manipulated by increasing the element interactivity for the high complex task (Sweller, 2010). In both tasks the same amount of support was provided. Data was retrieved using self-reported questionnaires to measure students’ experienced intrinsic load, extraneous load, germane load and mental effort. This distinction between the different types and mental effort was made because the different types of cognitive load concerns mental load induced by task complexity and instructional design, whereas mental effort invested covers the overall amount of cognitive processing for a particular task (Paas et al., 2003). The subjective measures were combined with physiological data through wrist-worn wearables containing both EDA and ST.
The purpose of this study was threefold. First, we investigated differences in the experienced cognitive load and the physiological data while solving a high and low complex task. Secondly, we examined whether individual differences of subjective measurements are related to individual differences of physiological data for the high and low complex task. Finally, we described whether peaks (i.e., EDA) and/or drops (i.e., ST) of physiological data are related to specific events (e.g., consultation of support) that took place during the problem solving process.
CLT is concerned with the instructional implication of the interaction between the complexity and instructional design of the learning material and human cognitive architecture (Sweller, 2010). Basically, the human cognitive architecture consists of an effectively unlimited long-term memory, which interacts with a working memory that has limited processing capacity (Kirschner et al., 2011; Sweller, 1994). Long-term memory contains cognitive schemata that are used to store and organize knowledge. Learning occurs when information is successfully processed in working memory and when new schemas are created or incorporated into consisting schemas in the long-term memory. As the processing capacity of the working memory is so limited, overcoming individual working memory limitations by instructional manipulations has been the main focus of CLT (Sweller, van Merriënboer & Paas, 1998). Cognitive load can be defined as a multidimensional construct representing the load that performing a particular task, imposes on the learners’ cognitive system (Paas et al., 2010). CLT claims that the cognitive load that learners experience can be intrinsic, extraneous or germane (Sweller, 2010). The level of intrinsic load for a particular task is assumed to be determined by the inherent difficulty of a certain topic and the level of element interactivity of the learning material in relation a student’s prior knowledge. The more elements that interact, the more intrinsic processing is required for coordinating and integrating the material and the higher the working memory load (De Leeuw & Mayer, 2008; Sweller, 2010). Working memory load is not only imposed by the intrinsic complexity of the material that needs to be learned, it can also be imposed by the instructional design. For instance, unclear instructional procedures can impose extraneous load. Extraneous processing means that the learner engages in cognitive processing that does not support the learning objective (De Leeuw & Mayer, 2008; Glogger-Frey, Gaus & Renkl, 2017; van Merriënboer & Sluijsmans, 2008; Sweller, 2010). Instructional design techniques that reduce extraneous load (e.g., fading support) should ensure that students devote less attention to irrelevant aspects of the task. Subsequently, more cognitive capacity can be allocated to the actual learning objective (Ciernak, Scheiter & Gerjets, 2009; Mayer & Moreno, 2010; Sweller, Ayres & Kalyugo, 2011). Meanwhile, intrinsic and extraneous load depend on the characteristics of the learning tasks or the instructional design, germane load is more concerned with the cognitive characteristics of the learner. More specifically, it refers to the working memory resources that are available to engage in knowledge elaboration processes and argumentation (Sweller, 2010). Accordingly, in order to optimize learning, learning tasks should be aligned with the learner’s cognitive capabilities (Schmeck, Opfermann, van Gog, Paas & Leutner, 2015; Sweller, 2010). Measuring cognitive load during complex learning should provide more insight into how to align instructional design with students’ cognitive capabilities.
Self-reports for measuring cognitive load are subjective measurements consisting of unidimensional and multidimensional scales. Unidimensional subjective rating scales have been used intensively in research and have been identified as reliable and valid estimators of cognitive load (Boekaerts, 2017; Chang & Yang, 2010; Leppink et al., 2013; Paas, 2003). The Paas’s nine-point mental effort rating scale has been most frequently used in cognitive load research (Chen et al., 2016; Paas, 1992). Paas’s nine-point mental effort rating scale requires learners to rate their mental effort immediately after completing a task (Paas, 1992). Mental effort refers to the cognitive capacity that is allocated to accommodate the demands imposed by a task (Paas et al., 2003). According to Paas, learners can introspect the amount of mental effort invested during a learning task. Subsequently, Paas claims that the learner’s assessment can be used as an index of overall cognitive load (Chen et al., 2016). Nevertheless, this unidimensional scale gives little insight into the influence of the complexity of the task and the influence of the instructional design on cognitive load (Boekaerts, 2017; De Bruin & van Merriënboer, 2017; Klepsch, Schmitz & Seufert, 2017; Leppink et al., 2013). Accordingly, Leppink et al. (2013) and Klepsch et al. (2017), developed a subjective cognitive load scale in which they used multiple items for each type of cognitive load in order to get more specific information about intrinsic load, extraneous load and germane load. Despite the frequent use of self-reported scales to assess cognitive load, some critiques have been raised. Firstly, subjective measurements are based on the assumption that students are able to introspect on their cognitive processes and accordingly are able to self-report on their experienced cognitive load (Boekaerts, 2017; Schmeck et al., 2015). Secondly, as subjective scales are often administered after the learning task, subjective scales do not capture variations in load over time. Taking into account these limitations, it might be more interesting to combine subjective measurements with real-time objective cognitive load information (Boekaerts, 2017; Chen et al., 2016; Zheng & Cook, 2012).
The physiological approach for cognitive load measurement is based on the assumption that any change in the human cognitive functioning is reflected in the human physiology. Subsequently, in contrast to subjective measurements, physiological measures are continuous and measured at a high frequency (e.g., every second) and with a high precision (Chen et al., 2016). Given the close relationship between cognitive load and neural systems, human neurophysiological signals are seen as promising avenues to measure cognitive load (Boekaerts, 2017; Chen et al., 2016). Former research has investigated the relationship between learners’ cognitive load and their physiological behaviour. The physiological measures that have been used to investigate cognitive load are among others heart rate by electrocardiography (ECG), brain activity by electroencephalography (EEG), eye activity (e.g., blink rate, pupillary dilation), EDA, heat flux and ST (Antonenko, Paas, Grabner & van Gog, 2010; Haapalainen et al. 2010; Scharinger, Soutschek, Schubert & Gerjets, 2015; Smets et al., 2018; Zagermann, Pfeil & Reiterer, 2016). Although a lot of physiological data, such as brain and eye activity, has been proven to be highly effective for measuring cognitive load, these types of physiological data often requires expensive sophisticated equipment that is highly obtrusive in measuring cognitive activities, especially in ecological valid contexts (Chen et al., 2016; Scharinger et al., 2015).
Possible solutions to collect physiological data in an unobtrusive way is by means of wrist-worn wearables. These wearables can easily capture different physiological data such as EDA and ST and are less expensive compared to more sophisticated measures of physiological data (Chen et al., 2016). EDA involves measuring the electrical conductance of the skin through sensors attached to the wrist. Skin conductivity varies with changes in skin moisture level (i.e., sweating) and can reveal changes in the sympathetic nervous system (SNS). The slowly changing part of the EDA signal is called the skin conductance level (SCL) and is a measure of psychophysiological activation. SCL can vary substantially between and within individuals. A fast change in the EDA signal (i.e., a peak) occurs in reaction to a single stimulus and is called galvanic skin response (GSR; Braithwaite, Watson, Jones & Rowe, 2013). Research has linked GSR variation to stress and SNS arousal. As a person becomes more or less stressed, the GSR increases or decreases respectively (Hoogerheide, Renkl, Logan, Paas & van Gog, 2019; Liapis, Katsanos, Sotiropoulos, Xenos & Karousos, 2015, Smets et al., 2018). Additionally, research has also linked GSR readings to cognitive activity, claiming GSR responses increase when more cognitive load is experienced (Ikehara & Crosby, 2005; Nourbakhs et al, 2012; Setz et al., 2010; Shi et al., 2007, Yousoof & Sapiyan, 2013). The study of Nourbakhs, Wang, Chen and Calvo (2015) captured GSR data of 13 and 16 participants from different reading and arithmetic tasks. The arithmetic tasks contained four difficulty levels, whereas the reading task contained three difficulty levels. Results of ANOVA indicated that both mean GSR and accumulated GSR yielded significantly different results throughout different task difficulty levels. Shi et al. (2007) investigated 11 subjects when dealing with four tasks divided in four distinct levels of cognitive load. Results revealed insignificant differences across the interactive models for mean GSR, but significant differences when using accumulated GSR. Yousoof and Sapiyan (2013) investigated whether cognitive load could be detected by mean EDA. In this experiment 7 subjects had to solve three different programming tasks that were different in terms of complexity. Yousoof and Sapiyan found no conclusive results for mean GSR, indicating that the variation among the subjects was very different during one task.
In addition to EDA, ST can also reflect changes in SNS. Research claims that acute stress triggers peripheral vasoconstriction, causing a rapid, short-term drop in skin temperature. Moreover, stress can also cause a more delayed skin warming, providing two opportunities to quantify stress (Herborn et al., 2015; Karthikeyan, Murugappan & Yaacob, 2012; Shusterman, Anderson & Barnea, 1997; Smets et al., 2018; Vinkers, et al., 2013). Little research has used ST to assess cognitive load. Nevertheless, the study of Haapalainen et al. (2010) investigated the cognitive load of 20 subjects through GSR and heat flux data (i.e., rate of heat transfer). The subjects had to solve six elementary cognitive tasks that differed in difficulty. Afterwards, Haapalainen et al. (2010) evaluated the performance of each of the features in assessing cognitive load using personalised machine learning techniques (i.e., Naïve Bayes Classifier). Results indicated that they did not obtain satisfactory results for GSR. By contrast, they did find that across all participants heat flux was shown to be an indicator of differences in cognitive load. The findings of former studies indicate that EDA and ST can indicate differences in cognitive load, but none of these studies related physiological data with self-reported cognitive load.
To conclude, physiological measures have some important advantages when compared to subjective measurements. These measures are more objective (i.e., not dependent on students’ perceptions), multidimensional (i.e., different physiological measures are sensitive to different cognitive processes), unobtrusive (i.e. no additional requirements), implicit (i.e., collect data while students are working on their tasks) and continuous (i.e. provide information of cognitive processes during learning). Nevertheless, it can be difficult to interpret physiological data. Therefore, it would be interesting to investigate whether there is a relationship between subjective measurements of cognitive load and physiological data. The following research questions are formulated:
• RQ1: Does the manipulation of the level of complexity of a task, based on element interactivity, result in differences in perceived cognitive load and mental effort when controlled for prior knowledge?
• RQ2: Does the manipulation of the level of complexity of a task, based on element interactivity, result in differences in physiological data, when controlled for prior knowledge?
• RQ3: Is there a relationship between individual differences in self-reported data and individual differences of physiological data for a high and low complex task? RQ4: Is there a relationship between the physiological data of one learner and his/her interactive behaviour during the problem solving process?
Participants were 15 future primary school teachers of which ten were female and five male (age between 18-24). All participants were first year bachelor students (i.e., second semester). The study was highly ecologically valid as the study was orchestrated by the students’ lecturer of the teaching mathematics course unit. Moreover, the intervention was integrated into the students’ study program (i.e., primary school teacher training). The intervention consisted of a within-subject design and was conducted online in the Moodle learning management system (LMS). The intervention took place in the auditorium of their faculty where students could solve the tasks individually on their own computer among their fellow students. This session was supervised by their lecturer and a researcher. Students first received an online questionnaire of which the timeframe (+/- five min.) to complete the first questionnaire was used as an adaption period in order to stabilize the wearable signals (i.e., baseline measurement). Next, all students had to solve a high complex and a low complex task on preparing a lesson in geometry as shown in Figure 1. In order to control for order effects, (a) half of the subjects were exposed to the high complex task during the first session and the low complex task during the second session, whereas for (b) the other half, the sequence was vice versa. More specifically, eight students started with the high complex task and seven students started with the low complex task.
The high and low complex tasks were developed in Moodle LMS. The scope of both tasks was designing a lesson preparation on the circumference of a circle for primary school children. This subject matter was not yet covered in previous lessons. Both tasks contained six elements where both aspects of pedagogical content knowledge; PCK (i.e., inductive teaching strategy, choose teaching materials to support your lesson, aligning the topic of the lesson with the Flemish curriculum and integration of differentiation in your lesson in the classroom) and content knowledge; CK (i.e., formula of the circumference of the circle) were addressed. The complexity of the high complex task was manipulated based on element interactivity (Sweller, 2010). In the high complex task students had to coordinate and integrate six elements consisting of CK and PCK in order to write a course preparation about the circumference of the circle, whereas the low complex task consisted of six questions where each element was addressed separately (see Figure 1). During both problems, the same support consisting of procedural and supportive information was provided. An example of procedural information can also be found in Figure 1 in the second box. Procedural information is provided just-in-time and concise. Supportive information is much more comprehensive and is comparable to the background theory. Both procedural and supportive information can be consulted by clicking on the words in italics.
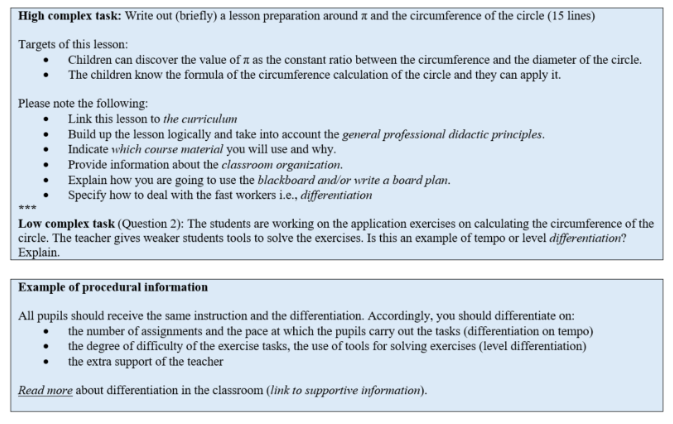
Figure 1. High complex task, question of the low complex task and an example of the procedural information
Information about students’ prior knowledge was gathered in the first semester during their examination. Students were tested on their knowledge of PCK (mean = 63.5%, SD = 19.7) and CK (mean = 72.2%, SD = 27.8). Content was (teaching) mathematics in general and geometry in particular. Examples of test-items can be found in Figure 2. All tests were corrected by the instructor of the course unit. We have no insight into the prior knowledge of one student who participated in the study, which means that we can include an indicator of prior knowledge for 14 students in the analysis.

Figure 2: Example questions of the prior knowledge test
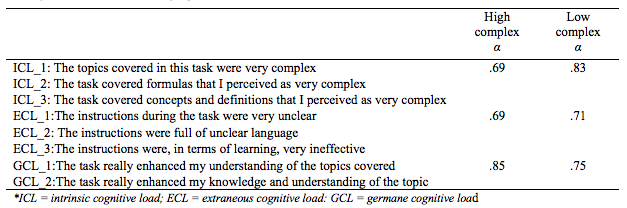
For the measurement of cognitive load a validated instrument developed by Leppink et al. (2013) was used for the measurement of intrinsic, extraneous and germane load. The questionnaire was translated into the specific context of the present study as shown in Table 1. The questionnaire consisted of a 7-point Likert scale (i.e., ranging from “totally disagree” to “totally agree”). Reliability was determined through Cronbach’s α in order to investigate the overall consistency of the constructs (Schreiber, Nora, Stage, Barlow & King, 2006). Confirmatory factor analysis (CFA) was not conducted due to the small sample size, but former research has validated the questionnaire and has proven that the questionnaire is reliable (Leppink et al., 2013). Additionally, the Paas’s nine-point mental effort rating scale was added to the questionnaire (Paas, 1992).
Table 1
Survey items and reliability of the constructs
To measure physiological data including EDA and ST, 15 students were monitored with wrist-worn wearables as shown in Figure 2. These wearables were able to sense GSR with a high dynamic range (.05-20µS) at the lower side of the wrist and the output was accurate within a frame of approximately 1 second. ST was acquired at the upper side of the wrist at a frequency of 32 Hz and the output was accurate within a frame of approximately 1 second at 0.1 °C. Before analysing the physiological data, a number of procedures were carried out. Firstly, a Confidence Indicator (CI), with values ranging from 0 to 1, monitors whether the sensor is correctly attached to the body. Values of CI lower than .80 were ignored as this indicates low quality of the data due to incorrect sensor attachment (+/- .01% per individual). Secondly, visual analysis of the signal was conducted for both EDA and ST. Artefacts were removed 20s before and after the artefact and an interpolation over the gap was performed. Thirdly, large differences in skin conductance among individuals can occur (Yousoof & Sapiyan, 2013). Therefore, to counteract the variation between subjects, the EDA and ST data of each individual participant were standardized, bringing the mean of each signal to 0 and its variance to 1. Fourthly, time domain features were analysed and mean EDA and ST were calculated as shown in Figure 3.
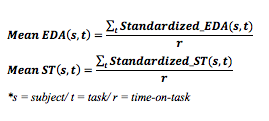
Figure 3. Standardized mean EDA and S
Log-data was retrieved from the Moodle Learning Management System (LMS). The LMS-system automatically keeps tracks of user activity (i.e., every min) and session. Log-data was divided into several events, namely: (1) start the task; reading instructions, (2) writing an answer, (3) consultation of support and (4) submission; reviewing the answer.
This study first investigated the differences between a high and low complex task for both the subjective measurements and physiological data (i.e., RQ1, RQ2). Therefore, both subjective measurements and physiological data were tested on the normality assumption. Results of the Shapiro-Wilk tests reveal that both subjective measurements and physiological measurements were normally distributed. As we were interested in the mean differences between the high and low complex task of both the self-reported and physiological data, controlled for prior knowledge (i.e., both PCK and CK), order effect (see section 3.1), we conducted a Linear Mixed Model (LMM) incorporating PCK, CK and order as fixed factors and measurement time as a repeated measure (two-level for RQ1 and three-level for RQ3). When conducting LMM, the Restricted Maximum Likelihood Method (REML) was applied (Baayen, Davidson & Bates, 2008). Based on findings of RQ1 and RQ2, this study investigated the individual differences in the self-reported data of cognitive load for a high and low complex task, and how this relates to individual differences in physiological data (RQ3). Cohen’s d was calculated when differences were significant in order to have insight into the effect sizes (LeCroy & Krysik, 2007). A bivariate correlation analysis was conducted in order to find relationships between physiological data and subjective measurements of cognitive load. Fourthly, as the advantage of physiological data is that it is measured continuously, this study investigated whether there are relationships between specific events (i.e., consultation of support) based on log-data and peaks (i.e., spontaneous fluctuations per s) of EDA and drops of ST (i.e., RQ4). Given the small sample size, the analysis more descriptive.
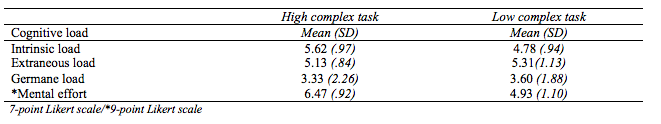
Descriptive statistics of the subjective measurements as shown in Table 2 reveal that students reported on average higher intrinsic load, extraneous load and mental effort during the high complex task in comparison with the low complex task. Results furthermore indicate that students reported higher germane load during the low complex task which was expected.
Table 2
Descriptive statistics of the subjective measurements of the high and low complex task
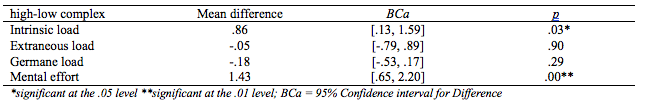
In order to investigate differences in the perceived cognitive load and mental effort (i.e., RQ1), LMM was conducted incorporating PCK, CK and ‘order effect’ as fixed factors and time as a two-level repeated measurement. Pairwise comparison of the different measurements of intrinsic load, extraneous load, germane load and mental effort are indicated in Table 3. Results reveal that intrinsic load differed significantly across phases. F(1,13) = 6.43, p = .03. Pairwise comparison reveals that intrinsic load was significantly higher (M = .86, p = .03) during the high complex task with Cohen’s d = .88. When investigating the fixed factors, there was no significant effect of both PCK, F(1,10) = .05, p = .82 and CK, F(1,10) = .43, p = .53. Moreover, no significant order effect was found F(1,10) = 12, p = 74. As expected, results reveal no significant difference for extraneous load across phases F(1,13) = 17, p = .69. Pairwise comparison reveals no significant mean difference (M = -.05, p = .90) between the high and low complex task for extraneous load. Results of the fixed effects reveal no significant effect of PCK F(1,10) = .04, p = .84, CK F(1,10) = .17, p = .69, and order F(1,10) = 1.58, p = .24. Results for germane load indicate no significant differences across phases F(1,13) = 1.21, p = .29. Pairwise comparison reveals no significant mean difference for germane load (M = -.18, p = .29) between the high and low complex task. Results of the fixed effects indicate no significant effects for PCK, F(1,10) = .00, p = .96 and CK, F(1,11) = .01, p = .93. Moreover, no order effect was found, F(1,10) = 1.39, p = .2. Finally, results revealed that mental effort was different across phases. Mean difference of mental effort between the high and low complex task was significant (M = 1.43, p = 00) in the predicted direction with Cohen’s d = 1.52. No significant effects of PCK, F(1,11) = 2.39, p = .15 and CK, F(1,11) = 2.84, p = .12. Additionally, no order effect, F(1,10) = .27, p = 62 was found.
Table 3
Pairwise comparison of subjective measurements controlled for prior knowledge (i.e., PCK, CK) and order effect
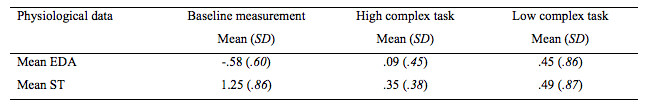
Descriptive statistics of the physiological data can be found in Table 4. Mean EDA is lower during the high complex task compared to the low complex task. Mean ST is lower during the high complex task.
Table 4
Descriptive statistics of the standardized physiological data
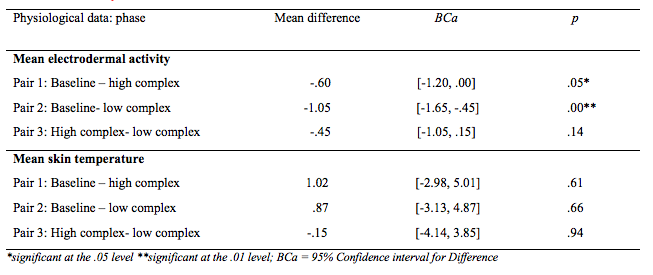
In order to investigate the differences of physiological data between the baseline measurement, high and low complex task (i.e., RQ2), LMM was conducted incorporating PCK, CK, order effect as fixed factors and time as a three-level repeated measurement. Results indicate that differences were found for mean EDA across the different phases F(2,26) = 6.56, p = .01. Pairwise comparison of the different measurements of mean EDA are indicated in Table 5. Results of pairwise comparison reveals that the mean difference between the baseline measurement and high complex task phase is significant in the predicted direction (M = -.60, p = .05) with Cohen’s d = .19. Moreover, the mean difference is significant between the baseline measurement and the low complex task (M = -1.05, p = .00) with Cohen’s d = .14. Results reveal that no significant mean difference was found between the high and low complex task (M = -.45, p = .14). Moreover, the mean difference was in the unexpected direction. When investigating the fixed factors, there was a non-significant main effect of both PCK F(1,10) = .18, p = .68 and CK F(1,10) = .81, p = .36. Additionally, there was a significant effect of order F(1,10) = 7.62, p = .02, which indicates an order effect.
No significant differences were found for mean ST across the different measurements, F(2,26) =.16, p = .85. Pairwise comparison reveals no significant mean differences between baseline measurement and the high complex task (M = 1.02, p = .61), baseline measurement and the low complex task (M = .87, p = .66), and between the high and low complex task (M = -.15, p = .94). Nonetheless, all mean differences were in the expected direction. When investigating the fixed effects, there was a non-significant main effect of both PCK F(1,10) = .00, p = .97 and CK F(1,10) = .12, p = .74. Additionally, there was no significant order effect, F(1,10) = .45, p = 52.
Table 5
Pairwise comparison of physiological data controlled for prior knowledge and order
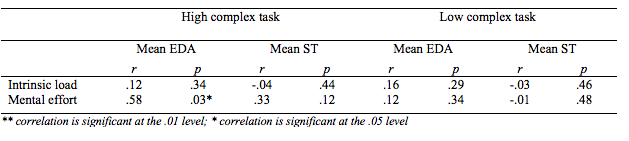
Results of RQ1 reveal significant differences for perceived intrinsic load and mental effort. RQ3 investigates the relationship between the individual differences of intrinsic load, mental effort and physiological data. Results are displayed in Table 6 and reveal that mental effort is significantly positive correlated with mean EDA (r = .58, p = .03) for the high complex task. Nevertheless, no significant positive correlation was found between mean EDA and mental effort for the low complex task. No significant results were found for ST.
Table 6
Correlations between standardized physiological data and subjective measurements for the high complex task and low complex task.
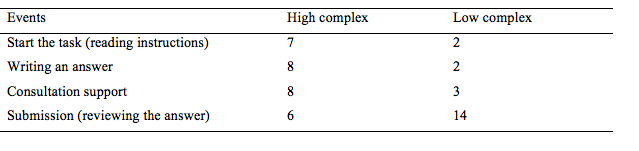
In the final RQ4, this study investigates the relationship between physiological data and specific events retrieved from log-data and EDA peaks. An example of such relationships is shown in Figure 4. Table 7 gives an overview of the amount of relationships between specific events and EDA peaks. In contrast to EDA, no conclusive relationships were found between ST (i.e., drops) and specific events. ST for most participants increased throughout the intervention as illustrated in Figure 5.
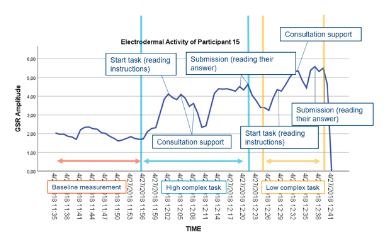
Figure 4. Electrodermal activity related to log-data of participant 15
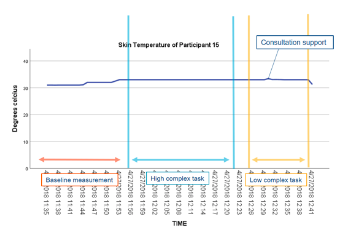
Figure 5: Skin temperature related to log-data of participant 15
Table 7
The relationship between specific events and EDA peaks
This study attempted to firstly investigate the difference of subjective measurements of cognitive load between a high and low complex task (i.e., RQ1). Results reveal that the students indicate higher perceived intrinsic load for the high complex task when compared with the low complex task. This indicates that the manipulation of complexity based on element interactivity was successful. Additionally, students indicated that the perceived mental effort was higher during the high complex task. Effect sizes of both intrinsic load and mental effort were high (>.80) indicating that the manipulation of complexity had an impact (LeCroy & Krysik, 2007). This reveals that students invested more mental effort into solving the high complex task in order to maintain performance at a constant level (Paas et al., 2003). This is also in line with CLT, since the high complex task was high in element interactivity and possibly required a lot of cognitive processing (Van Merriënboer & Sweller, 2005). No significant differences were found for extraneous load between both tasks. This finding was expected as the instructions for both tasks were of the same level of difficulty. Additionally, no significant differences were found for germane load, indicating that both tasks enhanced students’ understanding of the content at a similar level. This was in line with our expectations as the content and available support of both tasks was the same.
Secondly, this study aimed at investigating whether we can use physiological data to distinguish between the two complexity levels of the task. When investigating mean EDA, results reveal that significant differences were found between both tasks and the baseline measurement. These findings indicate that both tasks result in a higher mean EDA. Nevertheless, effect sizes were very small (< .20), indicating that task complexity only had a minimal impact on mean EDA (LeCroy & Krysik, 2007). Moreover, no significant differences were found for mean EDA between the high and low complex. These results are in line with the findings of the study of Haapalainen et al. (2010), which also revealed no significant differences for EDA between six tasks of different levels of difficulty. Moreover, against expectations, descriptive statistics reveal that mean EDA was higher during the low complex task, when compared with the high complex task. These unexpected findings may be induced by the order effect. This order effect may reduce a clear difference between the EDA during the high and low complex task. Moreover, visual analysis reveals that for the majority of all participants, skin conductance rises throughout the intervention (i.e., drift). Since, more participants had the low complex at the end, this might indicate that results are biased by drift. This indicates the need for the current study to also examine EDA peaks as these peaks are not affected by drift (RQ4). When investigating mean ST no significant mean differences were found for mean ST across all different phases. Nevertheless, descriptive statistics reveal that ST was higher during the baseline measurement period. Moreover, ST was higher during the low complex task compared with the high complex task. This could indicate that ST is related to task complexity as research indicated that ST declines relative to a trigger event (Ikehara & Crosby, 2005). Current findings indicate that mean EDA and mean ST might be indicators of changes of cognitive load, but cannot be used to detect differences in task complexity. Nevertheless, there is no clear link between ST and cognitive load. Accordingly, correlations between individual differences in the perceived intrinsic load, mental effort and physiological data for a high and low complex task are investigated (RQ3).
A third aim of this study was to investigate whether we can relate subjective measures of the perceived intrinsic load and mental effort (i.e., based on findings of RQ1) with physiological data (i.e., mean EDA and ST) during a high and low complex task. Findings reveal that mental effort positively correlates with mean EDA for the high complex intervention. Nevertheless, we did not find a significant correlation between mean EDA and mental effort during the problem-solving process of the low complex task. Results might also be influenced by the fact that skin conductance was rising throughout the intervention. In addition, most students first solved the high complex task. No significant correlations between mean ST and self-reported data were found. This finding could be due to the fact that ST shows a very slow rise and decline in temperature change relative to the trigger event. Therefore, it might be difficult to relate ST to self-reports (Ikehara & Crosby, 2005). Since, there seems to be a relationship between EDA and mental effort and since ST drops can be related to specific events, we investigated the relationship between physiological data and learning behaviour retrieved from log-data.
In order to investigate the relationship between physiological data and learning behaviour. Log-data was investigated and divided into four main events, namely, reading instructions, writing an answer, consulting support and reviewing the answer. Results reveal that there seems to be a relationship between specific learning behaviour and EDA peaks. Moreover, results reveal that more peaks were registered during the high complex task, when compared with the low complex task, which indicates a different result compared to RQ2. When investigating the intensity of the peaks, findings reveal that the peaks that are related to the events ‘submission’ are more intense. This might explain, besides the occurrence of drift, why mean EDA was higher during the low complex task. Possibly, results may have been influenced by the fact that the low complex task was presented as a test-format, which might induced more intensive peaks when students submitted their task. When investigating relations between peaks and events it seems that during the high complex task, peaks are more frequently related to cognitive processes (e.g., reading instructions, consulting support and writing) when compared with the low complex task (e.g., submission). For instance, when investigating the event ‘consultation of support’ more in detail, peaks were related to students (N = 4) watching a video that explains the circumference of a circle. This is line with previous research indicating that GSR responses are associated with effortful cognitive processing during multimedia learning (Antonietti, Colombo & Di Nuzzo, 2015). Additionally, hardly any peaks were found for the low complex task during writing, which is in line with the study of Mudrick, Taub, Azevedo, Price & Lester (2017). Mudrick et al. (2017) investigated multimedia learning and indicated that the lowest amount of GSR responses were retrieved when answering multiple choice questions, suggesting that this might require less cognitive processing. This finding is also in line with the study of Hoogerheide et al. (2018) indicating that mean EDA was significantly lower during the problem-solving process of a practice problem, when compared with teaching a practice problem in an authentic learning situation. These exploratory findings indicate that the intensity of EDA signals might be more related to the type of learning activities. In line with previous findings of RQ2 and RQ3, no conclusive results were found for ST. Nevertheless, on the basis of data visualisation of all students we could see that for the largest number of participants (i.e., 8 students), ST is lower during the high complex task, which is in line with findings of RQ2.
Despite the merits of the study in terms of indicating that individual differences in experienced mental effort can indicate individual differences in EDA, there are some important limitations that should be mentioned. Firstly, results must be approached carefully as multiple analyses on the same dependent variable were conducted which can increase the chance of committing a Type 1 error (Roth, 1999). Secondly, as we were investigating physiological data, we were obliged to implement a within-subject design. This is required when investigating skin conductance, as skin conductance can vary markedly between individuals (Braithwaite et al., 2013). Nevertheless, the within- subject design had some important disadvantages. Since the same learning materials were taught within both the high and low complex task, students might have learned from the previous task and therefore perceived the high complex task as less difficult. This is turn might have influenced skin conductance and skin temperature, and may be a reason why there was no clear difference between the high and low complex task. This problem can be addressed in future studies by addressing different topics. Moreover, future studies should offer more different tasks of different levels of complexity, and also create more conditions in order to increase the amount of measurements. This could provide a better understanding of possible correlations between mental effort and mean EDA. A third important limitation, when investigating skin conductance is drift, a continuous increase of the intensity of the signal. It is important to distinguish drift from important shifts in real tonic processes (Braithwaite et al., 2013). Nevertheless, this distinction between drift and real tonic processes is not always entirely clear. This emphasizes the need of an accurate baseline measurement. The baseline measurement in the current study could be optimized by giving the participants a moment of relaxation. Given the small sample size we decided not to remove data of participants. Instead, in this study we have additionally investigated the peaks of skin conductance (as these are no subject of drift) and related them to specific events in the learning environment. Nevertheless, it can be advisable to remove data of participants on the basis of drift in larger datasets. Moreover, a larger sample size would also allow us to investigate patterns between EDA peaks and specific events in the learning environment (e.g., reading instructions) while using quantitative methods. Finally, as the study did not take place in a lab setting but in the classroom of the students, a lot of confounding factors unrelated to cognitive load may cause clouds in the data such as a lecturer entering the classroom and students leaving the classroom when finished. These events are likely to degrade the accuracy of cognitive load measurement by GSR (i.e., EDA). Nevertheless, the ecological valid setting also has advantages such as authenticity of the results (Schmuckler, 2001). Moreover, as the content was part of students’ training program, students were encouraged to thoroughly solve the tasks, which is reflected in the task performance.
This study attempted to firstly investigate the difference of subjective measures of cognitive load and physiological data (i.e., mean EDA and ST) between a high and low complex task in an ecologically valid setting. Students indicated that they perceived higher intrinsic load during the high complex task and that the high complex task required more mental effort. This indicates that task complexity can be manipulated based on element interactivity. Nevertheless, complexity was not reflected by differences in physiological data (i.e., mean EDA and ST). Accordingly, in a next phase this study investigated correlations between perceived intrinsic load, mental effort and physiological data. Results revealed a positive correlation between mean EDA and mental effort during the high complex task. Nevertheless, no significant correlations were found for the low complex task. Preliminary results of a more descriptive analysis showed that peaks of EDA during the high complex task were more frequently related to cognitive processes when compared with the low complex task (i.e., submitting the task). The latter finding might explain the significant relationship between mental effort and mean EDA. Future research should replicate similar studies while using larger sample sizes to verify these findings. Additionally, the relationship between EDA and the type of learning behaviour (i.e., retrieved from log-data) should not be overlooked.
Antonenko, P., Paas, F., Grabner, R., & van Gog, T. (2010).
Using Electroencephalography to Measure Cognitive Load. Educational
Psychology Review, 22. 425-438.
doi:10.1007/s10648-010-9130-y
Antonietti, A., Colombo, B., & Di Nuzzo, C. (2015).
Metacognition in self-regulated multimedia learning: integrating
behavioural, psychophysiological and introspective measures. Learning,
Media and Technology, 40. 187-209.
doi:10.1080/17439884.2014.933112
Baayen, R. H., Davidson, D. J., & Bates, D. M. (2008).
Mixed-effects modeling with crossed random effects for subjects
and items. Journal of Memory and Language, 59. 390-412.
doi:10.1016/j.jml.2007.12.005
Boekaerts, M. (2017). Cognitive load and self-regulation: Attempts
to build a bridge. Learning and Instruction, 51, 90–97.
doi:10.1016/j.learninstruc.2017.07.001
Braithwaite, J., Watson, D., Jones, R., & Row, M. (2013). A
Guide for Analysing Electrodermal Activity (EDA) & Skin
Conductance Responses (SCRs) for Psychological Experiments. Psychophysiology,
49, 1017–1034.
doi:10.1017.S0142716405050034
Brunken, R., Plass, J. L., & Leutner, D. (2003). Direct
Measurement of Cognitive Load in Multimedia Learning. Educational
Psychologist, 38. 53-61. doi :
10.1207/S15326985EP3801_7
Chang, C. C., & Yang, F. Y. (2010). Exploring the cognitive
loads of high-school students as they learn concepts in web-based
environments. Computers and Education, 55. 673-680. doi:
10.1016/j.compedu.2010.03.001
Chen, F., Zhou, J., Wang, Y., Yu, K., Arshad, S. Z., Khawaji, A.,
& Conway, D. (2016). Robust Multimodal Cognitive Load
Measurement. Human-Computer Interaction Series.
doi: 10.1007%2F978-3-319-31700-7
Cierniak, G., Scheiter, K., & Gerjets, P. (2009). Explaining
the split-attention effect: Is the reduction of extraneous
cognitive load accompanied by an increase in germane cognitive
load? Computers in Human Behavior, 25. 315-324. doi:
10.1016/j.chb.2008.12.020
De Bruin, A. B. H., & van Merriënboer, J. J. G. (2017).
Bridging cognitive load and self-regulated learning research: a
complementary approach to contemporary issues in educational
research. Learning and Instruction, 51. 1-9. doi:
10.1016/j.learninstruc.2017.06.001
DeLeeuw, K. E., & Mayer, R. E. (2008). A Comparison of Three
Measures of Cognitive Load: Evidence for Separable Measures of
Intrinsic, Extraneous, and Germane Load. Journal of
Educational Psychology, 100, 223-234. doi:
10.1037/0022-0663.100.1.223
Glogger-Frey, I., Gaus, K., & Renkl, A. (2017). Learning from
direct instruction: Best prepared by several self-regulated or
guided invention activities? Learning and Instruction, 51.
25-35.
doi:10.1016/j.learninstruc.2016.11.002
Hoogerheide, V., Renkl, A., Fiorella, L., Paas, F., & van Gog,
T. (2018). Enhancing Example-Based Learning: Teaching on Video
Increases Arousal and Improves Problem-Solving Performance.Journal
of Educational Psychology, 211. 45-56. doi:
10.1037/edu0000272
Haapalainen, E., Kim, S., Forlizzi, J. F., & Dey, A. K.
(2010). Psycho-Physiological Measures for Assessing Cognitive
Load. Proceedings of the 12th ACM International Conference
on Ubiquitous Computing. doi:
10.1145/1864349.1864395
Herborn, K. A., Graves, J. L., Jerem, P., Evans, N. P., Nager, R.,
McCafferty, D. J., & McKeegan, D. E. F. (2015). Skin
temperature reveals the intensity of acute stress. Physiology
and Behavior, 1. 225-230. doi:
10.1016/j.physbeh.2015.09.032
Ikehara, C., & Crosby, M. (2005). Assessing Cognitive Load
with Physiological Sensors. Proceedings of the 38th
Hawaii International Conference on System Sciences. doi:
10.1109/HICSS.2005.103
Jonassen, D. H. (2000). Toward a design theory of problem solving.Educational
Technology Research and Development, 48. 63-85. doi:
10.1007/BF02300500
Karthikeyan, P., Murugappan, M., & Yaacob, S. (2012).
Descriptive Analysis of Skin Temperature Variability of
Sympathetic Nervous System Activity in Stress. Journal of
Physical Therapy Science, 24. 1341-1344. doi:
10.1589/jpts.24.1341
Kirschner, P. A., Ayres, P., & Chandler, P. (2011).
Contemporary cognitive load theory research: The good, the bad and
the ugly. Computers in Human Behavior, 27. 99-105. doi:
10.1016/j.chb.2010.06.025
Kirschner, F., Kester, L., & Corbalan, G. (2011). Cognitive
load theory and multimedia learning, task characteristics and
learning engagement: The Current State of the Art. Computers
in Human Behavior, 27 , 1-4. doi:
10.1016/j.chb.2010.05.003
Klepsch, M., Schmitz, F., & Seufert, T. (2017). Development
and validation of two instruments measuring intrinsic, extraneous,
and germane cognitive load. Frontiers in Psychology, 8.
doi:
10.3389/fpsyg.2017.01997
Larmuseau, C., Elen, J., & Depaepe, F. (2018). The influence
of students’ cognitive and motivational characteristics on
students’ use of a 4C/ID-based online learning environment and
their learning gain. In LAK'18:International Conference on
Learning Analytics and Knowledge, March 7–9, 2018, Sydney, NSW,
Australia. ACM, New York, NY, USA , 10 pages. doi:
10.1145/3170358.3170363
LeCroy, C. W., & Krysik, J. (2007). Understanding and
interpreting effect size measures. Social Work Research, 31.
243-248. doi:
10.1093/swr/31.4.243
Leppink, J., Paas, F., Van der Vleuten, C. P. M., Van Gog, T.,
& Van Merriënboer, J. J. G. (2013). Development of an
instrument for measuring different types of cognitive load. Behavior
Research Methods, 45. 1085-1072. doi:
10.3758/s13428-013-0334-1
Liapis, A., Katsanos, C., Sotiropoulos, D., Xenos, M., &
Karousos, N. (2015). Recognizing emotions in human computer
interaction: Studying stress using skin conductance. In
Lecture Notes in Computer Science (including subseries Lecture
Notes in Artificial Intelligence and Lecture Notes in
Bioinformatics). 255-262. doi:
10.1007/978-3-319-22701-6_18
Martin, S. (2014). Measuring cognitive load and cognition: metrics
for technology-enhanced learning. Educational Research and
Evaluation, 20. 592-621. doi:
10.1080/13803611.2014.997140
Mayer, R. E. (2014). Incorporating motivation into multimedia
learning. Learning and Instruction, 29.
171–173. doi:
10.1016/j.learninstruc.2013.04.003
Mayer, R. E., & Moreno, R. (2003). Nine ways to reduce
cognitive load in multimedia learning. Educational
Psychologist, 38. 43-52. doi:
10.1207/S15326985EP3801_6
Merrill, D. (2009). First principles of instruction. In
Instructional-Design Theories and Models, 50. 43-59. doi:
10.4324/9780203872130
Mudrick, N. V., Taub, M., Azevedo, R., Price, M. J., & Lester,
J. (2017). Can physiology indicate cognitive, affective,
metacognitive, and motivational self-regulated learning
processes during multimedia learning? Paper presented at
the Annual Meeting of the American Educational Research
Association (AERA), San Antonio, TX.
Nourbakhsh, N., Wang, Y., Chen, F., & Calvo, R. a. (2012).
Using galvanic skin response for cognitive load measurement in
arithmetic and reading tasks. Proceedings of the 24th
Conference on Australian Computer-Human Interaction OzCHI ’12
. doi:
10.1145/2414536.2414602
Paas, F. (1992). Training strategies for attaining transfer of
problem solving skills in statistics: A cognitive load approach. Journal
of Educational Psychology, 84, 429–434. doi:
10.1037/0022-0663.84.4.429
Paas, F., van Gog, T., & Sweller, J. (2010). Cognitive load
theory: New conceptualizations, specifications, and integrated
research perspectives. Educational Psychology Review, 2.
115-121.
doi: 10.1007/s10648-010-9133-8
Paas, F., Tuovinen, J., Tabbers, H., & Van Gerven, P. W. M.
(2010). Cognitive Load Measurement as a Means to Advance Cognitive
Load Theory. Educational Psychologist, 38. 63-71.
https://doi.org/10.1207/S15326985EP3801
Raaijmakers, S. F., Baars, M., Schaap, L., Paas, F., & van
Gog, T. (2017). Effects of performance feedback valence on
perceptions of invested mental effort. Learning and
Instruction, 51. 35-46. doi:
10.1016/j.learninstruc.2016.12.002
Roth, A. J. (1999). Multiple comparison procedures for discrete
test statistics. Journal of Statistical Planning and
Inference, 82. 101-117.
doi: 10.1016/S0378-3758(99)00034-8
Scharinger, C., Soutschek, A., Schubert, T., & Gerjets, P.
(2015). When flanker meets the n-back: What EEG and pupil dilation
data reveal about the interplay between the two central-executive
working memory functions inhibition and updating. Psychophysiology.
1293-1304. doi:
10.1111/psyp.12500
Schmeck, A., Opfermann, M., van Gog, T., Paas, F., & Leutner,
D. (2015). Measuring cognitive load with subjective rating scales
during problem solving: differences between immediate and delayed
ratings. Instructional Science, 43. 93-114. doi:
10.1007/s11251-014-9328-3
Schmuckler, M. A. (2001). What is ecological validity? A
dimensional analysis. Infancy, 2, 419–436. doi:
10.1207/S15327078IN0204_02
Schreiber, J. B., Nora, A., Stage, F. K., Barlow, E. A., &
King, J. (2006). Reporting structural equation modeling and
confirmatory factor analysis results: a review. The Journal
of Educational Research, 99, 323-338. doi:
10.3200/JOER.99.6.323-338
Setz, C., Arnrich, B., Schumm, J., La Marca, R., Tröster, G.,
& Ehlert, U. (2010). Discriminating stress from cognitive load
using a wearable eda device. IEEE Transactions on Information
Technology in Biomedicine, 14. 410-417. doi:
10.1109/TITB.2009.2036164
Shi, Y., Ruiz, N., Taib, R., Choi, E., & Chen, F. (2007).
Galvanic skin response (GSR) as an index of cognitive load. In
CHI ’07 extended abstracts on Human factors in computing systems
- CHI ’07 . doi:
10.1145/1240866.1241057
Shusterman, V., Anderson, K. P., & Barnea, O. (1997).
Spontaneous skin temperature oscillations in normal human
subjects. The American Journal of Physiology, 273.
doi: 10.1152/ajpregu.1997.273.3.R1173
Smets, E., Velazquez, E. R., Shiavone, G., Chakroun, I., D’Hondt,
E., De Raedt, … Van Hoof, C. (2018). Large-scale wearable data
reveal digital phenotypes for daily-life stress detection. Digital
Medicine, 67. doi:
10.1038/s41746-018-0074-9
Spanjers, I. A. E., Van Gog, T., & Van Merriënboer, J. J. G.
(2012). Segmentation of Worked Examples: Effects on Cognitive Load
and Learning.Applied Cognitive Psychology, 26. 353-358. doi: 10.1002/acp.1832
Sweller, J. (1994). Cognitive load theory, learning difficulty,
and instructional design. Learning and Instruction, 4.
295-312. doi:
10.1016/0959-4752(94)90003-5
Sweller, J. (2010). Element interactivity and intrinsic,
extraneous, and germane cognitive load. Educational
Psychology Review, 22. 123-138. doi:
10.1007/s10648-010-9128-5
Sweller, J., Ayres, P., & Kalyuga, S. (2011). Cognitive Load
Theory. Explorations in the Learning Sciences, Instructional
Systems and Performance Technologies. doi:
10.1007/978-1-4419-8126-4
Sweller, J., van Merrienboer, J., & Paas, F. (1998). Cognitive
architecture and instructional design. Educational Psychology
Review, 3. 251-196. doi:
10.1023/A:1022193728205
van Merrienboer, J. J. G., Kirschner, P. A., & Kester, L.
(2003). Taking the Load Off a Learner’s Mind: Instructional Design
for Complex Learning. Educational Psychologist, 38,
5–13. doi:
10.1207/S15326985EP3801_2
van Merriënboer, J. J. G., & Sluijsmans, D. M. A. (2009).
Toward a synthesis of cognitive load theory, four-component
instructional design, and self-directed learning. Educational
Psychology Review, 21. 55–66. doi:
10.1007/s10648-008-9092-5
Vinkers, C. H., Penning, R., Hellhammer, J., Verster, J. C.,
Klaessens, J. H. G. M., Olivier, B., & Kalkman, C. J. (2013).
The effect of stress on core and peripheral body temperature in
humans. Stress, 16. 520-520. doi:
10.3109/10253890.2013.807243
Yousoof, M., & Sapiyan, M. (2013). Measuring cognitive load
for visualizations in learning computer programming-physiological
measures. Ubiquitous and communication journal, 8.
1410-1426. Retrieved from :
https://pdfs.semanticscholar.org/bdbd/8af1870e956e4a727e2449897077266fa8e5.pdf
Zagermann, J., Pfeil, U., & Reiterer, H. (2016). Measuring
Cognitive Load Using Eye Tracking Technology in Visual Computing.
Proceedings of the Sixth Workshop on Beyond Time and Errors
on Novel Evaluation Methods for Visualization. doi:
10.1145/2993901.2993908
Zheng, R., & Cook, A. (2012). Solving complex problems: A
convergent approach to cognitive load measurement. British
Journal of Educational Technology, 43. 233-246. doi:
10.1111/j.1467-8535.2010.01169.x