Research Article
Data Literacy in the
Social Sciences: Findings from a Local Study on Teaching with Quantitative Data
in Undergraduate Courses
Patricia B. Condon
Assistant Professor, Research Data Services
Librarian
University of New Hampshire Library
Durham, New Hampshire, United States of America
Email: patricia.condon@unh.edu
Eleta Exline
Associate Professor, Scholarly Communication
Librarian
University of New Hampshire Library
Durham, New Hampshire, United States of America
Email: eleta.exline@unh.edu
Louise A. Buckley
Associate Professor, Social Sciences, Public Policy
& Government Information Librarian
University of New Hampshire Library
Durham, New Hampshire, United States of America
Email: louise.buckley@unh.edu
Received: 29 Apr. 2022 Accepted: 23 Nov. 2022
![]() 2023 Condon,
Exline, and Buckley. This is an Open Access article distributed under
the terms of the Creative Commons‐Attribution‐Noncommercial‐Share Alike License 4.0
International (http://creativecommons.org/licenses/by-nc-sa/4.0/),
which permits unrestricted use, distribution, and reproduction in any medium,
provided the original work is properly attributed, not used for commercial
purposes, and, if transformed, the resulting work is redistributed under the
same or similar license to this one.
2023 Condon,
Exline, and Buckley. This is an Open Access article distributed under
the terms of the Creative Commons‐Attribution‐Noncommercial‐Share Alike License 4.0
International (http://creativecommons.org/licenses/by-nc-sa/4.0/),
which permits unrestricted use, distribution, and reproduction in any medium,
provided the original work is properly attributed, not used for commercial
purposes, and, if transformed, the resulting work is redistributed under the
same or similar license to this one.
Data Availability: Due to the small, local sample used in
this research study, participants were not asked to agree for their data to be
shared publicly, so supporting interview transcripts are not available.
DOI: 10.18438/eblip30138
Abstract
Objective – The University of New Hampshire (UNH) Library
conducted an exploratory study of the pedagogical practices of social science
instructors at UNH who teach using quantitative data in undergraduate courses.
This study is connected to a suite of parallel studies at other higher
education institutions that was designed and coordinated by Ithaka S+R.
The
four aims of this study were to explore the ways in which instructors teach and
engage undergraduates in the social sciences using quantitative data; understand
the support needs of these instructors; develop actionable recommendations for
campus stakeholders; and identify opportunities for the development of
resources, services, or activities in the library to support the use of
quantitative data in the classroom.
Methods – For the UNH study, the
research team recruited eleven participants through convenience sampling for
one-on-one, semi-structured interviews. The study sample included lecturers,
assistant professors, associate professors, and full professors across seven
social science disciplines from the Durham and Manchester campuses.
Results – Courses using data
provide a unique opportunity for students to gain experience by working with
hands-on examples. The two overarching
themes identified speak to both the motivations of instructors who teach with data and the
challenges and opportunities they face: teaching with data for data literacy
and scientific literacy and teaching with data for statistical, data, and tools
skill building.
Conclusion – Data literacy is an important set of
competencies in part because of the quality and quantity of data students
encounter; they need to have the ability to critically evaluate data, methods,
and claims. This study directed attention to an area that had not previously
been examined at UNH and is an important first step toward creating greater
awareness and community of practice for social science instructors teaching
with data. The UNH Library offers research data services and is exploring new
ways of supporting data literacy. UNH has opportunities to create additional
supports for instructors and students that could improve student learning
outcomes. Such efforts may require cross-college or cross-department
coordination as well as administrative support.
Introduction
Teaching undergraduate students to work with data is
essential—not only for handling data in research-intensive fields but also for
gaining valuable skills for entering the workforce and as informed members of
society trying to interpret news stories and public policy. Incorporating data
use into the curriculum gives undergraduate students opportunities in the
classroom to learn data literacy skills ranging from finding, collecting, and
analyzing data to interpreting visualizations to effectively presenting an
argument using data. Because of data literacy’s corresponding relationship with
information literacy, librarians are key stakeholders in conversations to
foster data literacy education and instruction efforts across campus.
As the University of New Hampshire (UNH) Library
continues to develop its data services and information literacy programs,
including support for data literacy, understanding the local practices and
needs of instructors can help in making evidenced based decisions about
services. Additionally, informing campus stakeholders outside the library (such
as the office of Academic Technology, the Center for Excellence and Innovation
in Teaching & Learning, and college deans and department chairs) of
potential opportunities for interdisciplinary efforts to enhance instruction in
this area can lead to increased awareness of data literacy across campus.
Knowing more about teaching practices used for incorporating data use into the
curriculum can also support improved data literacy instruction and better
prepare undergraduates with necessary data-related skills.
To learn more about teaching with data on campus and
as part of a larger Ithaka S+R research project, librarians at the UNH Library
conducted a study of the pedagogical practices of social science instructors at
UNH who teach using quantitative data in undergraduate courses. Ithaka S+R
designed the project and invited participation from libraries. Each
participating library conducted a local research study using the methodology
established by Ithaka S+R. In this article, we summarize the findings from the
study conducted at UNH and discuss how the findings address the aims of the
study. This was an exploratory qualitative study that used one-on-one
semi-structured interviews. The goal of the study was to better understand
instructors’ undergraduate teaching practices related to the use of
quantitative data for meeting course learning objectives in the social
sciences.
Literature Review
The literature on teaching with data in the social
sciences is substantial and varied in topic. This review focuses on literature
that discusses characterizing and fostering data and statistical literacy,
instructional strategies for integrating quantitative skills into curricula,
and barriers to learning data concepts. A sizable portion of the studies
reviewed focus on Research Methods and Statistics courses, often in sociology,
although a cross section of social sciences disciplines is represented.
Data and Statistical Literacy
Data literacy
and statistical literacy are separate but related concepts. They overlap and
interact with the broader concepts of information literacy and scientific
literacy and with adjacent concepts such as scientific thinking (Hosein &
Rao, 2019), social scientific reasoning, and quantitative literacy (Caulfield
& Persell, 2006). Data literacy has typically been described as the ability
to understand data and representations of data, to draw and support
conclusions, and to evaluate claims, and it may extend to functional use of
data such as data collection, analysis, and interpretation (Carlson et al.,
2011; Wolff et al., 2016). In disambiguating statistical literacy and data
literacy, Wolff et al. (2016) define statistical literacy as assessing the
validity of statistics being presented but with an awareness of the processes
by which statistics and associated visualization were created. In this way,
data literacy informs statistical literacy.
Instructional Strategies
Instructors who
teach with data employ an array of pedagogical strategies to foster students’
data literacy skills and knowledge of discipline-specific methodologies. Many
of these strategies fall into the broad categories of active learning,
experiential learning, and student-centred learning that rely on engaged
student participation in the learning process. Examples include student-led
creation of learning materials that can then feed back into the curriculum
(Clark & Foster, 2017), working in collaborative groups that aim to enhance
learning through discussion and accomplishing shared project goals (Caulfield
& Persell, 2006; Lovekamp et al., 2017), collecting data or analyzing
available data (Lovekamp et al., 2017), or conducting data projects in
partnership with community organizations (Nurse & Staiger, 2019;
Wollschleger, 2019). Neumann et al. (2013) suggest that the use of real-world
data enhances the significance of the course experience for students.
Additional instructional strategies include using data analysis modules or labs
(Fellers & Kuiper, 2020), surveying members of a course and analyzing the
resulting data (Brown, 2017), using games (Lawrence, 2004), and data mining
(Hartnett, 2016).
Barriers to Learning
Statistical
anxiety and math anxiety are frequently discussed as barriers to learning in
courses using data. Summarizing the literature that defines these associated
phenomena, Cui et al. (2019) state that math anxiety has to do with the
manipulation of mathematical symbols, while statistical anxiety has to do with
understanding the language used to describe and interpret data within
statistics. These anxieties are overlapping in definition and tend to coexist
in individuals (Cui et al., 2019). Other studies found statistical anxiety to
be related to student perceptions of past math performance, insufficient math
background (Condron et al., 2018; Rode & Ringel, 2019), other types of
academic anxiety, and self-concept (beliefs about one’s intrinsic abilities)
around quantitative skills (Faber & Drexler, 2019; MacArthur, 2020). Faber
and Drexler (2019) also found a connection between statistical anxiety and
student beliefs about the usefulness (utility value) of learning statistics,
which they suggest can be addressed by emphasizing the practical and vocational
application of such skills.
Reviews of the
empirical evidence find that the negative relationship between statistical
anxiety and academic performance may be overstated (MacArthur, 2020; Ralston et
al., 2016) and require additional study to establish causation (Filiz et al.,
2020). Instructors may attribute hesitancy to work with data as the result of
insufficient math preparation or anxiety when the issue is a preference for
non-mathematical methods (Chamberlain et al., 2015). Providing math and
statistics support, such as drop-in consultations and peer tutoring, can help
overcome these anxiety barriers (Cantinotti et al., 2017; Elbulok-Charcape et
al., 2019; Intepe & Shearman, 2020). A survey-based assessment of a project
implementing the American Sociological Association’s and Social Science Data
Analysis Network’s Integrating Data Analysis project modules (see Hilal
& Redlin, 2004) into the curriculum at Lehman College identified the
removal of barriers, such as insufficient math skills, and a well-sequenced
curriculum as key factors in teaching quantitative concepts (Wilder, 2010).
Aims
This review of the literature highlights that
teaching with data in social science courses is a valued pedagogical approach
for improving data literacy skills in undergraduates. The UNH study investigates
local pedagogical practices and instructor needs to inform the augmentation of
services on campus. The aims of this study are to
1.
explore the ways in which instructors
teach and engage undergraduates in the social sciences using quantitative data;
2.
understand the support needs of these
instructors;
3.
develop actionable recommendations for
campus stakeholders; and
4.
identify opportunities for the
development of resources, services, or activities in the library to support the
use of quantitative data in the classroom.
Methods
The study
undertaken at UNH was connected to a suite of parallel studies conducted
locally at other higher education institutions. Ithaka S+R, a not-for-profit
research and consulting organization that supports academic, cultural, and
publishing communities, coordinated this multi-institutional effort. Ithaka S+R
conceptualized and designed the research project “Teaching with Data in the
Social Sciences,” including developing the methodology and providing local teams
guidance on conducting the project at their institutions (Cooper, 2019). After
obtaining IRB approval, the UNH research team carried out the research at our
institution, including recruitment of participants, data collection and
processing, and analysis and interpretation of our dataset to identify local
themes (see Condon et al., 2021 for a detailed methodology).
Data Collection
UNH is a
medium-sized flagship Land, Sea, and Space Grant research university that was
established as an agricultural and mechanical arts school in 1866. UNH enrolls
around 15,000 students, with approximately 12,000 undergraduates and 3,000
graduate students across three campuses: Durham, Manchester, and the UNH
Franklin Pierce School of Law in Concord. The College of Liberal Arts (COLA) on
the Durham campus houses most of the social science disciplines; however, there
are social science disciplines represented in all the other colleges and on the
Manchester campus. COLA has the largest enrollment of undergraduates with over
3,100 enrolled in spring of 2022.
The study sample
at UNH, recruited through convenience sampling, included eleven lecturers,
assistant professors, associate professors, and full professors across seven
social science disciplines on two campuses who engaged in teaching
undergraduate students to work dynamically with quantitative data (e.g.,
collecting data through social science research methods, finding existing data
to address a research question, using software tools to analyze data, and
drawing conclusions from data). We conducted and recorded one-on-one interviews
online via Zoom, a video-conference software, during the fall of 2020. All
research team members were trained on the informed consent process and
interview guide to ensure consistency across interviews. Recorded interviews
were transcribed by a third party and de-identified by the research team.
Data Analysis
After the
interviews were transcribed and de-identified, the research team conducted
qualitative coding of the transcripts based on a coding process using grounded
theory methodology that was recommended by Ithaka S+R (Strauss and Corbin,
2014). Using the qualitative analysis software NVivo, coding and analysis were
done through an iterative process (see Figure 1). All three team members
conducted initial open coding on the same set of three interview transcripts to
identify emergent codes in the data (phase 1). The team discussed and compared
the initial codes, selected several core themes that emerged from the open
coding, and determined a final set of focused codes (phase 2). Once coding of all interviews was complete, the team
identified overarching themes that emerged from the focused coding (phase 3)
and used these to address the aims of the study (phase 4).

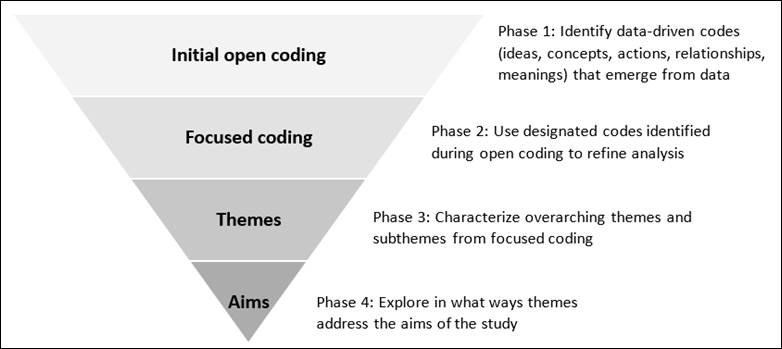
Figure 1
Qualitative
coding process used by UNH research team.
The following
focused codes developed in phase 2 were used to analyze all transcripts:
·
Learning objectives.
Comments and reflections about learning objectives instructors have defined as
desired outcomes for their students within courses.
·
Challenges understanding data.
Comments and reflections about challenges students experience in understanding
data concepts and working with data.
·
Student prior learning.
Comments and reflections about expected preparation at the high school level or
college level prior to the data course; student skills or viewpoints brought to
the data course; perceived student anxiety about math or science; perceived
student abilities with mathematical concepts or skills; student motivation; and
perceived student challenges with basic software, technical familiarity, and
access.
·
Locating and providing data for use.
Comments and reflections about finding datasets for use in teaching, qualities
of data that instructors look for, common sources for usable data, and
challenges of teaching with data.
·
Support outside the classroom (for
both students and instructors). Comments and reflections about where students
go for support regarding data-related questions or needs outside the classroom.
Comments and reflections about professional development for instructors around
teaching with data and learning new methodologies and tools.
Results
From the focused coding, two overarching themes emerged that spoke to the
motivations of instructors for teaching with data and the challenges and
opportunities they face. Table 1 presents the themes and subthemes that we
derived from the focused coding.
Table 1
Themes and Subthemes That Emerged From the Coding
|
Phase 3: Themes |
Phase 3: Associated subthemes |
Phase 2: Focused codes from which themes/subthemes were
derived |
|
Teaching with data for data and scientific literacies |
|
|
|
Teaching with data for statistical, data, and tool skill
building |
|
|
Teaching With Data for Data and Scientific Literacies
The theme
“teaching with data for data and scientific literacies”
represents a desire among participants to introduce or strengthen a broad set
of foundational skills that they believe students need to be successful. These
skills include a wide range of competencies connected to critical thinking,
from essential information and data literacies to understanding scientific
methodologies and their underpinnings. This theme has three subthemes: students
as consumers of data, students
interpreting data, and students learning the scientific method.
Students as Consumers of Data
Although data,
information, and scientific literacy skills development are not always explicit
learning objectives in courses using data, they are addressed by most
participants because of their importance as life skills and as foundations for
more explicit learning objectives around scientific thinking and disciplinary
research methods. When participants do emphasize learning data literacy among
their implicit goals for a course, this is often expressed as helping students
to “be savvier consumers” of data of all kinds (Participant 05).
One driver for
including data literacy as course objectives is the shared perception among
participants that there is a flood of low-quality online representations of
data and that much of what students will encounter in their everyday lives is,
as one participant bluntly stated, “complete garbage” (Participant 06). Another
participant mentions that “depending on where they're coming from in life,
[students] may or may not have had any life experience to really give them a
foundation to think about data from” (Participant 09). As savvy consumers of
data, students need to be equipped to assess the validity of claims. They need
to be able to recognize misleading or false claims and to identify claims that
might be intentionally deceptive, are based on faulty reasoning, or have poor
methodology. Conversely, students should be able to recognize sound methodology
where the arguments and conclusions presented are supported by the data cited.
Students Interpreting Data
There is a sense
of urgency around helping students navigate the challenges of an information
environment in which accuracy is sometimes secondary to messaging and “the
difference between opinion and argument” can be difficult to discern
(Participant 07). Students need to know enough about data to begin to ask
interrogative questions, identify biases, and recognize misrepresentations:
Are
there other data sources that might tell a different story? Or is there
something about the way this data is being presented that biases the
presentation toward a certain type of conclusion? . . . I want them to ask
those kinds of questions of me. And then, also, of themselves, as they work
with data. Because we’re being bombarded all the time with information, and
oftentimes with just conclusions and statements about this is the way things
are (Participant 01).
Data literate
students should be equipped to question the data and claims they encounter and
to understand that data “doesn’t tell a story by itself” (Participant 01), but
is interpreted, analyzed, and presented by people. Students also need a level
of data proficiency to progress to more advanced courses, to be members of the
workforce in which those skills are increasingly important, and to be “a good
citizen” (Participant 01) in a participatory democracy in which even accurately
presented data can be used to tell conflicting stories.
Students Learning the Scientific Method
Many courses
using data have explicit learning objectives to introduce students to disciplinary
research methods. Students transition from data literacy as academic and life
skills to contextualizing these skills in an understanding of the scientific
method and social science disciplinary research methodologies, setting the
stage for deeper learning about methods and knowledge building. To this end,
participants use data as a tool to help acclimate students to scientific
thinking:
It's
a very important part of the process of helping students understand what
scientists do, and what people who are real researchers do . . . it’s really
emphasizing the use of data and empirical knowledge to make sense of what we
see (Participant 11).
The scientific
method and its core principle of using empirical evidence to substantiate
arguments is a different way of learning about the world than students may have
encountered previously. It may even bump against other ways of learning that
students have internalized, such as those with an arts and humanities focus
where “the whole scientific method is sort of not their ballpark” (Participant
05), and they may have developed a “pattern of learning” (Participant 02) that
works against their interpretation of numeric data, presumably a pattern based
on textual rather than numeric analysis. Additionally, popular notions on how
to conduct research, such as participation in informal polls and surveys, may
cloud students’ understanding of methods: “they’ve grown up in a world,
unfortunately, where every fool with a modem and internet connection does what
they call a survey, there is so much misperception about how to do survey
research. I think that's really damaging” (Participant 02).
Teaching With Data for Statistical, Data, and Tool Skill
Building
While the
previous
Students Working With Data
The participants
emphasized the challenges that students face when working with data. As noted
by one participant, “I always have to try to remember how unfamiliar they are
with using data” (Participant 07). Students struggle for a variety of reasons,
including difficulty with or anxiety around math skills, lack of experience
with or lack of retention of math or statistical concepts, obstacles learning
to use analysis software, or problems specific to how data is structured and
manipulated. Students in a course are unlikely to have uniform knowledge or
exposure to data concepts. This diversity of experience results in what one
participant described as a “heterogeneous knowledge base” (Participant 11)
within a single course that makes teaching course content at the appropriate
level more difficult. In some cases, software serves a pedagogical role in
helping students practise analytical concepts; in other cases, participants
consider working knowledge of software packages as transferable job skills.
A common theme
from participants was about students’ math anxiety or difficulty with math
skills. Prior experiences around learning math in K-12 can lead some students
to develop a mindset that they are not going to be good at math or science:
So,
technical challenges [are] one aspect, obviously, of it. I feel like,
depending on their comfort level with statistics, depending on their comfort
level with math and with numbers, there’s a level of anxiety that goes with it.
That, they see a lot of numbers and just freak out (Participant 10).
It is each
student’s “own math ability, understanding, and their comfort level with
numbers that plays a role” (Participant 10). Participants viewed math anxiety
as a barrier for students to overcome to gain a positive outcome that will be
helpful after graduation. Participants described students as being capable of
working with mathematical concepts, statistics, and data but needing to
overcome the mindset of not being able to.
Instructors Providing Data for Use
Carryover of
learning from one course to another and retention of knowledge by students was
described by participants as inconsistent as it pertained to basic statistics
or specific software. This lack of retention can impact the scaffolding of
learning objectives; students’ tentative grasp of data concepts can lead to
struggles with higher-order tasks such as data analysis, interpretation, and
application of findings. In turn, providing data for students allows them to
focus on specific skills or learning outcomes. If the learning objectives for the
course do not include data collection or data processing, then including those
activities distracts students from concentrating on data analysis and
interpretation of findings. As one participant explained:
I . .
. bring them data that’s already cleaned . . .. It makes it a lot easier . . ..
Then they can start to get into what the story is with the data, rather than
thinking about, . . . what do you mean there are missing cases? . . . I think
[the higher-order concerns] just throw them for a loop (Participant 02).
While providing
data required participants to spend time locating and preparing data prior to
the start of the course, it saved time for the students. Among our
participants, it was most common to find students engaging in data collection or
acquisition and data processing in research methods courses or courses
concerning the scientific process. In some courses, locating data from
instructor-vetted sources was required. But in courses where students collected
or located their own data for use, those skills were tied to course learning
objectives.
Sources of Support on Campus
To address
challenges faced by students who struggle with math, statistical software, and
understanding data,
Discussion
Our review of the literature suggests that social
science instructors use a range of pedagogical strategies to teach data and
statistical literacy concepts, but they encounter math and statistical anxiety
as significant barriers to learning. Our study supports these earlier findings
and expands on why UNH instructors see data concepts as essential to student
academic and life success and what strategies for overcoming barriers to
student learning they employ in the classroom. In this section, we discuss how
the findings address the aims of the study including a discussion of evidenced
based actions to support data instruction and learning.
Our study findings directly address the first two of
our study aims: (1) explore the ways in which instructors teach and engage
undergraduates in the social sciences using quantitative data and (2)
understand the support needs of these instructors. Social science instructors teach with data in the classroom to support both
general and course-specific learning outcomes that focus on building data and
scientific literacies and skill building. The participants expressed challenges
that students face working with data and how they, as instructors, mediate
these challenges though course design and navigate the minimal support on
campus. Depending
on a course’s learning objectives and content, participants concentrate on
different combinations of analytical, conceptual, and technical skills.
Table 2
Recommended Actions for Local Stakeholders Based on
Findings
|
Recommended
actions |
Rationale |
|
|
|
|
Provide
support for instructors in locating and sharing data for teaching |
Identifying,
locating, and cleaning datasets that are appropriate for students to use can
be time consuming, and the findings suggest that instructors often provide
datasets for students to analyze so that specific data literacy skills can be
targeted. |
|
Provide
support for students who need extra help with math and statistics |
The
findings suggest that instructors have some concern about the math skills and
retention of their students and that this has the potential to interfere with
understanding data concepts and statistical analysis concepts. While UNH,
like many campuses, has a centralized writing centre there is no general
tutoring for math or specific support that caters to students working with
math or statistics in social science contexts. |
|
Provide
enhanced software support for both students and instructors |
Sometimes
developing proficiency with a tool or software is a learning objective; other
times the tool supports the learning objectives. Decisions around which tool
to use may be based on criteria such as type of data, user preference,
pedagogical purpose, or disciplinary practice. |
|
Provide
learning opportunities for instructors on teaching with data, student skills
retention, and new research methodologies and data analysis and visualization
practices |
At
UNH, like many other universities, the Center for Excellence and Innovation
in Teaching & Learning already provides resources and professional
development opportunities for best practices in teaching. Librarians can
build partnerships with teaching and learning centres to help expand
opportunities that focus on teaching with data. |
|
Enhance
library support for teaching with data and foster partnerships with campus
stakeholders to explore these collaborative actions |
Support
needed by social science instructors cannot be addressed by a single campus
stakeholder. For many of the collaborative actions, the library’s role is as
partner; however, there are areas for which the library can provide
leadership or build on existing support for data-related activities. |
Courses using data provide a unique opportunity for
students to gain experience by working with hands-on examples. There
was a strong thread throughout many of the interviews associated with students
learning to work with datasets and to engage with data and scientific
literacies through application of concepts—learning by doing. This aligns with
a comment made by one participant about the difference between understanding
due to reading or listening and the deeper comprehension resulting from the
actual experience of doing and practicing.
Based on the findings, we propose five evidence
based collaborative actions that local stakeholders can take to better support
social science instructors teaching with data (see Table 2). These proposed
actions address the last two aims of our study: (3) develop actionable
recommendations for campus stakeholders and (4) identify opportunities for the
development of resources, services, or activities in the library to support the
use of quantitative data in the classroom. In many cases, these are
opportunities for stakeholders to collaborate or partner with one another and
with the library. Most build on or extend the support already provided by the
library and other units on campus.
The study we
conducted at UNH is both a stand-alone project and part of a larger project
that included 19 other institutions conducting local versions. While the UNH
study sheds light on teaching with quantitative data in the social sciences at
UNH, the findings and evidenced based actions are potentially transferable to
other settings. Additional insight into this topic at the local level can be
found in the other local reports available in participating institutions’
institutional repositories. Ithaka S+R prepared a consolidated report that
analyzes interviews across all 20 institutions as a single dataset (Ruediger et
al., 2022). Findings from that publication report on high-level themes
identified across institutions.
Limitations
There are some
limitations to the methods used in this study. While the sample size for our
local study was small and consisted of self-selecting participants, this is
appropriate for an exploratory study. It is worth noting that “this study does
not purport to be statistically representative nor are the recommendations
meant to be prescriptive; rather, the report and its recommendations are
intended to be suggestive of areas for further investigation” (Ithaka S+R,
n.d.). The data from this local project is included in and complemented by the
capstone report from Ithaka S+R that provides an aggregated analysis of
interviews conducted at 20 institutions. This broader analysis provides
additional perspective and context for this local study and mitigates the
limitation of its small size. Another limitation of this study is that the
focus was on undergraduate social science courses using quantitative data.
Including graduate courses as well as the use of qualitative data would have
provided a more holistic look at data literacy and teaching practices in social
science courses. Future work involves exploring these areas as well as courses
beyond the social sciences.
Conclusion
This exploratory
study investigated the teaching practices of social science instructors at UNH
who engage with undergraduate students using quantitative data in the
classroom. The participants we interviewed teach both general and
discipline-specific data concepts as academic, work, and life skills. Primary
challenges discussed by the participants that students face in engaging with
these topics are understanding math and statistical concepts, learning new
software and computing skills, limited prior exposure to data, and lack of
retention of content from earlier courses. Participants addressed challenges in
several ways in order to lower barriers to learning, including finding,
vetting, and cleaning data for their students to use. Participants could use
additional support and new strategies to alleviate student challenges, and we
presented recommended actions based on the findings of this study.
Data literacy is an important set of competencies in part because of the
quality and quantity of data students encounter in their academic, work, and
daily life; they need to have the ability to critically evaluate data, methods,
and claims. This study directed attention to an area that had not previously
been focused on at UNH and is an important first step toward creating greater
awareness of the challenges of teaching with data and creating opportunities
for building a community of practice for social science instructors grappling
with these issues. UNH has opportunities to create additional supports for instructors
and students that could improve student learning outcomes. In addition to
library partnership, such efforts may require cross-college or cross-department
coordination as well as administrative support.
Funding Statement
Funding for this
project was provided by the UNH Library.
Acknowledgements
The researchers
extend a sincere thank you to the study participants, each of whom was generous
with their time and provided thoughtful remarks. The researchers also thank
Ithaka S+R and their staff, especially Dylan Ruediger and Danielle Cooper, for
the high level of support provided to the local teams throughout the process,
which, like so much else, was impacted by the pandemic.
Author Contributions
Patricia Condon: Investigation
(equal), Formal analysis (equal), Project administration (lead), Writing –
original draft (equal), Writing – review & editing (equal) Eleta Exline:
Investigation (equal), Formal analysis (equal), Writing – original draft
(equal), Writing – review & editing (equal) Louise Buckley: Investigation
(equal), Formal analysis (equal), Writing – original draft (equal), Writing –
review & editing (equal)
References
Brown,
M. (2017). Making students part of the dataset: A model for statistical enquiry
in social issues. Teaching Statistics, 39(3), 79–83. https://doi.org/10.1111/test.12131
Cantinotti,
M., Désormeaux-Moreau, M., & Balbinotti, M. (2017). Mapping psychology
students’ perspective on group peer-tutoring in statistics. Mentoring &
Tutoring: Partnership in Learning, 25(4), 466–484. https://doi.org/10.1080/13611267.2017.1403609
Carlson,
J., Fosmire, M., Miller, C., & Nelson, M. S. (2011). Determining data
information literacy needs: A study of students and research faculty. portal:
Libraries and the Academy 11(2), 629–657. https://doi.org/10.1353/pla.2011.0022
Caulfield,
S. L., & Persell, C. H. (2006). Teaching social science reasoning and
quantitative literacy: The role of collaborative groups. Teaching Sociology,
34(1), 39–53. https://doi.org/10.1177/0092055X0603400104
Chamberlain,
J. M., Hillier, J., & Signoretta, P. (2015). Counting better? An
examination of the impact of quantitative method teaching on statistical
anxiety and confidence. Active Learning in Higher Education, 16(1),
51–66. https://doi.org/10.1177/1469787414558983
Clark,
T., & Foster, L. (2017). ‘I’m not a natural mathematician’: Inquiry-based
learning, constructive alignment and introductory quantitative social science. Teaching
Public Administration, 35(3), 260–279. https://doi.org/10.1177/0144739417711219
Condon,
P., Exline, E., & Buckley, L. (2021). Teaching with quantitative data in
the social sciences at the University of New Hampshire: An Ithaka S+R local
report. UNH Scholars Repository. https://dx.doi.org/10.34051/p/2021.39
Condron,
D. J., Becker, J. H., & Bzhetaj, L. (2018). Sources of students’ anxiety in
a multidisciplinary social statistics course. Teaching Sociology, 46(4),
346–355. https://doi.org/10.1177/0092055X18780501
Cooper,
D. M. (2019, July 29). Announcing two new S+R projects on supporting data work.
Ithaka S+R Blog. https://sr.ithaka.org/blog/announcing-two-new-sr-projects-on-supporting-data-work/
Corbin,
J., & Strauss, A. (2014). Basics of qualitative research: Techniques and
procedures for developing grounded theory. Sage Publications.
Cui,
S., Zhang, J., Guan, D., Zhao, X., & Si, J. (2019). Antecedents of
statistics anxiety: An integrated account. Personality and Individual
Differences, 144, 79–87. https://doi.org/10.1016/j.paid.2019.02.036
Elbulok-Charcape,
M., Grandoit, E., Berman, L., Fogel, J., Fink, L., & Rabin, L. (2019).
Improving exam performance in an undergraduate statistics course for at-risk
students through peer tutoring. Psychology Teaching Review, 25(2),
3–17.
Faber,
G., & Drexler, H. (2019). Predicting education science students’ statistics
anxiety: The role of prior experiences within a framework of domain-specific
motivation constructs. Higher Learning Research Communications, 9(1).
https://eric.ed.gov/?id=EJ1221253
Fellers,
P. S., & Kuiper, S. (2020). Introducing undergraduates to concepts of
survey data analysis. Journal of Statistics Education, 28(1),
18–24. https://doi.org/10.1080/10691898.2020.1720552
Filiz,
M., Early, E., Thurston, A., & Miller, S. (2020). Measuring and improving
university students’ statistics self-concept: A systematic review.
International Journal of Educational Research Open, 1, Article 100020. https://doi.org/10.1016/j.ijedro.2020.100020
Hartnett,
J. L. (2016). Using data mining to teach applied statistics and correlation. Teaching
of Psychology, 43(2), 142–146. https://doi.org/10.1177/0098628316636292
Hilal,
S. M., & Redlin, M. M. (Eds.). (2004). Integrating data analysis:
Instructional materials for integrating data analysis into sociology courses.
American Sociological Association.
Hosein, A.,
& Rao, N. (2019). The acculturation and engagement of undergraduate
students in scientific thinking through research methods. In M. Murtonen &
K. Balloo (Eds.), Redefining scientific thinking for higher education:
Higher-order thinking, evidence-based reasoning and research skills (pp.
157–175). Springer International Publishing. https://doi.org/10.1007/978-3-030-24215-2_7
Intepe,
G., & Shearman, D. (2020). Developing statistical understanding and
overcoming anxiety via drop-in consultations. Statistics Education Research
Journal, 19(1), 149–166. https://iase-web.org/ojs/SERJ/article/download/127/35
Ithaka
S+R. (2020). Teaching with data in the social sciences ethics review
instructions. [Unpublished internal documentation].
Lawrence,
R. (2004). Teaching data structures using competitive games. IEEE
Transactions on Education, 47(4), 459–466. https://doi.org/10.1109/TE.2004.825053
Lovekamp,
W. E., Soboroff, S. D., & Gillespie, M. D. (2017). Engaging students in
survey research projects across research methods and statistics courses. Teaching
Sociology, 45(1), 65–72. https://doi.org/10.1177/0092055X16673136
MacArthur,
K. R. (2020). Avoiding over-diagnosis: Exploring the role of gender in changes
over time in statistics anxiety and attitudes. Numeracy: Advancing Education
in Quantitative Literacy, 13(1), 1–26. https://doi.org/10.5038/1936-4660.13.1.4
Neumann,
D. L., Hood, M., & Neumann, M. M. (2013). Using real-life data when
teaching statistics: Student perceptions of this strategy in an introductory
statistics course. Statistics Education Research Journal, 12(2),
59–70. https://doi.org/10.52041/serj.v12i2.304
Nurse,
A. M., & Staiger, T. (2019). Teaching data reproducibility through service
learning. Teaching Sociology, 47(4), 350–357. https://doi.org/10.1177/0092055X19860577
Ralston,
K., MacInnes, J., Crow, G., & Gayle, V. J. (2016). We need to talk about
statistical anxiety. A review of the evidence around statistical anxiety in the
context of quantitative methods pedagogy [Working paper]. NCRM. https://eprints.ncrm.ac.uk/id/eprint/3987/
Rode,
J. B., & Ringel, M. M. (2019). Statistical software output in the
classroom: A comparison of R and SPSS. Teaching of Psychology, 46(4),
319–327. https://doi.org/10.1177/0098628319872605
Ruediger,
D., Cooper, D. M., Bardeen, A., Baum, L., Ben-Gad, S., Bennett, S., Berger, K.,
Bonella, L., Brazell, R., Bruce, S., Buckley, L., Burrows, T., Calvert, S.,
Condon, P., Curty, R., Davis, H., Exline, E., Feerrar, J., Finch, E., . . .
Yatcilla, J. (2022). Fostering data literacy: Teaching with quantitative data
in the social sciences. Ithaka S+R. https://doi.org/10.18665/sr.317506
Wolff,
A., Gooch, D., Montaner, J. J. C., Rashid, U., & Kortuem, G. (2016).
Creating an understanding of data literacy for a data-driven society. The
Journal of Community Informatics, 12(3), pp. 9–26. https://doi.org/10.15353/joci.v12i3.3275
Wollschleger,
J. (2019). Making it count: Using real-world projects for course assignments. Teaching
Sociology, 47(4), 314–324. https://doi.org/10.1177/0092055X19864422