Research Article
May I borrow a Stapler? Is this all Students Ask at the Service Desk in a University Library?
Liv Inger Lamøy
Research librarian
Norwegian University of Science and Technology
University Library
Trondheim, Norway
E-mail: liv.i.lamoy@ntnu.no
Astrid Kilvik
Senior Research Librarian
Norwegian University of Science and Technology
University Library
Trondheim, Norway
E-mail: astrid.kilvik@ntnu.no
Received: 20 Nov. 2020 Accepted: 7 Jun. 2021
![]() 2021 Lamøy and Kilvik. This
is an Open Access article distributed under the terms of the Creative Commons‐Attribution‐Noncommercial‐Share Alike License 4.0
International (http://creativecommons.org/licenses/by-nc-sa/4.0/),
which permits unrestricted use, distribution, and reproduction in any medium,
provided the original work is properly attributed, not used for commercial
purposes, and, if transformed, the resulting work is redistributed under the
same or similar license to this one.
2021 Lamøy and Kilvik. This
is an Open Access article distributed under the terms of the Creative Commons‐Attribution‐Noncommercial‐Share Alike License 4.0
International (http://creativecommons.org/licenses/by-nc-sa/4.0/),
which permits unrestricted use, distribution, and reproduction in any medium,
provided the original work is properly attributed, not used for commercial
purposes, and, if transformed, the resulting work is redistributed under the
same or similar license to this one.
DOI: 10.18438/eblip29883
Abstract
Objective
-
The objective of the study is to increase the knowledge
about what questions students ask at the library desk and what the purpose is
of their use of the desk. Our focus has been on the physical meetings with the
students. The aim is to contribute to the discussion on the future development
of the library service desk.
Methods
-
We recorded questions asked at the desks to explore how students use the library service desks. The
recording, where library staff sorted questions into predefined categories,
took place over four weeks between the years 2017–2018.
Results
-
Our recording showed that 63% of the questions asked at the library service desks were about loan services, document
delivery, and access to physical and electronic collections. Practical things
such as opening hours, lost and found items, and the location of the group
study rooms, accounted for 16% of questions. Questions about information
technology (IT) made up 8% of questions. Finally, the results showed that 8% of
the questions from the four weeks of counting were counselling and guidance
questions, and 2% were about literature lists, reference management, and
reference management tools. We found more questions about counselling and
guidance in the spring weeks and more practical questions in the fall. We did
not find any clear connection between the number of questions and the size of
the branch libraries.
Conclusion
–
By conducting this study, we have learned more about
why students use the library desk. Our study shows that students come to the
library desk to ask about a lot more than just borrowing staples. The
results from the study will inform the development of the library desk service
going forward.
Introduction
Norwegian University of Science and Technology (NTNU)
is the largest university in Norway today. NTNU specializes in science and
technology, and offers a variety of programs of professional study, along with
broad range of academic disciplines. NTNU University Library is a public
scientific library, with branch libraries located on several campuses. The main
objective of the library is to support research and education, and students and
staff are its primary users. The branch libraries differ in terms of collection
size, whether they have special collections or not, and how many faculties and
departments they provide services to. Some of the branch libraries have only
one employee while the largest ones have up to 15. There are service desks at
all branch libraries. Most of the libraries have only one desk where patrons
can ask a variety of questions about circulation, access to electronic and
print collections, literature searching, reference management and tools, IT,
and more. Questions are answered at the desks or forwarded to specialists in
the library. One of the larger branch libraries has two desks, one for
circulation questions and one for counselling and guidance questions.
For some years, the library desk has been the subject
of discussions, valuations, and musings about what to do with it, how to staff
it, and how to organize it. The fight for attention is hard, and other areas,
such as digital content, new user demands, web-based services, and new
self-service solutions, have for quite a long period been the centre of
attention in libraries in Norwegian institutions of higher education. At the
same time, the anecdotes about the library desk are very much alive and may
sound like: "I just
get questions about printers and group study rooms", "The
students don’t make use of the desks during the examination period",
"The only thing they ask for at the desk is to borrow the stapler".
We began to wonder if the anecdotes reflect today's reality. We have extensive
experience working at the service desks and these descriptions do not
accurately describe what we have seen.
There
are several international studies on topics related to the library desk
service, recording, and categorizing of inquiries. (Gerlich
& Berard, 2007; Henry & Neville, 2008; Katz,
2002; LeMire et al., 2016, Lenkart
& Yu, 2017; Radford & Connaway, 2013; Ryan,
2008; Warner, 2001). But so far, there is a lack of Norwegian data in the
field. To increase our knowledge about what really goes on at
the library desk in a large Norwegian multi-branch university library, we launched a project called TREFF (the
"Desk-project")[1]
in 2017. The National Library of Norway provided financial support for the
project. The start of this project was to map the questions received at the
desks in all the university's branch libraries. Our focus has been on physical
meetings with students, and we describe and discuss the process and results in the following article.
Literature Review
To increase
knowledge about what students ask at our university
library´s service desks, we analyzed their questions. To facilitate the
analysis, we sought out literature about similar recording projects in other
libraries. We had two objectives for our literature search. The first was to
find a suitable recording form. The second objective was to explore the
findings in previous studies, to place our study in a wider scholarly context.
Because our project included all branch libraries, we needed the recording
method to be as simple as possible. In our search, we did not come across any
Norwegian studies, but we discovered several international ones.
According to the
literature, questions asked at library desks are assigned different
classifications as a means of recording the activity. Katz (2002) used the
traditional categories for classification of reference questions: direction,
ready reference, specific-search questions, and research. In 2001, East
Carolina University was in the process of changing their reference desk
organization to a "single point of service", and they saw a need to
re-examine how they record reference transaction statistics (Warner, 2001).
Warner created a classification system based on the resources required to
answer the question: non-resource-based (Level I), skill-based (Level II),
strategy-based (Level III), and consultation (Level IV). One of the benefits of
using this system was that it identified, as early as possible in the
encounter, which library staff member should answer the question. The findings
from the collection of statistics using the Warner classification showed that
80% of the questions from the new service desk fell into Levels I and II and
could be answered by students or technicians, while 20% fell into Levels III
and IV and would usually be referred to a reference librarian. Henry and
Neville (2008) collected questions received at the reference desk and tested
both Katz’s resource- and time-based categories and Warner’s resource-based
categories. The results showed that the directional or non-resource-based
questions accounted for 50% or more of the total, the skill-based or ready
reference questions 30-40 %, and strategy-based or specific search questions
less than 10%. They concluded that Warner’s system appeared more applicable,
but also that value can be added if time-of-day and time-of-semester activity
is included. In a holistic approach to evaluating in-person, email, and chat
reference transactions, LeMire et al. (2016)
considered Warner’s and Katz’s scales and the READ scale. The latter is a six-point
scale developed to record the skills, knowledge, techniques, and tools used by
the librarian during a reference transaction. On this scale, level 1 questions
require the least amount of effort and knowledge, while level 6 require the
most effort and are time-expended inquiries. Time dedicated to the transaction
is also recognized in the READ scale (Gerlich & Berard, 2007).
LeMire et al. (2016) chose not to use any of the existing
scales because they tended to pre-assign higher value to in-depth, subject-oriented
reference questions. The authors believed that, "…even 'simple' question
types can give patrons valuable help and can turn into complex information
searches" (p. 231). In addition, the existing scales do not consider
questions in new areas, like open-access publishing, maker spaces, and so on.
The codebook developed by LeMire et al. (2016)
consists of nine broad categories: Library Information and Policy,
Circulation/Borrowing/Reserves, Research and Reference, Locate Materials, SFX/EZProxy/Off-Campus Access, Technology,
Print/Scan/Copy/Duplication, Feedback and Other. The results of their
evaluation of reference desk, email, and chat transactions in a shared service
point showed that 22% of the questions were in the category Library Information
and Policy, 18% were in Circulation/Borrowing/Reserves, 16% in Research and
Reference, 15% in Locate Materials, and 17% were in the print, technology,
feedback and other categories. More detailed classifications have also been
developed. A study of the cost-effectiveness of staffing a traditional
reference desk in a university library divided 6,959 reference desk
transactions into four major categories: directional, look-up, reference, and
technology (Ryan, 2008). The questions came in person, by phone, or by email.
The reference category was subdivided further into eight categories: catalogue
search, citation help, database help, guide to correct database(s), personal
knowledge or referral, quick internet, research, and serials solutions. The
results from Ryan's study (2008) showed that 36.3% of the questions were
non-informational (did not refer to the collection) or were ‘machine’
transactions (printer and copy issues). Directional questions about the
collections accounted for 15.4% and quick lookups for 9%. Of these questions,
12.4% were about technology (excel, logins, passwords, network), 26.8% were in
the reference category, of which 11% were research questions.
Radford and Connaway (2013) analyzed live chat and instant messaging
(IM) questions and used the categories of subject search, ready reference
procedural, no question, holdings, research, inappropriate directional, and
readers’ advisory. The results showed that subject search question frequency
had sunk and that there was a shift towards more procedural questions. In their
study, Lenkart and Yu (2017) examined 66,638
in-person, email, and phone transactions from 5 specialized and 2 general
reference service points at the University of Illinois Library. The researchers
found that 30.9% of the total number of transactions were directional, 18.1%
were about library policies and services, 22.8% were questions about library
materials and 6.3% were inquiries for research assistance. In addition, 2.5%
were ready reference and 11.6% were related to things like printers, scanners,
software and so on.
Aims
In
this study, we aimed to increase our knowledge about what questions students
ask at the library desk in a large Norwegian university. What is the purpose of
the students’ use of the desk? Our focus has been on physical meetings with the
students. The research question guiding this study has been: What
questions do the students ask at the library service desks in a large,
multi-branch library at a Norwegian university? By mapping the desk activity
and investigating students' inquiries at all branch libraries, we hope to
contribute to the discussion on the future development of the library service
desk.
Methods
To
understand how students use the library service desks,
we recorded the questions they asked at the desks. We started out searching for
a suitable recording form, but the forms we found in the literature were too
complex for our project. For instance, we could not use forms that included
considerations about the complexity of each question or time spent to answer (Gerlich & Berard, 2007; Katz,
2002; Warner, 2001; Ryan, 2008). Because our recording process would include
different staff members in several branch libraries, we needed the form to be
as simple as possible. The more variables the greater the chance of inaccurate
recordings, which could lead to errors in the data. For this reason, we decided
not to use any of the forms presented in the literature and instead developed a
new recording form for this study (Appendix).
From
the literature review, we found inspiration for subject categories (LeMire et al., 2016; Lenkart
& Yu, 2017; Radford & Connaway, 2013; Ryan,
2008), but we chose to use terminology that would fit into the context of a
large Norwegian university library and that our colleagues at the service desks
would be familiar with. We decided to use the following categories: Collection
and Access, Counselling/Guidance[2],
Citing and Referencing, Loan, Practical questions[3], IT
questions, and Other questions[4].
Although the form had to be simple, like Henry & Neville (2008), we chose
to include time-of-day as a parameter, as this would add valuable information
without complicating the recording process. The time periods we used were:
opening hours until 12:00p.m., from 12:00p.m. until 3:30p.m. and from 3:30p.m.
until closing time.
The
project members reviewed and tested the first draft of the recording form and
the subject categories. We also carried out a pilot at a couple of branch
libraries in advance of the first recording week. The form worked well, but
more clarifying examples were needed under some of the categories. We pointed
out that questions about the location of study rooms, auditoriums, cafés, and
so on were to be recorded in the Practical category. We clarified that the
Other category should be used for questions about exams, grades, and other
similar topics.
We
observed five hours’ worth of interactions between students and desk staff in
four of the branch libraries during the first recording week. The observations
served as a validation of the recording forms and confirmed that the forms
worked well. Therefore, no further adjustments were needed. Eventually, we
found a coincidence of types and distribution of questions in the observations
and in the recording weeks.
Student
activities vary throughout the academic year. In some periods, they are busy
with exam reading, while in others, they are writing assignments. To get a good
distribution of the recording weeks throughout the academic year, the first
recording took place in November 2017, the rest were conducted in 2018
(February, April, and September) so that these different phases could be
compared.
The
recording of questions was conducted by the desk staff in all 14 branches of
our university library. We notified colleagues ahead of the recording weeks and
gave clear instructions on how to record. We stated that only questions from
students were to be recorded (including students from other universities). Since
our study dealt with physical meetings with students, questions by email or
phone should not be counted. The libraries used one form per day and recorded
all individual questions in the correct category. There could be several
questions per inquiry and all questions were recorded. The students were
notified of the recording activities by placards placed on the desks. Questions
were recorded in the predefined categories with one tally mark for each
question. We used paper forms and collected the forms after each
recording week. The total results were transferred into Excel for further
processing.
Results
In this study, in-person questions from students at
the library service desks were collected through four different weeks spread
throughout the academic year from November 2017 to September 2018. During this period,
a total of 9,683 questions were recorded in the different 14 branch libraries.
Table 1 shows questions per category recorded in all 14 libraries in percentage
(number). The results show that the largest number of questions was related to
the physical collections and revolved around what is found in the library
room.
Table 1
Percentage (Number) of Questions per Category
|
|
Collection and Access |
Counselling/ Guidance |
Citing and Referencing |
Loan |
Practical |
IT |
Other |
Total |
|
November 2017 |
18% |
5% |
1% |
41% |
23% |
9% |
3% |
100% |
|
(479) |
(125) |
(33) |
(1094) |
(600) |
(226) |
(80) |
(2637) |
|
|
February 2018 |
17% |
8% |
2% |
50% |
13% |
6% |
4% |
100% |
|
(370) |
(180) |
(35) |
(1074) |
(274) |
(134) |
(85) |
(2152) |
|
|
April 2018 |
19% |
11% |
4% |
45% |
13% |
6% |
3% |
100% |
|
(445) |
(269) |
(89) |
(1055) |
(296) |
(138) |
(69) |
(2361) |
|
|
September 2018 |
21% |
7% |
1% |
40% |
17% |
10% |
5% |
100% |
|
(532) |
(189) |
(25) |
(1003) |
(421) |
(241) |
(122) |
(2533) |
|
|
Total |
19% |
8% |
2% |
44% |
16% |
8% |
4% |
100% |
|
(1826) |
(763) |
(182) |
(4226) |
(1591) |
(739) |
(356) |
(9683) |
Divided into 14 libraries, a total of 9,683 questions
corresponds to 35 questions per library per day.
The distribution of questions in the different
categories was quite stable throughout the four weeks. Loan was the category
with the most questions, with 44% on average for the four weeks. This was
followed by collection and access with 19%. Figure 1 shows the distribution of
questions in the categories for all four weeks in total.
The two categories with the greatest variation were
Counselling/Guidance, with 5% in the recording week in November 2017 and 11% in
April 2018. There were also more questions in the Practical category in
the two recording weeks in the fall (23% and 17%) than in the other two weeks
(13% both).
We found no large variation in the type of questions
on the different days of the week. Figure 2 shows the distribution of questions
according to days for all four weeks in total. The average shows slightly fewer
questions on Fridays (17%) and slightly more questions on Wednesdays (22%) than
on the other days.
In this study, we recorded questions in three
different time periods each day and looked at how the questions were spread
throughout the day. We did not find any large variation in the different time
periods. The pattern showed a comparatively even number of questions between
opening hours and 3:30p.m. and less from 3:30p.m. until closing. Figure 3 shows
the distribution of questions in the different time periods.
To
maintain anonymity, we were prevented from breaking down results by library.
However, we did not find a clear connection
between the number of questions and the size of the branch libraries. Some of
the small- and medium-sized branch libraries had a relatively larger number of
questions than the biggest libraries. Measured in questions per library
employee, it was also not the largest libraries that received the most
questions. To give one example, one of the smallest branch libraries that cover
health and social sciences had 439 questions per employee, while one of the
largest libraries had 89. We will discuss possible explanations for this in the
discussion section.
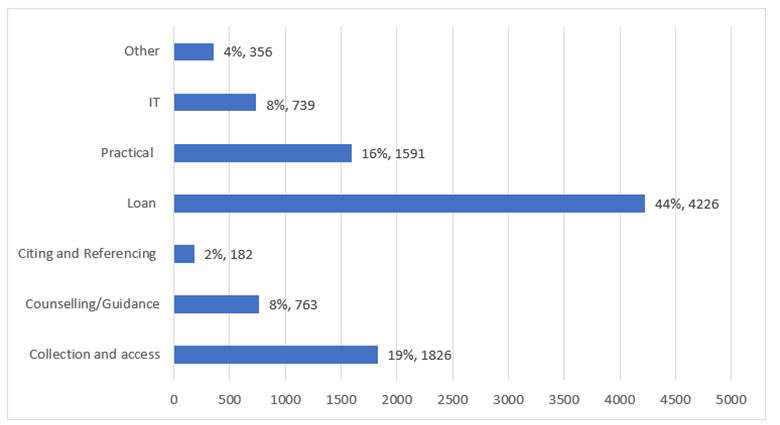
Figure 1
Questions per category in total for all four weeks.
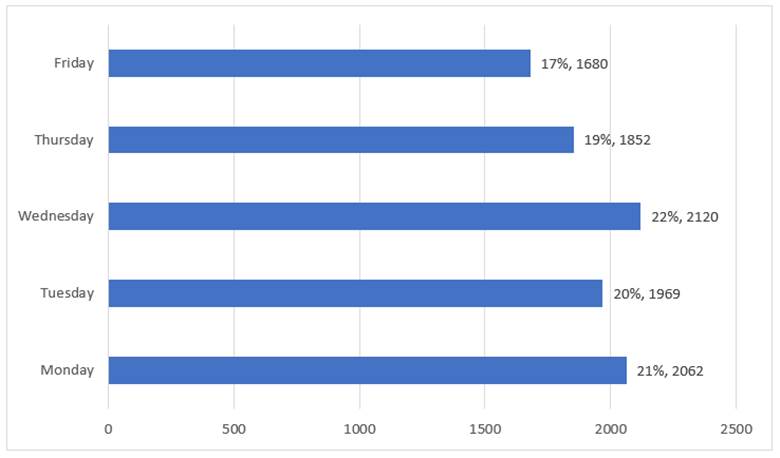
Figure 2
Questions per day of the week.
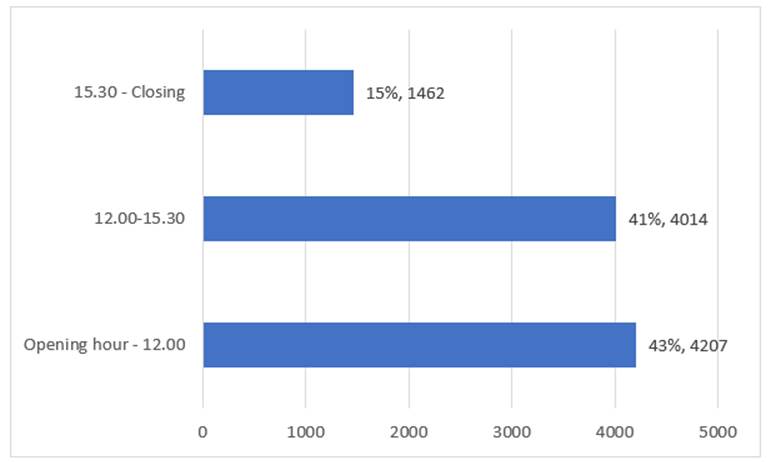
Figure 3
The spread of questions throughout the day.
Discussion
Our study shows that students ask about a lot more
than just borrowing staples at the library desk. In fact, 44% of the questions
were about loan services and document delivery; 19% were about physical and
electronic collections and how to access to them; 16% were about practical
things, such as opening hours, lost and found items, and the location of the
group study rooms; 7% of the questions were about IT. Finally, the results show
that 8% of the questions from the four weeks of counting were counselling and
guidance questions and 2% were about literature lists, reference management,
and reference management tools.
The recording of students´ questions was conducted by
the desk staff in all 14 branch libraries at the university. In a previous
study (Kesselmann & Watstein, 1987), it turned out that as many as 45% of questions were
categorized incorrectly. We have no reason to believe that the percentage is
that high in our study, but there are of course several possible sources of
error: some may have misunderstood the content of the categories, forgotten to
record questions, recorded inaccurate or
double-recorded questions and so on. The fact that so many different staff
members were involved in the recording is another possible source of error. We
must, therefore, assume that there may be some errors in our data. Since both
the recording form itself and the recording process were thoroughly quality
checked before we started the recording, nothing indicates that major
systematic errors were made.
It is interesting to compare our study with other
similar ones (Le Mire et al., 2016; Lenkart & Yu,
2017; Ryan, 2008). Admittedly, we cannot compare the studies directly, both
because the categorization of types of questions varies somewhat, plus some of
the studies, unlike ours, included email and chat transactions. Nevertheless,
we can still see some similarities. Our findings show that 19% of the questions
were in the collection and access category, while the corresponding percentage
in Le Mire et al.’s study (2016) was 15% (category named Locate materials). In Lenkart and Yu´s study (2017), 6.3% of the questions were
inquiries for research assistance. The corresponding percentage in our study
was 8%.
These findings are about similarities, but we also
find differences. Lenkart and Yu (2017) found that
22.8% were questions about library materials, while our results showed 44%.
Ryan (2008) found that 12.4% of the questions were about technology (Excel,
logins, passwords, and networks) and in our study the corresponding number was
8%.
The comparison with international studies is
interesting, but it is also worth comparing our findings with other Norwegian
studies due to a common cultural and organizational context. Several university
libraries in Norway are currently running projects about the service desk,
including a mapping of questions. Unfortunately, little has been published so
far. In an unpublished study from a project conducted in 2016, researchers at
Oslo Metropolitan University found that 53% of the questions fell into the categories
of Procedure and Collection. This corresponds roughly to the two categories in
our study, Collection and Access and Loans, for which the percentage is 63%.
There is also a similarity between these two studies when it comes to the
category Counselling/Guidance questions in our study and the similar category
Subject search in the unpublished study: 8% and 12.4%, respectively. So how can
one interpret this similarity in results and the fact that the percentage of
Counselling/Guidance questions seems to be relatively low? We do not have
previous data on the number of Counselling/Guidance questions in
Norwegian academic libraries. However, from Norwegian official government
statistics, we do know that in recent years the volume of courses and
individual guidance sessions by appointment has increased (Statistisk
sentralbyrå, 2019a). Could it be that a great deal of
the Counselling/Guidance questions are channelled through these services
instead of the library desks? The question is whether this practice is optimal
or whether one should, to a greater extent, use the desk as an educational tool
in such a way that students are encouraged to also use the desk for counselling
and guidance questions. Maybe that would be a more resource-efficient way to
utilize the library desk service. However, it is important to conduct more
studies on these issues.
The two categories with the greatest variation between the recording weeks were
Counselling/Guidance and Practical. The Counselling/Guidance category makes
sense because the students submit their bachelor’s and master’s theses in the
spring and therefore will have more questions on this topic. There were also
some more practical questions in the two recording weeks in the fall (September
and November) than in the other two weeks. The reason for this is somewhat
unclear but could be connected to the fact that new students usually have more
practical questions in connection with the start of the school year.
We did not find any obvious connection between the size of the branch library
and the number of questions asked at the desk. It was not the case that the
larger the library, the more questions were asked. In fact, at one of the
smallest branch libraries, 439 questions per employee were asked, while at one
of the largest, there were 89 questions. In the study, we have not investigated
the reasons for this, but we have some suggestions. We ask ourselves if a
higher share of printed material generates more questions at the service desks?
Although the proportion of electronic literature is increasing, printed
literature is still widely used in Norwegian university libraries (Statistisk sentralbyrå, 2019b).
Moreover, our own experience of working for several years in libraries within
different subject areas, have shown us that there are differences in library
use between disciplines. We have not found any Norwegian research to back this,
but we believe that the findings in our study reflect that assertion. Another
reason may be that some libraries have a stronger position among staff and
students than others do and therefore are used more. This could be due to a
greater proximity in smaller professional environments, making it easier to
contact the library desk.
Our
recording form, with few parameters and the recording process itself, worked
well for this study, particularly considering that so many employees were
involved in the data gathering. The subject categories were general enough to
make the question recording easy and at the same time they were well suited for
our analysis. The recording method can be recommended for other libraries,
especially big multi-branch libraries.
Even if the recording form was simple,
time-of-semester and time-of-day activity was admittedly taken care of.
However, unlike other studies, we did not record subcategories (Ryan, 2008) or
time use (Gerlich & Berard,
2007). Our findings showed a low percentage of Counselling/Guidance questions,
8%, but these questions are extra time-consuming. A possible follow-up study
could use a recording system that includes the time aspect, for instance the
READ scale (Gerlich & Berard,
2007). Other variables that can provide richer data material and can be
considered in further research are questions in new areas, like open-access
publishing, maker spaces, and so on (LeMire et al.,
2016). Further research may also include user groups other than students and
other communication channels besides the personal meeting at the desk.
Another interesting point, which we did not address in
our study, is that simple, practical questions can lead to other, more complex
ones. Once the dialogue between staff and student has been established in the
personal meeting at the desk, it may be easier for the student to ask even more
questions and more complex and time-consuming ones. One short question may
reveal a deeper need for information. In our experience, this happens at our
university library, but we do not know how often and how the mechanism works.
On the other hand, we also did not investigate what kind of follow-up questions
the library staff asked students who approached the desk. The lack of these
perspectives is a limitation in our study but are well suited for subsequent
studies. Even though our
study aimed to broaden the knowledge about one library, our own, this is a
limitation and later studies should include other libraries as well.
What
significance does our study have for further practice? The
results are still discussed at the University Library, but so far there
have been no changes in the desk staffing. Recording of questions asked at the desks will continue after the
project period and will be carried out twice a year in the future. Most
important is that awareness
of the various aspects of desk service seem to have increased. This awareness
had led to more discussions about desk service issues in both formal and
informal meetings. Also, a forum has been established for presentation and
discussion about desk related issues, like dissemination of the library’s
electronic collections, access to special collections, and so on.
The
purpose is to develop competence to guide users. Our study will, in combination with other research results and a longer
time of recording, provide the library with a better basis for further
development of the desk service.
Conclusion
In
this study, we examined students’ use of the service desks in all branch
libraries at a large university.
During four different weeks throughout the academic year, we mapped desk
activity. We sorted the questions asked in the personal meetings at the desk
into predefined subject categories. Most of the questions were about loan
services, document delivery, and use of and access to physical and electronic
collections (63%). In total, there was little variation between the categories
from week to week, but we did find some differences. For example, there were
more Counselling/Guidance questions in the assignment and exam period in the
spring and more questions of a practical nature in the two autumn weeks.
Results indicated that there was no obvious
relationship between the branch library size and the number of questions asked.
It seems that some study programs have a greater need for library services than
others. This is one of the factors to consider when dimensioning and organizing
the desk service in the future.
Through this study, we have gained more knowledge
about the purpose of students’ use of the service desk. These findings
from a large Norwegian multi-branch library is a unique contribution to the
body of data that already exists internationally about the topic. In our study,
we have developed a recording methodology, which
we think is well suited for other large, multi-branch libraries. If more
researchers use the same recording methodology, it will make it easier to
compare findings between libraries and between countries in the future.
Our
newly gained knowledge has been and will continue to be used for further
development of the desk service at our university. Interesting themes for
subsequent studies could be to investigate the consequences of different types
of follow-up approaches for the fulfilment of student information needs. Other ways to
broaden our knowledge could be to include other user groups as well. Finally,
other communication channels other than the personal meeting at the desk would
be of interest for future researchers.
References
Gerlich, B. K., & Berard, G. L. (2007). Introducing the READ scale: Qualitative statistics for academic
reference services. Georgia Library Quarterly, 43(4), 7-13. https://digitalcommons.kennesaw.edu/cgi/viewcontent.cgi?article=1003&context=glq
Henry, D. B., & Neville, T. M. (2008). Testing classification systems for reference
questions. Reference & User Services Quarterly, 47(4),
364-373.
https://doi.org/10.5860/rusq.47n4.364
Katz, B. (2002). Introduction to reference work,
Vol. 2: Reference services and reference processes (8th ed.).
McGraw-Hill.
Kesselmann, M. & Watstein, S. (1987). The Measurement of reference and
information services. Journal of Academic Librarianship, 13(1),
24–30.
LeMire, S.,
Rutledge, L., & Brunvand, A. (2016). Taking a fresh look: Reviewing and
classifying reference statistics for data-driven decision making. Reference
& User Services Quarterly, 55(3), 230–238. http://dx.doi.org/10.5860/rusq.55n3.230
Lenkart, J., & Yu, J. (2017). Specialized reference services at Illinois:
Reference transactional analysis and its implications for service providers and
administrators. Reference & User Services Quarterly, 56(4),
268–276. https://doi.org/10.5860/rusq.56.4.268
Radford, M. L., & Connaway,
L. S. (2013). Not dead yet! A longitudinal study of query type and ready
reference accuracy in live chat and IM reference. Library & Information
Science Research, 35(1), 2–13. https://doi.org/10.1016/j.lisr.2012.08.001
Ryan, S. M. (2008). Reference transactions analysis:
The cost-effectiveness of staffing a traditional academic reference desk. The
Journal of Academic Librarianship, 34(5), 389–399. https://doi.org/10.1016/j.acalib.2008.06.002
Statistisk sentralbyrå. (2019a). 10872: Opplæring i
bibliotekbruk og primærmålgruppe i fag-og forskingsbibliotek, etter
bibliotektype 2013 – 2019 [Statistikk]. https://www.ssb.no/statbank/table/10872/
Statistisk sentralbyrå. (2019b). 10870: 10870:
Bestand og tilvekst ved i fag- og forskningsbibliotek, etter
statistikkvariabel, bibliotektype og år [Statistikk]. https://www.ssb.no/statbank/table/10870/
Warner, D. G.
(2001). A new classification for reference statistics. Reference
& User Services Quarterly, 41(1), 51–55. https://www.jstor.org/stable/41240900
Appendix
The TREFF-project, registration of questions at the library desk, week
xx (Monday [date] – Friday [date] [year])
Library: Date:
Use one registration form per day. Register each question in the
right category (there may
be several questions per inquiry).
One tallymark per question. REGISTRATE
QUESTIONS ONLY FROM STUDENTS. Do not register questions asked via email or
telephone.
|
Categories |
Opening Hours - 12.00 |
12.00 - 15.30 |
15.30 – Closing Time |
|
Collection and Access (Digital and printed
collections). E.g.: do you have <title>, Where do I
find…, How do I get access… |
|
|
|
|
Counselling/Guidance (Reference questions) E.g.: do you have material about…, is this a
scientific journal article, how to search, where to search… |
|
|
|
|
Citing and Referencing E.g.: how to cite, make bibliographies, use
reference tools (not technical questions about installing programs = IT-questions) |
|
|
|
|
Loan (loan, library card, request) E.g.: loan/return, help with self-check,
questions about due date, resource sharing, collecting requested material,
claims, return receipt, logging into databases |
|
|
|
|
Practical questions (rooms/buildings/equipment) E.g.: where to find study rooms, cafes, auditoriums …, complaint
about bad air, what are the opening hours, where to deliver lost property,
borrow a stapler etc., where is the printer |
|
|
|
|
IT-questions E.g.: laptop printing, printing problems,
internet access, questions about installation and use of software |
|
|
|
|
Other questions (register a tallymark and
write down the question). E.g.:
administrative matters |
|
|
|