Research Article
Election Voting and Public Library Use in the United
States
Brady D. Lund
PhD Student
Emporia State University
Emporia, Kansas, United
States of America
Email: blund2@g.emporia.edu
Beth L. Hendrickson
MLS Student
Emporia State University
Emporia, Kansas, United
States of America
Email: hendricksonbethb@gmail.com
Matthew Walston
MLS Student
Emporia State University
Emporia, Kansas, United
States of America
Email: mwalston@g.emporia.edu
Received: 19 Aug. 2020 Accepted: 28 Oct. 2020
![]() 2020 Lund, Hendrickson, and Walston. This
is an Open Access article distributed under the terms of the Creative Commons‐Attribution‐Noncommercial‐Share Alike License 4.0
International (http://creativecommons.org/licenses/by-nc-sa/4.0/),
which permits unrestricted use, distribution, and reproduction in any medium,
provided the original work is properly attributed, not used for commercial
purposes, and, if transformed, the resulting work is redistributed under the
same or similar license to this one.
2020 Lund, Hendrickson, and Walston. This
is an Open Access article distributed under the terms of the Creative Commons‐Attribution‐Noncommercial‐Share Alike License 4.0
International (http://creativecommons.org/licenses/by-nc-sa/4.0/),
which permits unrestricted use, distribution, and reproduction in any medium,
provided the original work is properly attributed, not used for commercial
purposes, and, if transformed, the resulting work is redistributed under the
same or similar license to this one.
DOI: 10.18438/eblip29824
Abstract
Objective
-
This study examines whether a correlation exists between state-wide voting in
federal elections and state average per capita visits to public libraries in
the U.S. In so doing, it provides insight into the extent to which library
patronage is affiliated with political leaning.
Methods
-
An analysis of data from the 2010, 2012, 2014, and 2016 Public Libraries Survey
and election results from the 2010, 2012, 2014, and 2016 Presidential and House
of Representatives elections (by state) is performed with the assistance of
Tableau, a data visualization program. Scatter plots provide a visual
representation of the data, while correlation coefficients indicate the
strength of relationship between voting and library visits per capita.
Results
-
The findings reveal no significant relationship between public library use and
the vote share of a political party in elections among a state's population.
Conclusions
-
The political leaning of a state
appears to have no correlation with the frequency of library usage among that
state’s population.
Introduction
In recent decades, several studies have
examined the demographics of library patrons and which associated factors help
to predict library use and non-use. Ethnicity, age, and educational attainment,
for instance, all appear to have a modest effect on the extent to which
individuals utilize their public library (Sin, 2012; Sin & Kim, 2008).
These findings are compelling for library administrators, who may use them to
inform outreach and services, as well as to argue for increased spending allocations.
One central demographic attribute among many modern Americans is their
political identity. Political leaning has not yet been well-examined in
relation to public library usage. However, as with factors such as ethnicity
and age, it is important to know whether political leaning impacts library
usage, so that libraries may better conduct outreach and advocate for their
role within their communities.
This study addresses the gap in literature
relating to political leaning and library usage by performing an analysis of
data from the 2010, 2012, 2014, and 2016 elections for the House of
Representatives, and the 2012 and 2016 Presidential elections in the U.S., in
relation to public library usage statistics from the 2010, 2012, 2014, and 2016
Institute of Museum and Library Services’ (IMLS) Public Library Survey.
Correlation analyses of state-wide election results and median per-capita
library visits are performed. The findings of these analyses may give public
library employees, administrators, and researchers a point of advocacy in terms
of the political diversity of library patrons.
Literature Review
Studies involving the relationship between
library usage and various population demographics individuals have existed for
well over a century. Some of the earliest library-related research studies
worked to develop a profile of the “typical” library patron and the community
in which the library served (Wheeler, 1924; Gaskill, Dunbar, & Brown,
1934). Over time, these descriptive studies of library patrons have become an
increasingly perfected art. Researchers like Sin (2012) and Sin and Kim (2008
have recently used advanced statistical techniques like logistical regression
to analyze the relationships between a variety of demographic variables and
library use and non-use.
Several recent studies examined the concept
of “motivation” to use libraries (Aabo & Strand,
2004; Lee, 2007) or deflated motivation or interest that contributes to library
non-use (McNicol, 2004; Nackerud,
Fransen, Peterson, & Mastel,
2013). Often, the strongest motivating factors are found to be related to
outcomes rather than demographic background, for example the motivation to
address an information need. For the purposes of funding libraries, these
findings are informative, as they show that libraries serve the information
needs of diverse populations, not significantly skewed to one group of
individuals. In the perspective of politicians, this likely makes funding
libraries a less partisan issue.
A popular source of secondary data for
studies of library usage is the IMLS’ Public Library Survey (PLS) data (https://www.imls.gov/research-evaluation/data-collection/public-libraries-survey). Huang and Tahamtan
(2018) identified a variety of factors that predict library usage by the
service population, such as the total expenditures of the library. Joo and Cahill (2019) also used the PLS to analyze the
relationship between library expenditures and usage by children and young
adults. Additionally, Burke (2018) used this data source to identify
connections between service availability and usage of public libraries. Kim and
Yu (2011) even suggested using the PLS data to develop an alternative model of
public library management. This data can be used in conjunction with other data
sets, such as state-wide voting statistics, to create new insights about
library services and use.
Starting in 2008, the Online Computer Library
Center (OCLC) in conjunction with the American Library Association published a
report entitled “From Awareness to Funding: A Study of Library Support in
America.” This report examines a variety of factors related to library funding
and support (De Rosa & Johnson, 2008). Major sections of this report are
dedicated to the demographics of who supports public libraries and why. While
politically liberal individuals have been shown in these reports to be the
group most likely to support public libraries even if they do not personally
use them, all political groups have been shown to use the library regardless of
stated political affiliation. Furthermore, members of city councils were
surveyed and indicated high levels of library support (even in comparison to
the general population). The authors of the report conclude that “library
funding support is an attitude, not a demographic” (De Rosa & Johnson,
2008); support cuts across groups, rather than being directly affiliated with
any one group in particular.
While a few studies have looked at relationships
between library usage and political leanings as part of larger studies of
library use predictors, there are no specific longitudinal analyses on this
topic. Carlozzi’s (2018) study, for instance,
examined a myriad of factors that may contribute to usage of a specific public
library system. Using regression analysis, a model that indicated a small
effect attributable to political leaning was provided. This study, however,
examined only one specific context (public libraries in Massachusetts), rather
than a broader scope such as state-wide correlations across the U.S.
Aims
The aim of this study is to examine whether
any correlation exists between election outcomes and public library usage in
the U.S. The findings of this study may inform advocacy or outreach to
underserved populations, as well as potentially serving as a counter or
justification against politicized library funding decisions. This study
facilitates a more complete understanding of the typical library user, by
providing an indication for whether political affiliation is a key
distinguishing factor related to the frequency of library use. This study is
therefore guided by the following research question:
Does a correlation
exist between state-wide voting share in federal elections and state average
per capita visits to public libraries in the U.S.?
Methods
This study analyzes data acquired from 3
publicly-available data sets: 1) the IMLS’ PLS data for the fiscal years 2010,
2012, 2014, and 2016, 2) United States Census data for the same 4 years, and 3)
the election results by state for the House elections in 2010, 2012, 2014, and
2016, the Presidential elections in 2012 and 2016, and the composition of the
state Senates for the 2016 legislative sessions.
For the House data, a percentage was found by
dividing the number of House positions won by Democratic representatives
against the total number of seats available. For the Presidential data, the
percentage of votes for the Democratic candidates were collected by state. For
the Senate composition, the number of Democratic seats held was compared to the
total number of seats on the states’ Senates.
Only Democratic party voting data were
considered, as an assumption was made that given the U.S.’ two-party system, a
direct, inverse relationship exists between Democratic vote share and
Republican vote share. However, there are some third-party votes in every
election, for example the particularly high third-party share of 2016. The data
analysis methods may therefore lead to some discrepancy in the relationship
between the vote share of the two major parties, which is a limitation that may
be examined further in future studies.
The data were analyzed using Tableau, a free
data visualization and business intelligence software. From the PLS, data on
the number of visits for each state were accumulated by adding the total visits
for each public library system within it. The U.S. Census data provides the
most accurate measure of the population of each state. The average number of
visits per person was then calculated using a simple Excel function. Visits per
person by state was the first factor in every comparison, as calculating in
this way rather than using the number of visits alone eliminates the influence
of population size on the totals.
Election data were gathered from data.gov and
transformed into percentages. Subsequently, these data were transferred from
Excel to Tableau, where they could best be manipulated. First, a scatter plot
was developed for each set, with the percent Democratic vote on the x-axis and
average library visits per person on the y-axis. A trend line was placed in
this plot using the slope-intercept formulation. Spearman correlation
coefficients and corresponding p-values were also retrieved from Tableau.

Figure 1
Correlation between
2010 House vote and number of library visits.

Figure 2
Correlation between
2012 Presidential vote and number of library visits.
Results
Figure 1 displays the data visualization for
the 2010 House election. Average library visits per person range from 3.14 in
Texas to 7.65 in Ohio, with an average among all states of 4.67. The percentage
of Democratic representatives ranges from 0% in nine states to 100% in seven
states, with an average of 12.5%. Among
the states with 0 seats won by Democratic candidates, visits per person range
from 3.6 in North Dakota to 6.9 in Wyoming. Among those with 100% of seats
awarded to Democrats, visits per person range from 3.92 in Hawaii to 6.98 in
Connecticut. The correlation for these data sets is 0.29 with a p-value of
0.04. There is a statistically significant increase in visits per person based
on the percentage of Democratic vote, but the relationship is very weak.
The data visualization for the 2012
Presidential election is shown in Figure 2. In the 2012 election, Utah has the
lowest percentage of Democratic votes at 24.8%, but the third highest number of
visits per person. Hawaii has the highest percentage of Democratic votes at
70.6, though just an above average number of visits per person. The correlation
for these data is 0.3 with a p-value of 0.03. There is a very weak relationship
between the Presidential vote by state and the number of library visits per
person.
Shown in Figure 3 is the data plot for the
correlation between visits per person and the number of Democratic
representatives elected in the 2012 House election. Ten states elected no
Democratic representatives, ranging from 3.2 visits per person in North Dakota
to 6.2 visits per person in Wyoming. Eight states elected 100% Democratic
representatives ranging from 3.8 visits per person in Hawaii to 6.8 visits per
person in Connecticut. The correlation for these data is 0.34 with a p-value of
0.01.
Figure 4 displays the data for the 2014 House
election. Overall visits in 2014 ranged from 2.7 in Texas to 7.1 in Ohio. In
this year, 6 states elected Democratic representatives to all open positions
while 11 states elected no Democratic representatives. Among the former group,
the number of visits per person ranged from 3.4 in Hawaii to 6.2 in
Massachusetts. The latter group ranged from 2.9 in West Virginia to 6.3 in
Wyoming. The correlation for this comparison is 0.28 with a p-value of 0.05.
The results show only a slight significance with a very weak positive
correlation for Democratic-favoring states.

Figure 3
Correlation between
2012 House vote and number of library visits.
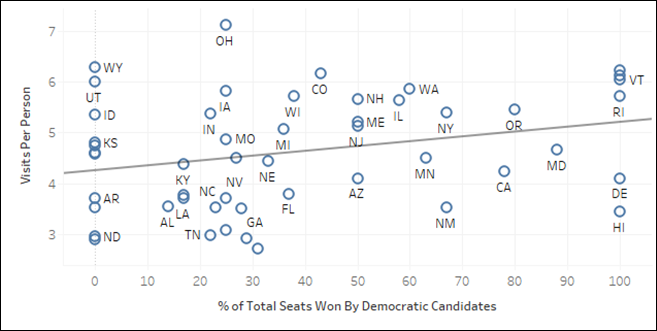
Figure 4
Correlation between
2014 House vote and number of library visits.
Three different data sets were compiled for
the 2016 elections. The first, the 2016 Presidential election, is shown in
Figure 5. This Presidential election seemed to be very unique and polarizing
compared to preceding elections; this is reflected to a small extent in the
data findings. Wyoming had the lowest Democratic vote percentage at 21.6% but
continued to have very high visits per person at 6.1 (ranking only behind Ohio
for the most). Hawaii continued to have the highest Democratic percentage at
62% and continued to have a low visit per person rate at 3.15. There continued
to be a small positive relationship between percentage of Democratic votes and
visits, but the correlation is the weakest so far at 0.22 with a p-value of
0.11. This means that, for the first time in the data, the positive correlation
falls well within the margin of error.
The results for the 2016 House election are
displayed in Figure 6. Eleven states elected no Democratic candidates, with
visits per person ranging from 2.53 (Arkansas) to 6.1 (Wyoming). Six
states elected all Democratic
candidates, with visits per person ranging from 3.15 (Hawaii) to 5.97
(Vermont). The correlation among these data is 0.32 with a p-value of 0.02.
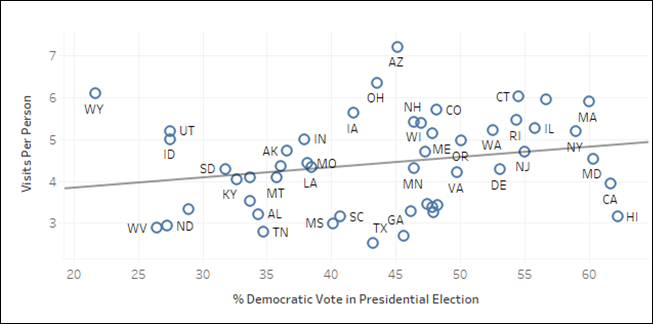
Figure 5
Correlation between 2016 Presidential vote and
number of library visits.
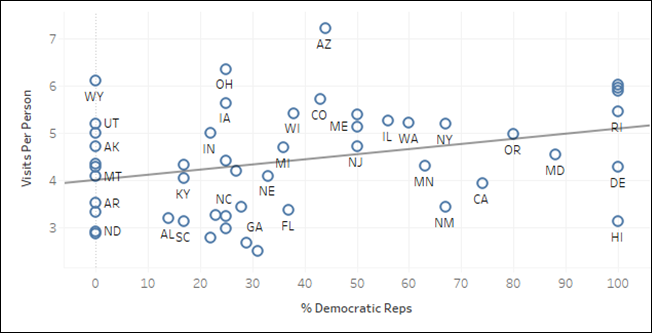
Figure 6
Correlation between 2016 House vote and number of
library visits.
The third set of data for the 2016 election
cycle is the composition of the state Senates, shown in Figure 7. As state and
local governments are mostly responsible for funding public libraries, one
might project that these data would show the strongest correlation yet, however
the exact opposite is true. Wyoming has the smallest composition of Democrats
within its state
Senate at 10%, with the second
largest number of visits per person. Regarding Hawaii, 100% of the state Senate
identifies with the Democratic party, while the state averages only 3.15 visits
per person. Although 3 of the 5 states with the smallest Democratic
compositions fall in the top 10 of states by visits per person, this is
identical to the 5 states with the highest Democratic compositions. The
correlation for these data is only 0.2 with a p-value of 0.18. The slope of the
trend line is 0.011 visits per person per percent point of Democratic senators.
In other words, a 20% shift in a state’s senate composition in favor of
Democrats would only correspond to a 0.2 increase in library visits per person.
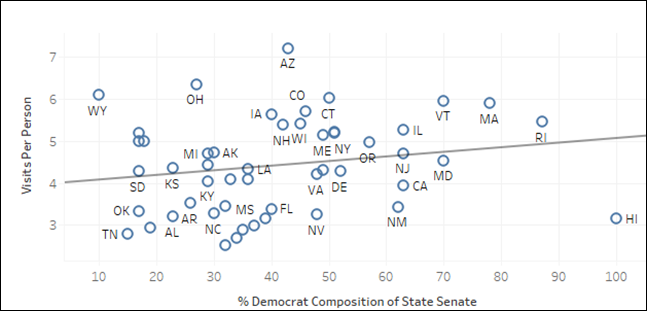
Figure 7
Correlation between
composition of state Senate and number of library visits.
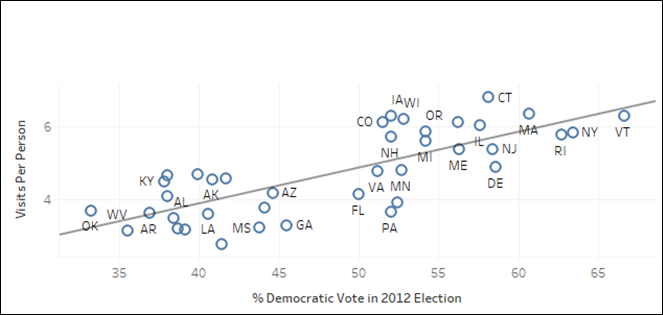
Figure 8
Correlation between
2012 Presidential election vote and number of library visits, with the 10
biggest outliers removed.
Figure 8 depicts the relationship for the
2012 Presidential election, if the 10 biggest outliers such as Wyoming and
Hawaii, were removed from the data. In this case, the correlation between the
two variables rises to 0.71, with a p-value <0.001. This indicates a strong
positive relationship between library visits and the percentage of Democratic
vote, however it also removes 20% of the overall data. So, while there is an
underlying relationship among some states, it is not evident in the complete
data set.
Finally, Figure 9 displays longitudinal data
for library visits in the entire U.S. alongside the percentage of votes for the
Democratic party in each House election from 2010 to 2016. There is a very
weak, non-significant correlation (0.26; p-value of 0.73) for this data set.
While there was a small but steady drop in visits per person over this six-year
period, the percentage of Democratic votes rose by five percentage points in
2012, before dropping in 2014 and 2016. Overall, there seems to be very little
statistical evidence that politics influences library visits, or even that
there is a marked relationship among these variables.
Discussion
This study
indicates that, in general, no correlation exists between election vote share
and public library visits within a state. One important potential reason for
this lack of relationship is that library use statistics remained relatively
consistent from 2010 to 2016, while vote shares did not. For instance,
Minnesota saw a 15% jump in Democratic vote share from 2010 to 2012, though the
average number of library visits remained relatively stable. Notably, the “rust
belt” states of Wisconsin, Michigan, and Pennsylvania, which voted majority
Democratic in 2012, flipped to majority Republican in 2016, however they did
not experience a proportional drop in library use. Political opinions, at least
in the short term, appear to be simply too volatile. Longer-term shifts, like
that of the Southeastern U.S. from majority Democratic to majority Republican
from the 1960s to 1990s, may be more likely to reveal a significant trend.
State Senate race
outcomes seem to be particularly indicative of the lack of correlation between
voting outcomes and library use, as state Senate voting occurs at a more local
scale. For instance, in Kansas, there are 40 Senate seats, including over 20
divided among the state’s 3 major metropolitan areas (Kansas City, Wichita, and
Topeka). However, this approach is complicated by partisan gerrymandering,
which is an approach to drawing congressional districts used by states
dominated by a single political party, in order to increase the likelihood of
their party retaining power during elections. This makes the composition of
state Senates one of the least reliable indicators of political sentiment. As
noted in the limitations below, municipal (city council, mayoral) voting may be
the best outcomes for future studies to utilize.

Figure 9
House vote percent Democrat for all states and
average number of library visits.

Figure
10
United
States Census regions: West, Midwest, Northeast, and South.
Perhaps the most compelling findings in this study may be in Figure 8, where the
10 biggest outliers from the general trend are removed. In the case of the 40
remaining states, a significant positive relationship does exist. However, this
is true of many datasets; if enough data that disagree with a trend are
removed, eventually that trend will emerge from the remaining data. This is one
of the major shortcomings of sampling methods in empirical research and why a
sampling of states was not used in this study.
Furthermore, the
potential for hidden variables that explain variation in the data must be
considered. One such potential variable evident in Figure 8 is geography. The
states in the upper-right corner with high Democratic share and high library
visits are located in the Northeast: Vermont, New York, Rhode Island, Massachusetts,
New Jersey, and Connecticut. Most states in the lower-left corner with low
Democratic share and low library visits are located in the South: Oklahoma,
West Virginia, Arkansas, Kentucky, and Alabama. So, even if a relationship did
exist, the geographic alignment suggests that this might be the hidden variable
that explains both politics and library visit frequency.
Given the above
observation about geographic relationships in both politics and public library
visit frequency, an interesting follow up to this study may be to statistically
evaluate relationships among geographic regions, such as the U.S. Census
regions shown in Figure 10. Regarding the 2016 Presidential election data and
library visit data, for instance, a significant difference can be found using a
Kruskal-Wallis H test (non-parametric ANOVA) for regional differences in both
vote share (H = 4.06, p = .02) and public library visits (H = 5.55, p <
.01). Particularly, the South (in purple in Figure 10) experiences low levels
of both variables, while the Midwest (yellow) has a lower Democratic vote share
compared to the West (red), but a higher number of library visits. This
suggests that general cultural effects (including both library use and
political leaning) attached to geography are a much more likely cause of
variation.
Limitations
A few limitations
should be noted for this study. As mentioned earlier, only Democratic party voting data were considered, which
may lead to some discrepancy in the relationship between the vote share of the
two major parties. This is a limitation that may be examined further in future
studies. Furthermore, this study, while
technically longitudinal (using data from 2010 to 2016), selected a fairly
short period of time in terms of politics; as noted above, the examination of
an extended period of transition in American politics may be more insightful.
Also, this study used states as the unit of analysis, but most public libraries
in the U.S. are municipally supported. Looking at city politics, such as voting
for city councils, and use of specific public libraries may offer some unique
insight. Carlozzi (2018) did examine this variable as
a possible explanatory factor for libraries’ municipal appropriation and did
find that a small effect existed. Finally, there are always some limitations
with incomplete data sources. If a library did not include its visits data in
the PLS data, then it had to be excluded from this analysis.
Conclusion
This study
investigated whether a correlation exists between the state-wide outcomes of
elections and public library visits. The results demonstrate that state-wide
voting share in the U.S. generally has no measurable relationship with public
library usage in these states. Regional variation is a much greater predictor
of both of these variables. This finding separates political diversity from
other variables like educational diversity, that may be used to estimate the
rate of library visits. Populations encompassing all different combinations of
political affiliations, from the most conservative to the most liberal, utilize
public libraries at similarly high levels. Public library
administrators may find this result useful for advocacy and outreach purposes,
as it demonstrates to political decision makers that library use itself is not
a political issue and that libraries may be treated as a neutral public good.
These findings contribute to a growing body of literature that examine
correlates of public library usage in the U.S., indicating that political
polarization is not a factor that has a meaningful influence on library use.
References
Aabo, S., & Strand, J. (2004). Public library valuation, nonuse values, and altruistic motivations. Library &
Information Science Research, 26(3), 351-372. https://doi.org/10.1016/j.lisr.2004.01.003
Burke, I. (2018). Understanding public library services
and use (doctoral dissertation). University of Denver, Denver, CO.
https://digitalcommons.du.edu/etd/1494
Carlozzi, M. (2018). The socioeconomic profile of well-funded
public libraries: A regression analysis. Evidence Based Library and
Information Practice, 13(2), 13-26. https://doi.org/10.18438/eblip29332
De Rosa, C., & Johnson, J. (2008). From awareness to
funding: A study of library support in America. Dublin, OH: Online Computer
Library Center. Retrieved from https://www.oclc.org/research/publications/2008/funding.html
Gaskill, H. V., Dunbar, R. M., & Brown, C. H. (1934).
An analytical study of the use of a college library. The Library Quarterly:
Information, Community, Policy, 4(4), 564-587. Retrieved from https://www.jstor.org/stable/4302123
Huang, L. M., & Tahamtan,
I. (2018). Why do people come? The factors influencing public library visits. Proceedings
of the Association for Information Science and Technology, 55(1), 832-833. https://doi.org/10.1002/pra2.2018.14505501136
Joo, S., & Cahill, M. (2019). The relationships between
the expenditures and resources of public libraries and children’s and young
adults’ use: An exploratory analysis of Institute of Museum and Library
Services public library statistics data. Journal of Librarianship and
Information Science, 51(2), 307-316. https://doi.org/10.1177/0961000617709057
Kim, G., & Yu, S. Y. (2011). An exploratory study to
develop an alternative model of public library management using the Institute
of Museum and Library Services’ Public Library Statistics. The Library
Quarterly, 81(4), 359-382. https://doi.org/10.1086/661656
Lee, S. (2007). Vroom’s expectancy theory and the public
library customer motivation model. Library Review, 56(9), 788-796. https://doi.org/10.1108/00242530710831239
McNicol, S. (2004). Investigating non-use of libraries in the UK
using the mass-observation archive. Journal of Librarianship and Information
Science, 36(2), 79-87. https://doi.org/10.1177/0961000604047134
Nackerud, S., Fransen, J., Peterson,
K., & Mastel, K. (2013). Analyzing demographics:
Assessing library use across the institution. portal: Libraries and the
Academy, 13(2), 131-145. https://doi.org/10.1353/pla.2013.0017
Sin, S. C. J. (2012). Modeling the impact of individuals’
characteristics and library service levels on high school students’ public
library usage: A national analysis. Library & Information Science
Research, 34(3), 228-237. https://doi.org/10.1016/j.lisr.2012.01.002
Sin, S. C. J., & Kim, K. S. (2008). Use and non-use
of public libraries in the information age: A logistic regression analysis of
household characteristics and library services variables. Library &
Information Science Research, 30(3), 207-215. https://doi.org/10.1016/j.lisr.2007.11.008
Wheeler, J. L. (1924). The library and the community.
Chicago, IL: American Library Association.