Research Article
Gathering Evidence of Learning in Library Curriculum
Center Spaces with Web GIS
Rick Stoddart
Library Assessment Coordinator
University of Oregon Libraries
Eugene, Oregon, United States
of America
Email: ricks@uoregon.edu
Bruce Godfrey
GIS Librarian
University of Idaho Library
Moscow, Idaho, United States of
America
Email: bgodfrey@uidaho.edu
Received: 29 Jan. 2020 Accepted: 18 May 2020
![]() 2020 Stoddart and Godfrey. This is an Open
Access article distributed under the terms of the Creative Commons‐Attribution‐Noncommercial‐Share Alike License 4.0
International (http://creativecommons.org/licenses/by-nc-sa/4.0/),
which permits unrestricted use, distribution, and reproduction in any medium,
provided the original work is properly attributed, not used for commercial
purposes, and, if transformed, the resulting work is redistributed under the
same or similar license to this one.
2020 Stoddart and Godfrey. This is an Open
Access article distributed under the terms of the Creative Commons‐Attribution‐Noncommercial‐Share Alike License 4.0
International (http://creativecommons.org/licenses/by-nc-sa/4.0/),
which permits unrestricted use, distribution, and reproduction in any medium,
provided the original work is properly attributed, not used for commercial
purposes, and, if transformed, the resulting work is redistributed under the
same or similar license to this one.
DOI: 10.18438/eblip29721
Abstract
Objective
–This
article reports on a pilot research project that gathered usage statistics in
specifically designated library learning spaces using a Web-based Geographic
Information System (GIS). These learning spaces were then mapped to expected
learning activities that would occur in these areas based on its intention or
design. In this way, the library could begin to associate the usage of a space
with different types of learning. The researchers then mapped these learning
activities to campus learning outcomes to create learning impact statements.
Methods
– The researchers used observation data gathered with
a Web GIS tool to examine space usage within the library’s curriculum center.
Results
– The pilot study found that student usage of the
curriculum center was mainly associated with two campus learning outcomes: (1) Communicate and (2) Learning and Integrate. The evidence also indicated possible design
improvements that may make the curriculum centers spaces more functional for
students.
Conclusions
– The Web GIS tool proved to be a useful tool to
gather evidence of student space usage within the library environment. The
mapping of individual spaces to learning activities further enhanced the
usefulness in interpreting how students are using library spaces. Leveraging
the space usage data within learning outcomes statements created another means
for the library to communicate its learning impact with campus stakeholders.
Introduction
Academic libraries offer diverse learning spaces for
students and researchers. These spaces can range from the traditional quiet
study areas to more dynamic technology-infused spaces such as data
visualization labs or makerspaces. While this variety of library spaces
demonstrate the evolving efforts academic libraries
have undertaken to be responsive to student and researcher needs and
expectations, the core mission of academic libraries remains the same – to
support the learning needs of the communities they serve. Academic libraries
advance their learning mission through the development of resource collections
that support their institution's curriculum and research needs. Libraries also
offer library instruction, workshops, and tutorials that aid in research
productivity, information literacy, and workplace skills. In addition,
libraries create spaces that are conducive to student learning and engagement.
This pilot research project focused on one aspect of the
library’s learning mission – learning spaces. As Van Note Chism (2006)
suggested about learning spaces:
Institutions of higher education are charged with
fostering specific kinds of learning: higher-order thinking abilities,
communication skills, and knowledge of the ways of disciplinary experts, to
name a few. Educators must create structures that support this learning. Space
can have a powerful impact on learning; we cannot overlook space in our
attempts to accomplish our goals. (p. 2.2)
Academic libraries are prime locations for the types of learning
Van Note Chism highlighted by offering dedicated spaces for students to gather,
study, and learn. As a result, libraries have been taking a more active role in
designing and thoughtfully thinking about the physical environment they provide
for their patrons. Van Note Chism pointed to Monahan's (2002) idea of a
"built pedagogy" as one way to think about this idea of intentionally
designed learning space.
However, as libraries create and cultivate these diverse
learning environments, they remain challenged to assess and evaluate what types
of learning activities occur in these spaces – especially if the learning
activity, such as studying, is self-directed by students. This article reports
on a research project for which researchers gathered usage statistics in
specifically designated library learning spaces using a Web-based Geographic
Information System (GIS). These learning spaces were then mapped to expected
learning activities that would occur in these areas based on its intention or
design. In this way, the library staff could begin to associate the usage of a
space with different types of learning.
This work builds on previous research by the authors that
detailed the technical, technology, and some methodological aspects of this
project that focused primarily on data gathered in the main library (Godfrey
& Stoddart, 2018). This current article reports on a different dataset
concentrating on one specific library space, the Curriculum Center, which is
embedded in the university's College of Education. In addition, this article
focuses more directly on mapping usage data to campus learning objectives.
Objective
Documenting learning in libraries has always been a
challenge. Gate counts capture the number of patrons who walk through the door
but do not illuminate where in the library patrons go, or what learning
activities patrons undertake when in the library. Traditionally, libraries are
viewed as a space for students to study, which can also be seen as a form of
self-directed learning. Self-directed learning is an essential form of learning
that often occurs outside of the classroom. Many libraries now offer additional
spaces such as computer labs where students apply, create, and integrate
knowledge through completing homework assignments, writing papers, or
interacting with online learning management systems. Libraries also often offer
group spaces where students can collaborate in teams to complete projects or
study. Additionally, libraries have begun to build dynamic spaces such as
audio/visual labs or makerspaces where students can create or apply knowledge
in a hands-on technology-rich environment. Within all these possible library
spaces, simple gate counts are an insufficient measure to adequately express
how learners interact with the library and leverage these spaces for learning
or other activities.
Recently, the University of Idaho completely remodeled
the College of Education building, including its Curriculum Center, which is
staffed by library personnel. The new Curriculum Center space includes a
collection area of five shelving units for materials, a service point for
circulation and research assistance, a bank of five computers for printing and
writing, a group table for study and collaboration, and various soft seating
elements for study, relaxation, and gathering.
This article focuses specifically on data and
observations captured at the Curriculum Center in these newly designed spaces
using GIS, and how this data might inform the reporting of the library’s
contributions to campus learning outcomes. The intended goal of this research
is to be able to gather evidence that would support statements connected to
relevant campus learning outcomes similar to the one articulated below:
Curriculum Center Learning Outcome Statement: Communicate
The Curriculum
Center supports the campus learning outcome of Communicate by offering spaces, such as computer stations and a
public demonstration space, that encourage acquiring, articulating, creating,
and conveying meaning. In 2017, the Curriculum Center recorded X# interactions in these Communicate supporting spaces and observed X# patrons using these resources.
Method:
Evidence-based Research
Koufogiannakis and Brettle (2016) outlined an
evidence-based framework based on Booth’s collaborative model (2009) to guide
researchers and practitioners. This evidence-based cycle is as follows: Articulate. Assemble. Assess. Agree. Adapt.
This model is used by researchers and practitioners to assist in developing
their evidence-gathering for research projects and decision-making. The
evidence-based framework also helped construct the pilot project methodology
detailed below and was embedded within the traditional research paper structure
of Introduction, Objective, Literature Review, Methods, Results, Discussion,
and Conclusion.
Articulate the Question
The development of guiding questions for this study was
intended to determine if students are using the new furniture and spaces in the
Curriculum Center, as well as an attempt to map this usage to related campus
student learning outcomes. The research questions were as follows:
What is the student
usage of the new Curriculum Center spaces/furniture?
Can this usage data
be mapped to campus learning outcomes?
Assemble the Evidence
The evidence gathered for this pilot project consists of
internal evidence available from local data sources, external evidence
available from the literature, and evidence gathered from research associated
with the Web GIS pilot project. In combination, these sources of evidence
informed the research direction for this pilot project.
External Evidence (Literature Review)
Libraries have been quick to embrace exploring various
design elements to expand the learning opportunities available to their
patrons. This is evidenced by the rise in redesigned library spaces such as
learning commons, makerspaces, and ideation rooms that allow for flexible
interaction with design elements and technology. Evaluation of these spaces has
been a challenge for some libraries. Ferria et al.
(2017) noted "There is a growing concern for universities to evaluate
their library facilities, services, technology, and information resources to
determine the impact on student learning and how library supports the research
and public service mission of the institution” (p. 20).
One significant development for library space evaluation
has been the work undertaken by Casden et al. (2020),
researchers at North Carolina State University. Using their SUMA tablet-based
space assessment tool, they investigated library space usage, activities, and
transactions. This mobility to gather evidence using a tablet and manipulate
the data into visualizations or dashboards was an inspiration for the authors
to undertake their own research in this area. However, this particular study
leveraged locally available GIS expertise and Web GIS instead of deploying a
SUMA software application installation or building other technology evaluation
options from scratch. The study was
a continuation of the work undertaken previously by the authors (Godfrey &
Stoddart, 2018) that demonstrated the feasibility of using Web GIS as a means
to capture and articulate library space usage. The research is also built upon
the previous GIS library space work such as that by Bishop and Mandel (2010),
Coyle (2011), Elliott (2014), Given and Archibald (2015), Mandel (2010), and Xia
(2004, 2005) that all explored the connections of GIS and library space
evaluation.
In addition to gathering data on space usage, the authors
were interested in exploring the possibility of more direct ways to connect
activities that occur in library spaces to campus learning outcomes. After all,
these newly reimagined spaces were intentionally designed to facilitate certain
types of activities associated with learning. For example, learning commons
areas where students research and write papers is associated with knowledge
creation; or collaboration spaces, such as group study rooms, contribute to
communication and teamwork development. Monahan (2002) suggested the term built pedagogy as the way the design of
learning environments influences what forms of learning might be accessible to
students interacting in such spaces. An example of this built pedagogy would be a room of unmovable study carrels which
would convey a pedagogy of conformity. This sort of design has built-in
parameters on the types of learning that could effectively occur in such a
space constraining learning actions to individualized studying and limited
interaction from peers. Conversely, a learning environment that has moveable
tables and chairs suggests a pedagogy of freedom, collaboration, and discovery.
Scholars such as Jonassen and Land (2000), Oblinger
(2006), and Savin-Baden (2008) also put together
works examining the theoretical and functional aspects of learning spaces that
influenced the thinking behind this pilot research project. In particular,
Mathews and Soistmann's recent work (2016) about
responsive, flexible design concepts and learning environments inspired the
research as exemplified by their suggestion that "space imparts
action" (p. 30). We also believed that thoughtful library designed space
might influence the act of learning in beneficial ways.
Evidence-based librarianship offers a useful framework to
begin connecting space usage data to campus learning outcomes. Evaluation of
library spaces and evidence-based research are not strangers to each other.
Recent examples include evidence-based library space research undertaken by
Asher (2017), who examined a library's learning commons, as well as Ferria et al. (2017) who investigated in what ways students
are using library spaces for learning and social engagement. The researchers
for both of these studies used a mixed-methods approach. Still, other
evidence-based methodologies for library space evaluation have included
photographic research methods (Bedi & Webb,
2017), longitudinal observation (Fox & Doshi, 2013), and ethnographic
investigation (Tewell et al., 2017).
In summary, this study leveraged the methodology
processes and research assembled by the research base of evidence-based
librarianship, GIS library space evaluation, and purposely designed learning
spaces.
Internal Evidence
While library staff can capture gate count data from the
main library’s electronic security gates, they do not have that option for the
Curriculum Center because of its open design. Circulation data on collection
use was available, but it only reflected usage in one area of the Curriculum
Center and did not take into account browsing or other
activities. To remedy this lack of space usage data, the Curriculum Center
staff began keeping observational statistics in an online spreadsheet. However,
this spreadsheet was not designed or intended as a sophisticated data
instrument. Spreadsheet usage data was organized simply by observed activity
such as browsing or studying and did not include elements such as location or
time of day. Therefore, inferences can only be made about how patrons were
using the Curriculum Center but not where within the multiple potential
learning spaces available such activities were occurring. In order to begin
gathering this different level of detail, a new method was needed to fully
capture learning activities within the Curriculum Center.
A good starting point to begin to understand how the
Curriculum Center spaces might impact student learning was to examine the
center's layout to reveal the intentionality of its design more clearly. A map
of the Curriculum Center was created based on various attributes such as
seating, study tables, or collections – as well as available technology such as
computer terminals (see Figure 1).
Once a detailed map of the Curriculum Center was created,
the next step was to connect this map to potential learning outcomes or
activities that might occur within these areas. The Learning Space Taxonomy,
part of the Learning Space Toolkit (https://learningspacetoolkit.org/space-types/learning-space-mind-map/index.html), was used to map activities associated with the
Curriculum Center (see Figure 2). Data collectors were asked to record comments
if observations were outside expected space activities. The taxonomy groups
activities into five broad categories:
·
Focus (listening,
studying, meditating, viewing, etc.)
·
Create (designing,
editing, writing, producing, etc.)
·
Collaborate
(brainstorming, demonstrating, discussing, meeting, presenting, etc.)
·
Share (assessing,
teaching, tutoring, advising, etc.)
·
Socialize (eating/drinking,
gaming, networking, etc.)

Figure 1
Curriculum Center spaces.
These learning taxonomy categories are then mapped to
corresponding university learning outcomes (see Table 1).
Once spaces on the map of the Curriculum Center spaces
were assigned, the authors met and discussed the types of taxonomy activities
that would most likely occur in these areas (see Table 1 and Figure 2). For the
seating areas identified in the Curriculum Center, it was thought that studying
would be the most appropriate activity, so the researchers associated this area
with focus. The Curriculum Center
collections area, which encompassed
the available stacks of books, was also associated with focus as patrons used this area to view or browse materials. For
the computer area, the authors associated this with create as this was the place where
writing and editing most likely would occur. The study table was associated
with collaborate, as this was the
most prominent group space in the Curriculum Center. While the front desk in
the Curriculum Center is a service point to check out materials, it is also a
place to ask questions or seek assistance. With this in mind, the front desk
was associated with share for the
teaching and advising aspect that occurs there. Share was also associated with the rug space as this area is
envisioned as a place where story times or informal teaching opportunities
might happen. Based on the learning space taxonomy that was being used for the
study and the associated spaces in the Curriculum Center, the researchers were
able to crosswalk these space usage criteria to the campus learning goals (see
Table 1).
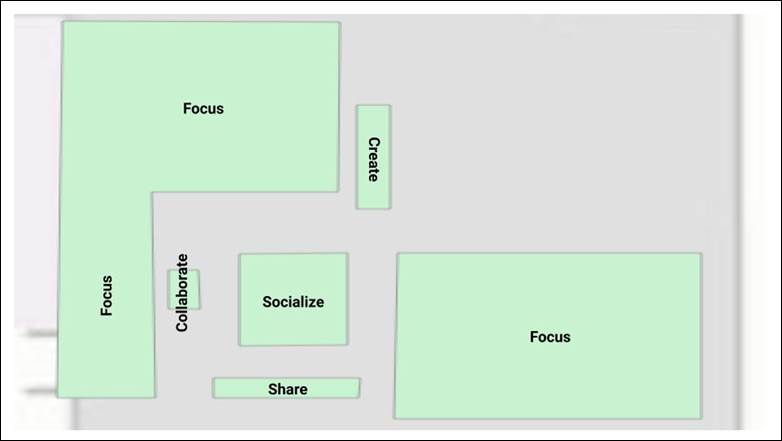
Figure 2
Curriculum Center learning taxonomy.
Table
1
Curriculum
Center Learning Spaces Taxonomy
|
Learning
Taxonomy |
Learning
Outcome |
Activity |
Space |
|
Focus |
Learn &
Integrate |
listening,
studying, meditating, viewing |
Seating, Collections |
|
Create |
Communicate |
designing,
editing, writing, producing |
Computers |
|
Collaborate |
Learn &
Integrate |
brainstorming,
demonstrating, discussing, meeting, presenting |
Study table |
|
Share |
Learn &
Integrate |
assessing,
teaching, tutoring, advising, |
Front Desk |
|
Socialize |
Communicate |
eating/drinking,
gaming, networking, |
Rug space, |
This mapping did not indicate that Curriculum Center
space usage was a direct measure of a particular learning outcome, rather this
research was intended to gather evidence to better communicate to stakeholders
how libraries contribute to supporting learning on campus. Additionally, every
single campus learning outcome would not be captured by the learning taxonomy
assigned within the Curriculum Center spaces (see https://www.uidaho.edu/learningoutcomes for a full list of learning outcomes). Similarly, there
might be multiple learning outcomes associated with activities occurring in
library spaces. For the simplicity of this research project, a primary learning
outcome was assigned to each taxonomy. Thus, this study created an indirect
assessment of potential learning activities
that might be occurring in Curriculum Center spaces. This study relied
heavily on the assumption that the spaces were designed appropriately to
facilitate and enhance specific types of learning (i.e., built pedagogy).
Ultimately, the data gathered was intended for the Curriculum Center to begin
to evaluate the effectiveness of these intentionally designed spaces. Also,
this evidence acts as another data point from which to construct new narratives
on campus regarding the role libraries and the curriculum play in contributing
to student success and learning.
Capturing Data with the GIS Pilot Project
These maps articulating the learning spaces within the
Curriculum Center were useful to understand how patrons might operationalize
these areas for their learning development. However, without capturing the
actual usage of the spaces, it was uncertain if and when these learning spaces
were utilized for their intended purposes or even other activities not
envisioned by the designers. Because of their previous familiarity with this
technology, the authors wondered if a Web-based GIS application would be an
appropriate tool to capture detailed patron space usage data in the Curriculum
Center. In addition to obtaining location-specific information, a Web GIS
data-gathering tool would afford a flexible means to begin gathering usage data
without a significant expenditure of library resources or technical training.
After some preliminary investigation of Web GIS tools,
the researchers selected Collector for ArcGIS (https://www.esri.com/en-us/arcgis/products/collector-for-arcgis/overview) as the most appropriate application to gather data via
a desktop computer that directly observed the Curriculum Center. There were
many advantages of using Web GIS for this research project. A support network
and infrastructure was already in place to work with
Web GIS on campus. There was direct access to expertise from a dedicated GIS
librarian as part of the research team. The researchers were able to use
off-the-shelf technology and Web GIS software that was already available on
campus and relatively easily installed on library computers. Additionally,
there was the potential to engage student workers with Web GIS as an
experiential learning activity they might be able to put on their resume. There
was also the future potential to collaborate on similar library spaces projects
with regional libraries that already had GIS expertise on their campuses. The
authors' previous study (Godfrey & Stoddart, 2018) outlined in more detail
the technology and technical specifics of using Web GIS for space assessment.
The researchers and trained staff gathered data by observation during the
operating hours of the Curriculum Center. Observation data were inputted into
Collector for ArcGIS, a mobile-data collection application installed on the
desktop computer used at the Curriculum Center circulation desk service point.
Data-gathering occurred when observed as opposed to randomly assigned times or
via a specified schedule. Staff were instructed to input the number of patrons
in predefined areas and to include written notes in an open data field
regarding activities occurring. During an observation, a patron might be seen
traversing between different Curriculum Center spaces. For example, a patron
might be seen looking for books in the Curriculum Center stacks and then taking
these items to sit down and read. In such instances, when multiple actions were
occurring by the same patron(s) across different learning spaces within the
Curriculum Center, each item was recorded as a distinct observation in
Collector for ArcGIS. As such, the data recorded is more concerned with
activities occurring within spaces rather than patrons themselves.
Limitations with the GIS Pilot Project
While Collector for ArcGIS offered a ready-made tool for
gathering data about space usage in the Curriculum Center, the project did
encounter some issues as it rolled out. One of the first issues encountered was
accessibility issues with the GIS application related to campus computers.
Collector for ArcGIS needed to be installed on the curriculum service point
computer, as well as be made accessible via all workplace computer Curriculum
Center accounts when they signed in. This required campus IT staff to become
involved in installation and access of the software but also to resolve staff
access issues when computer updates created unexpected problems. The IT staff
response time to resolve application and account issues often resulted in
delays in data-gathering. While campus IT delays were at times a limiting
factor, Collector by ArcGIS was already a campus approved form of software,
which meant that other software might have taken even longer to support and
install.
Additionally, data fidelity issues arose from staff
interrater reliability complications associated with the first iterations of
the GIS survey instrument. Earlier iterations of this pilot project asked data
collectors to not only indicate the number of users in a specific place but to
select from a list of patron activities observed. For example, for a patron
viewed in the computer area
working on a homework assignment, the data collector might select composing a paper from a list of
activities provided in the survey instrument. Activities in the list were then
mapped to official university learning outcomes (https://www.uidaho.edu/learningoutcomes) such as communicate,
think and create, and others. However,
based on feedback from the Curriculum Center staff participating in the pilot
project, inputting this extra datapoint from the dropdown list was too
burdensome to gather within the time constraints of recording each observation.
Staff also admitted confusion between learning activity items like using library computers and individual studying as being similar.
In some cases, these learning activities were too subjective for accurate
interpretation without being overly intrusive to the patrons (e.g., looking
over a patron's shoulder). With this constructive feedback in mind, the
methodology associated with data-gathering was refined and simplified to only
capture usage in designated spaces. The GIS observation form only asked the
observer to indicate the number of people in a given area and to make a
notation if the observed activity was not congruent with the learning intention
behind the space design. For example, if staff observed a single student by the
library computers working on a paper, they would note on the GIS form that one
student was in the library computer area and nothing else because the student
was using the space as intended. However, if a group of students was observed
around a computer, the staff person might indicate on the form the number of
patrons by the computer area, but also include a notation that the observation
was more akin to group study. This approach simplified data entry for staff and
also captured if spaces were being used as intended or in unintended ways.
Thus, the dataset reported in this article for the
Curriculum Center did not require data collectors to assign observed patron
activities but instead pre-assigned learning taxonomy activities to spaces (see
Figure 2 and Table 1).
Results: Assess
Evidence
Once the evidence has been assembled, it must be assessed
within the context of the research question(s) as they have been articulated.
This pilot project gathered evidence to help answer What is the student usage of the new Curriculum Center
spaces/furniture? and Can this usage
data be mapped to campus learning outcomes?
What is the Student Usage of the New Curriculum Center
Spaces/Furniture?
The GIS space assessment tool was successful in
documenting space usage in the Curriculum Center and offered evidence about how
patrons were using this new space. Staff recorded 1,235 observations using the
GIS instrument during the Fall 2017 data collection period (see Figure 3). In
total, there were 1,837 patrons observed using the Curriculum Center, either
individually or in groups.
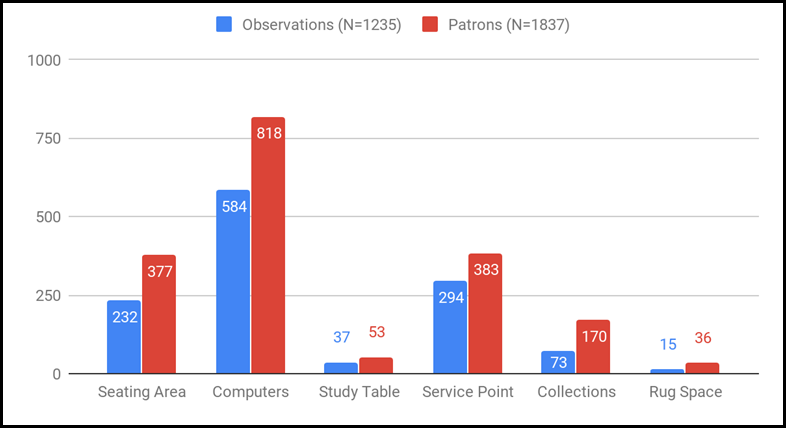
Figure 3
Curriculum space usage – Fall 2017.
The data indicated that the area patrons used most in the
Curriculum Center was the bank of computers. Staff observed 584 interactions in
this space, comprised of 818 patrons. These results were not surprising as many
students stopped by to print course materials or homework assignments before
class. However, what is striking about usage in this space is that these
computer stations were designed for individual usage. Still, data and staff
observations indicated that many students gathered around these computers in
groups. This is supported by the evidence that 818 patrons were observed using
this space, while there were only 584 interactions, which indicates that 234
students were gathering in groups. This finding suggests that this computer
space might need to be re-envisioned to be more conducive for group work.
Conversely, the large study table area, which was
intended as a student collaboration space, only saw limited group usage as
evidenced by 53 patrons using this space during 37 interactions, indicating
that only 16 students used this space for group work. Compare this data with
the seating area, which saw 377 patrons using this space from 232 observations,
suggesting that 45 students gathered in groups in this seating space, which is
an intended function of this flexible area. These group table findings are open
to further study or interpretation as they might suggest that patrons are
uncomfortable sharing table space or that further promotion of these spaces as
collaboration areas might be needed.
The Curriculum Center collection was another area that
saw students gathering in groups, which might be unexpected to some. However,
this can be attributed to the various library instruction classes and education
courses that required usage of the Curriculum Center collections for class assignments.
Students were often given class time to visit the Curriculum Center in groups
to locate materials.
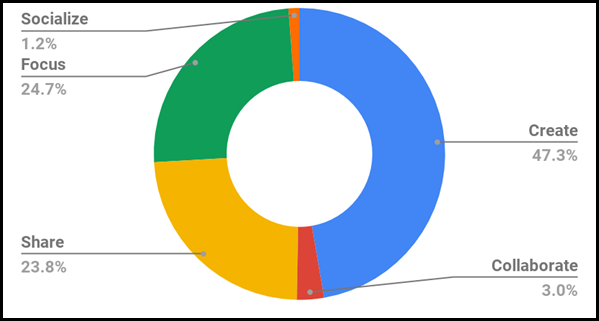
Figure 4
Curriculum Center learning taxonomy – Fall 2017.
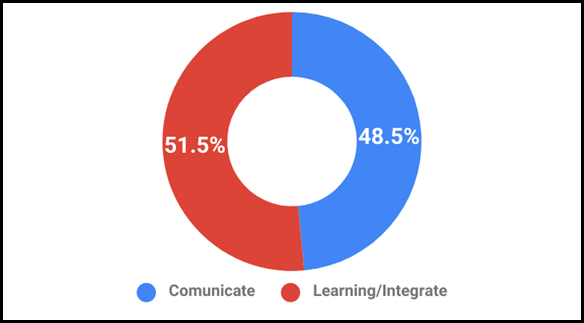
Figure
5
Curriculum
Center campus learning outcomes – Fall 2017.
Can this Usage Data be Mapped to Campus Learning
Outcomes?
Beyond capturing a snapshot of how the Curriculum Center
spaces were used by students during the term, this research project also wanted
to explore how such evidence might be mapped to campus learning outcomes. As
previously discussed, the Curriculum Center spaces were assigned to a learning
space taxonomy and then cross-walked further to campus learning outcomes. This
mapping to outcomes allows for viewing library spaces not only in terms of
usage but also within the greater overall context of a learning environment.
The most used space in the Curriculum Center was the
computers, which were associated with the learning space taxonomy descriptor create (47.3%) (see Figure 4). This was
followed by focus (24.7%) as mapped
to the Curriculum Center seating area and collections and then share (23.8%), which was assigned to the
combined circulation/reference help service point. Mapping and attaching usage
data in this manner allow the Curriculum Center to not only state that they
offer computers, a study table, seating, and computers, but also spaces that
promote creating, sharing, focus, and collaboration.
Additional mapping to the campus learning outcomes is
another way to indicate to campus stakeholders how the Curriculum Center
supports learning on campus. Based on this mapping, the pilot study space usage
observation data suggested that the Curriculum Center spaces mainly supported
two campus learning outcomes with its spaces, collections, service point, and
technology (see Figure 5). The campus learning outcomes that the Curriculum
Center supported are Learning/Integrate (51.5%) and Communicate (48.5%).
The campus learning outcomes associated with the
Curriculum Center are stated in more detail below and are intended for
"students to be able to…":
Learn and integrate
Through independent
learning and collaborative study, attain, use, and develop knowledge in the
arts, humanities, sciences, and social sciences, with disciplinary
specialization and the ability to integrate information across disciplines.
Communicate
Acquire,
articulate, create and convey intended meaning using verbal and non-verbal
methods of communication that demonstrate respect and understanding in a
complex society.
These two learning outcomes align with the information
literacy, research, and educational mission of both the library and Curriculum
Center at the University of Idaho. Therefore, it was not surprising that the
Curriculum Center spaces aided in supporting these learning outcomes. However,
what has not always been available is usage statistics and evidence that
demonstrates the ongoing contribution libraries and curriculum centers make in
supporting such outcomes.
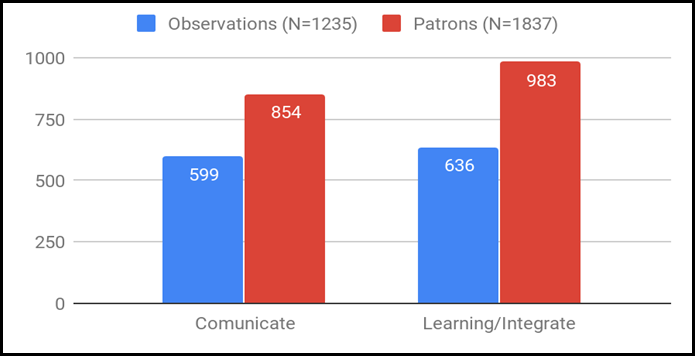
Figure
6
Observations/patrons
to learning outcomes – Fall 2017.
Creating Learning Outcomes Statements
By leveraging the space usage data and mapping to campus
learning outcomes, it is now possible for the Curriculum Center to make
stronger statements about how library spaces support learning on campus. Using
both observation and patron count data, the Curriculum Center can create
prepared statements suitable for stakeholder reporting and public promotion the
campus-wide learning outcomes of Communication and Learning and Integration
(see Figure 6). Examples of such
learning outcomes-oriented statements for the Curriculum Center are shared
below:
Curriculum Center Learning Outcome Statement: Communicate
The Curriculum
Center supports the campus learning outcome of Communicate by offering spaces, such as computer stations and a
public demonstration space, that encourage acquiring, articulating, creating,
and conveying meaning. In 2017, the Curriculum Center recorded 599 interactions in these Communicate supporting spaces and
observed 854 patrons using these
resources.
Curriculum Center Learning Outcome Statement: Learning
and Integrate
The Curriculum
Center supports the campus learning outcome of Learn and Integrate by offering spaces, such as discipline-specific
collections, flexible seating, and a group study table that encourage
independent learning and collaborative study to develop knowledge and integrate
information across disciplines. In 2017, the Curriculum Center recorded 636 interactions in these Learn and Integrate supporting spaces
and observed 983 patrons using these
resources.
Once learning outcomes specific statements are created,
they can be used as templates for future reporting needs, enhanced with
periodically updated data as necessary. It also may be possible to create a
dynamic real-time dashboard using the GIS application to fill in data fields
automatically.
Discussion
Agree
The authors agree that the Web GIS pilot study proved
useful in gathering data to articulate space usage and map data to learning
outcomes. The Collector for ArcGIS application demonstrated its utility as an
instrument for library space assessment. The mapping of specific library spaces
to learning outcomes also showed merit in conveying library value beyond simple
gate-counts. If viewed as a proof-of-concept methodology from both a
technological and data reporting viewpoint, this research project was successful.
The authors admit there are both technological and
training improvements that are required to strengthen the data collection
aspects of this research. Some changes would be needed if this project were to
move from a pilot to a more formal assessment undertaking. First, there needs
to be ongoing refinement of the GIS instrument to ease and clarify aspects of
data collection by staff. The application is being updated quarterly and
suggested enhancements can be contributed to ArcGIS Ideas. While there remains
a slight learning curve associated with data
collection for users, this was not insurmountable and remained no different
than using most any other new piece of software. However, anything that could
be done through technological design to make data-gathering smoother for staff
would be welcomed. Second, the continued and ongoing reinforcement of data
collection training would be necessary to increase the interrater reliability
of the observations captured. Overall, the pilot project was successful in
achieving its objectives to demonstrate how an off-the-shelf application could
capture space usage evidence and map these to campus learning outcomes.
Adapt
Lessons learned from this project included the need to
consider adding collaborative computer seating in the Curriculum Center to
accommodate students who work in groups. Additional promotion of Curriculum
Center spaces such as the group study table might also be necessary.
Typically, the authors would list the next steps to
transition this pilot project toward a more established library assessment
program. Some ideas have included a real-time data dashboard, adding more
descriptive survey questions to the GIS instrument to capture student
activities, partnering with other institutions to gather similar space usage
data for peer comparison, and leveraging the location-specific aspects of GIS
to pinpoint which areas within library spaces are preferred by students.
However, despite agreement by the researchers about the positive outcomes and
potential of this pilot project, library administration did not see a suitable
venue to report out the project data and felt that resources and staff time
would be better spent elsewhere. Despite this, there remains untapped potential
for Web GIS applications such as Collector for ArcGIS to assist with capturing
student usage in library spaces.
Conclusion
While the pilot project did not capture direct measures
of learning within the Curriculum Center, the evidence demonstrated active
student engagement within these learner-centric design spaces. Additionally,
these data suggested potential design improvements that might be needed in such
areas to make them more functional to students. The research indicated that Web
GIS applications, such as Collector for ArcGIS, offer a practical and flexible
tool for library space assessment. The mapping of specific library areas with a
learning space taxonomy provided an opportunity to more clearly connect library
efforts to learning outcomes that might more strongly resonate with
stakeholders compared to traditional library usage statistics. Articulating the
learning value of library spaces to stakeholders demonstrated that money is not
wasted and that libraries have a positive impact supporting student success.
References
Asher, A. (2017). Space use in
the commons: Evaluating a flexible library environment. Evidence Based Library and Information Practice, 12(2),
68-89. https://doi.org/10.18438/B8M659
Bedi, S., & Webb, J. (2017). Through the students’ lens:
Photographic methods for research in library spaces. Evidence Based Library and Information Practice, 12(2),
15-35. https://doi.org/10.18438/B8FH33
Bishop, B. W., & Mandel, L.
H. (2010). Utilizing geographic information systems (GIS) in library research. Library Hi Tech, 28(4), 536-547. https://doi.org/10.1108/07378831011096213
Booth, A. (2009). EBLIP
five-point-zero: Towards a collaborative model of evidence-based practice. Health Information and Libraries Journal, 26(4),
341-344. https://doi.org/10.1111/j.1471-1842.2009.00867.x
Casden, J., Rucker, R., Aeschleman, L., Davidson, B., & Beswick, K. (2020).
SUMA. In North Carolina State University Libraries. Retrieved 17 October
2017 from https://www.lib.ncsu.edu/projects/suma
Coyle, A. (2011). Interior library GIS. Library
Hi Tech, 29(3), 529-549. https://doi.org/10.1108/07378831111174468
Elliott, R. (2014). Geographic
information systems (GIS) and libraries: Concepts, services and resources. Library Hi Tech News, 31(8), 8-11. https://doi.org/10.1108/LHTN-07-2014-0054
Ferria, A., Gallagher, B., Izenstark, A., Larsen, P., LeMeur, K., McCarthy, C., & Mongeau,
D. (2017). What are they doing anyway?: Library as
place and student use of a university library. Evidence Based Library and Information Practice, 12(1),
18-33. https://doi.org/10.18438/B83D0T
Fox, R., & Doshi, A.
(2013). Longitudinal assessment of “user-driven” library commons spaces. Evidence Based Library and Information
Practice, 8(2), 85-95. https://doi.org/10.18438/B8761C
Given, L., & Archibald, H.
(2015). Visual traffic sweeps (VTS): A research method for mapping user
activities in the library space. Library
and Information Science Research, 37(2),
100-108. https://doi.org/10.1016/j.lisr.2015.02.005
Godfrey, B., & Stoddart, R.
(2018). Managing in-library use data: Putting a Web Geographic Information
Systems Platform through its paces. Information
Technology and Libraries, 37(2),
34-49. https://doi.org/10.6017/ital.v37i2.10208
Jonassen, D. H., & Land, S. M. (2000). Theoretical foundations of learning environments. Mahwah, N.J:
Lawrence Erlbaum Associates.
Koufogiannakis, D., & Brettle, A. (2016). Being evidence based in library and
information practice. Chicago, IL: Neal-Schuman.
Mandel, L. H. (2010).
Geographic Information Systems: Tools for displaying in-library use data. Information Technology and Libraries, 29(1),
47-52. https://doi.org/10.6017/ital.v29i1.3158
Mathews, B. & Soistmann, L. A. (2016). Encoding space: Shaping learning environments that unlock human
potential. Chicago, IL: ACRL.
Monahan, T. (2002). Flexible
space & built pedagogy: Emerging IT embodiments. Inventio, 4(1), 1-19.
Oblinger, D. (2006).
Learning spaces. Washington, DC: EDUCAUSE.
Savin-Baden, M. (2003). Facilitating
problem-based learning: Illuminating perspectives. Maidenhead: Society for
Research into Higher Education.
Tewell, E., Mullins, K., Tomlin, N., & Dent, V. (2017).
Learning about student research practices through an ethnographic
investigation: Insights into contact with librarians and use of library space. Evidence Based Library and Information
Practice, 12(4), 78-101. https://doi.org/10.18438/B8MW9Q
Van Note Chism, N. (2006).
Challenging traditional assumptions and rethinking learning spaces. In D. Oblinger
(Ed.) Learning spaces. Washington, DC: EDUCAUSE.
Xia, J. (2004). Library space
management: a GIS proposal. Library Hi
Tech, 22(4), 375-382. https://doi.org/10.1108/07378830410570476
Xia, J. (2005). Visualizing
occupancy of library study space with GIS maps. New Library World, 106(5/6), 219-233. https://doi.org/10.1108/03074800510595832