Research Article
University Students’ Changing Library Needs and Use: A
Comparison of 2016 and 2018 Student Surveys
Jung Mi Scoulas
Clinical Assistant Professor
and Assessment Coordinator
University of Illinois at
Chicago, University Library
Chicago, Illinois, United
States of America
Email: jscoul2@uic.edu
Sandra L. De Groote
Professor and Head of
Assessment and Scholarly Communications
University of Illinois at
Chicago, University Library
Chicago, Illinois, United
States of America
Email: sgroote@uic.edu
Received: 10 Aug. 2019 Accepted: 6 Jan. 2020
![]() 2020 Scoulas and De Groote. This is an Open
Access article distributed under the terms of the Creative Commons‐Attribution‐Noncommercial‐Share Alike License 4.0
International (http://creativecommons.org/licenses/by-nc-sa/4.0/),
which permits unrestricted use, distribution, and reproduction in any medium,
provided the original work is properly attributed, not used for commercial
purposes, and, if transformed, the resulting work is redistributed under the
same or similar license to this one.
2020 Scoulas and De Groote. This is an Open
Access article distributed under the terms of the Creative Commons‐Attribution‐Noncommercial‐Share Alike License 4.0
International (http://creativecommons.org/licenses/by-nc-sa/4.0/),
which permits unrestricted use, distribution, and reproduction in any medium,
provided the original work is properly attributed, not used for commercial
purposes, and, if transformed, the resulting work is redistributed under the
same or similar license to this one.
DOI: 10.18438/eblip29621
Abstract
Objective
– This study examines differences in university
students’ library use and satisfaction (e.g., in-person library visits, online
and print resource use, space satisfaction, and library website use) between
2016 and 2018 based on local survey data. It also discusses how these findings
provided guidance for future planning and action.
Methods – The academic university library developed the
surveys for undergraduate and graduate students and distributed them in Spring
2016 and 2018.
Both student surveys focused on examining students’ needs relative to library
resources and services, although the 2018 student survey also attempted to
quantify students’ library visits and their use of library resources. While
the surveys were not identical, the four questions that appeared in both
surveys (i.e., library visits, resource use, library space satisfaction, and
library website use) were recoded, rescaled, and analyzed to measure the
differences in both surveys.
Results – The
survey results reveal that students’ library visits and use of library
resources in 2018 were higher than in 2016. In particular, undergraduate students’ use of library
resources in 2016 were lower than those in 2018, whereas graduate students’ use
of library resources remained similar in both years. Another key finding
indicates that the mean score of students’ library quiet study space
satisfaction in 2018 was higher than in 2016. However, when compared to
the 2016 survey, there was a decrease in students’ ease of library
website use in the 2018 survey.
Conclusion
– Assessing students’ behavior and satisfaction
associated with their use of library physical spaces, resources, and services
should be conducted on an ongoing basis. Over time, the survey findings can be
used as evidence based data to communicate patterns of users’ behavior and
satisfaction with various stakeholders, identify areas for improvement or
engagement, and demonstrate the library’s impact. Survey results can also
inform further strategic and assessment planning.
Introduction
Academic libraries have utilized various assessment measures to
understand users’ needs, improve their services, and further demonstrate the
value of the library. Surveys are a popular assessment tool widely used for
exploring users’ needs in academic libraries (Liebst
& Feinmark, 2016; Matthews, 2007). While various
user surveys are conducted by academic libraries, two major types of user
surveys are standardized surveys (e.g., LibQUAL+, Measuring Information Service Outcomes) and local surveys developed by
individual academic libraries (e.g., Montgomery, 2014; Scoulas & De Groote,
2019). Regardless of the type of user surveys, many academic libraries attempt
to use an evidence based approach by reviewing the survey findings, using those
findings for making decisions, and monitoring changes over time (Dennis,
Greenwood & Watson, 2013; Greenwood, Watson & Dennis, 2011; McCaffrey
& Breen, 2016; McCaffrey, 2019; Montgomery, 2014; Norton, Tennant, Edwards
& Pomputius, 2018; Taylor & Heath, 2012).
The University of Illinois at Chicago (UIC) Library began using surveys
as a way to understand users’ perceptions and needs related to the university
library’s spaces, services and resources. The findings have allowed for an
evidence based approach to identify areas for change or improvement. The
principle involved in this effort is to establish the culture of assessment
within the library, “an organizational
environment in which decisions are based on facts, research, and analysis, and
where services are planned and delivered in ways that maximize positive
outcomes and impacts for customers and stakeholders” (Lakos
& Phipps, 2004, p. 352). This has been done using a standardized survey
like LibQUAL+ (2002, 2006, and 2012), as well as
local surveys focused on specific aspects (e.g., library website, space,
services) as needed. The university library decided to discontinue use of LibQUAL+ because it was not always possible to apply the
findings to decision making and because of complaints that the survey was too
complicated to take. Locally focused surveys had been conducted at various
times at the UIC Library to help guide changes related to space (e.g., adding
furniture, remodeling spaces, installing a coffee shop). However, a major
challenge was a lack of an instrument to benchmark and monitor users’
perceptions of library resources, services, and space over time and to measure
the impact of students’ library use on their academic success. Beginning in
2015, the Assessment Coordinator Advisory Committee (AC2) at the UIC Library
developed user experience surveys for students (2016 and 2018) and faculty
(2017 and 2019).
The purpose of this study is to examine any reported measurable
differences in university students’ experiences using the library between 2016
and 2018. The study also explores which survey findings provide actionable data
for the library to use, and it also describes the actions the university
library took as a result of the survey data. This paper will be a useful guide
for librarians who:
- are considering developing their own instrument
to capture users’ needs and to track those changes over time;
- already have a locally developed instrument but
are considering revising it to collect more meaningful data;
- are not sure how to take action based on their
own findings from previous user surveys;
- want to strengthen the culture of assessment
within their library.
Literature Review
Academic libraries have exerted great effort to establish a culture of
assessment using evidence based approaches to explore what library users want
and how to provide easy access to library services and resources. A survey of academic
libraries in the United States (U.S.) showed that more than 70% of academic
libraries used “assessment data to improve practice” (Farkas, Hinchliffe & Houk, 2015, p. 157). Most important, the goal is to improve
the quality of the library’s resources and services for users based on the
results of the assessment efforts. Improving user services and demonstrating
the value of the library to its stakeholders are among the primary missions of
academic libraries. In a fast-paced academic environment, academic libraries
cannot play a large role in students’ efforts to accomplish their academic
goals without understanding students’ needs and preferences.
User Surveys at Academic Libraries and Use of Findings
Many academic libraries have implemented user surveys
to understand users’ behaviors, attitudes toward and satisfaction with library
services and resources so as to improve current practices based on the results.
One of the popular and widely used standardized user surveys used by academic
libraries is LibQUAL+. LibQUAL+
is a web-based survey tool administered by the Association of Research
Libraries (ARL). Since 2000, more than 1,300 academic and public libraries have
used this survey tool (ARL, n.d.). LibQUAL+ is
regarded as a useful tool for librarians and administrators to effectively
gather users’ feedback, a stable instrument to continuously track users’
behavior over time, and a benchmark to help libraries gauge their success
against other institutions (ARL, n.d., Hinchliffe, 2015; McCaffrey, 2019;
Taylor & Heath, 2012). Several academic libraries using LibQUAL+
explored how users’ perceptions of library services and resources changed over
time and how the academic libraries implemented changes in response to the
survey results (Dennis et al., 2013; Greenwood et al., 2011; McCaffrey, 2019;
McCaffrey & Breen, 2016; Taylor & Heath, 2012). In spite of the
popularity of the LibQUAL+ survey, there are reports
of limitations with the tool. Challenges of using LibQUAL+
include participants having difficulty in completing the survey due to too many
questions and similarity among questions (Voorbij,
2012); difficulty in understanding the fixed survey questions, such as minimum,
perceived, and desired levels of service quality (Thompson, Cook, & Health,
2000); difficulties in connecting the LibQUAL+ data
with locally collected statistics (e.g., gate counts); a lack of flexibility to
customize questions; and difficulty reading
results (Dennis et al., 2013). Dennis and colleagues (2013) suggested
that alternative survey methods besides LibQUAL+ are
needed to measure changes within the library.
Several academic libraries have developed their own local user surveys
to gauge users’ behaviors and needs and used the findings for improvement
(e.g., Montgomery, 2014; Ojennus & Watts, 2017).
Benefits of using a local survey are that academic libraries can customize
their questions and response options and focus on a specific area that they
intend to investigate (e.g., space). For example, Ojennus
and Watts (2017) conducted an online survey in 2015 of all students at
Whitworth University in order to examine how they used the library (e.g., space
and technology) and identify possible areas for improvement. After comparing
their findings with trends identified in the literature, the authors concluded
that their findings revealed local needs and interests. As a result, the
library director at Whitworth University made several changes to library space
and amenities (e.g., offering free coffee and making more private rooms
available during finals week) and addressing problems with wireless access in
collaboration with the IT department (Ojennus &
Watts, 2017). Ojennus and Watts (2017) further stated
that they plan to continue surveying users to collect longitudinal data to
monitor the trends and evaluate “the efficacy of our responses to them” (p.
333).
While many surveys may be one-time investigations into users’ needs,
other researchers have studied user needs over extended periods of time using
local surveys. For instance, Montgomery (2014) at the Olin Library at Rollins
College conducted surveys two years in a row using the same survey
questionnaire to determine how users’ perceptions of their learning behavior
changed before and after library space renovations. The author commented that
they were satisfied with users’ feedback and were able to better understand
users’ learning behaviors at the library. The University of Florida Health
Science Center Library used a survey developed by the University of Southern California Health Sciences Libraries staff and
examined how health science users’ awareness of technology (e.g., mobile apps)
and their interest in using technology to access library resources and services
(e.g., citation tools and library
electronic resources) from their mobile devices changed from 2012 to 2016
(Norton et al., 2018). The authors stated that “the annual review of survey results has allowed librarians to identify
the local users’ needs and interests as they changed over time and has led to
incremental changes in services offered” (p. 329).
In spite of the advantages of conducting local surveys, some drawbacks
were raised in the literature: a lack of national benchmarking data and
challenges related to reliable and valid survey questions (Hinchliffe, 2015).
In addition, few studies addressed repeating user surveys over time to
monitoring users’ needs in various areas, such as space, usage of resources, or
technology.
Patterns of Students’ Library Experience
With the Internet and advanced technology, college students can easily
access books and journals remotely using their own computer or mobile device
without entering the library. The ability to remotely access e-books, journals,
databases, and services has shaped users’ library use patterns over 15 years.
Previous studies showed that easy access to online resources and students’
expectations of the library influenced students’ library use pattern (De
Groote, Hitchcock, & McGowan, 2007; Lee, Ritterbush,
& Sivigny, 2010). In two separate studies
conducted during periods of 14 years and 15 years, students’ in-person library
visits declined, whereas their reference questions via email and phone
increased (De Groote et al., 2007; Lee et al., 2010). According to statistics
from ARL, the patterns of students’ library visits also confirm that among 123
member libraries the number of users accessing the library (gate counts)
declined at 42% of academic institutions in the U.S. from 2015 to 2018. In
addition, in a recent article, Cohen (2019) stated that the trend in students
checking out print books decreased over the past decade, whereas the
availability of online articles and e-journal downloads increased.
Academic libraries efforts to meet users’ needs related to library space
(e.g., floor renovation, extending hours, reorganizing spaces) have shifted
from being collection oriented to user focused by incorporating users’
feedback. As a result, students’ perceptions of library space have evolved over
time; library space is becoming less traditional and more conducive to social
learning. Data from 2007 to 2014 from the University of Limerick in Ireland and
an international consortium of ARL and the Society of College, National and
University Libraries indicated that quiet space is increasingly considered
important for library users (McCaffrey & Breen, 2016). This pattern is also
confirmed by a recent study done by McCaffrey (2019) showing that users’
perceptions of quiet space have improved from 2007 to 2016. Other academic
libraries have also observed trends related to students using library space,
indicating that students used library space not only for working alone but,
depending on their learning needs, also for working with their peers
(Montgomery, 2014; Scoulas & De Groote, 2019). In one library, after
rearranging furniture in the library spaces, the overall library space usage
from 2015 to 2018 increased 15% and use of group study tables and a new group
study area increased about 270% (Oberlander, Miller, Mott & Anderson, 2019).
Assessing students’ needs on the library website is critical for
academic libraries: “Library websites are a gateway to library resources,
services, contact information, and events” (Anderson, 2016, p. 19). While
previous studies show that usage of library websites has declined over time
(Allen, Baker, Wilson, Creamer & Consiglio, 2013;
Anderson, 2016), libraries continue to improve their websites for students’
use. Mierzecka and Suminas
(2017) examined which features of the library website are most important for
students at the University of Warsaw in Poland and the Vilnius University in
Lithuania via open-ended responses. They found that the top five important
features of the library website were (ranked in order): the online library
catalogue, information about the location and opening hours, login account
access, the online collection, and a floor map showing reading rooms. Students’
library website experiences were also examined after changes were made to the
libraries’ websites.
Aims
The aim of this study is to examine the patterns of students’ library
use and satisfaction (in-person library visits, resource use, space
satisfaction, and library website use) based on responses to surveys
distributed to students in 2016 and 2018. This study also describes how these
results were used at evidenced based data to provide guidance for a plan of
action.
Methods
Institutional
Setting
UIC is a large public research university classified by the Carnegie
classification as having highest research activity. More than 30,000 students
are enrolled in all of its 15 colleges, and students have access to two large
libraries in Chicago (an arts, humanities, sciences, social sciences, and
engineering library and a health sciences library) and three smaller health
sciences libraries located at UIC’s regional areas (Peoria, Rockford, and
Urbana).
Survey
Development
The AC2, which consisted of library faculty representing various units
(research and instruction, collections, website, administration, assessment and
scholarly communications) in the university library, developed the surveys for
undergraduate and graduate students. The first locally developed survey,
consisting of 19 questions, was distributed to the institution’s students in
2016 (see Appendix A). Prior to distribution, the surveys were piloted with 6
to 8 students who read the questions and shared their thoughts aloud to allow
the research team to observe if there were any issues with interpreting the
questions. At the time of the data analysis, it was determined that effectively
analyzing all of the data was not possible and that changes to the survey would
be needed. For the 2018 student survey, the AC2 reviewed the 2016 student
survey questions and findings and revised some scales (e.g., converting
dichotomous to interval scales for frequency of in-person or online library
visits and library resource use), wording, and format of the survey (see
Appendix B). For further details of how the 2018 student experience survey was
revised, refer to Aksu Dunya and De Groote’s article
(2019). As a result of these changes, the surveys were not identical and
comparisons with all data points were not possible. However, several questions
did remain in both surveys and comparisons of the results to these questions
were conducted and reported in this paper.
Measures
Student Library Visits in Person and Use of
Library Resources
The response scales in the 2016 survey regarding
students’ in-person library visits and use of library resources were different
from those used in the 2018 survey. For example, in the 2016 survey In the
past year, have you visited the library at your campus site for study or
research? and In the past year, have you used [library resources]?
had a nominal scale of yes (1) and no (0), whereas in the 2018
survey Last semester, how often did you visit the university library?
and Last semester, how often did you use [library resources]? had an
ordinal scale of Never (0) to Daily (4). These items were
recorded, as follows: any responses from (1) to (4) in the 2018 survey data
were coded as yes (1) and the rest as no (0) to match those used
in the 2016 data.
Student Library Space
Satisfaction
The scales for the questions related to student
library space satisfaction (i.e., quiet study space and collaborative/group
space) in the 2016 survey were coded Very satisfied (1), Satisfied
(2), Neutral (3), Dissatisfied (4), Very dissatisfied (5),
and I do not use [this space] (6). On the other hand, the same questions
in the 2018 survey were coded from I don’t use this space in the library
(0), Very dissatisfied (1), Dissatisfied (2), Satisfied
(3), and Very satisfied (4). Given that the scales in the 2016 survey
were reverse coded in comparison to the 2018 survey scale, the 2016 data was
recoded so that, for example, Very satisfied (1) becomes Very
satisfied (5) and I do not use [this space] (6) to I do not use
[this space] (0) to match with the 2018 data. Prior to rescaling, the
frequency of I do not use this space (0) response in the 2016 and 2018
surveys was analyzed. Afterwards, the I do not use this space (0)
response was dropped from both the 2016 and 2018 survey results because this
response affects the calculation of the mean scores. Because the 2016 survey
used the 6-point Likert scale format including Neutral (3) and the 2018
survey was a 5-point Likert scale format, it was not possible to directly compare
the mean scores. Therefore, the data was rescaled by using the formula
developed by Preston and Colman (2000): (rating – 1) / (number of categories –
1) x 100. This method is used as a way to compare survey results when the
surveys used different scales.
To rescale the results of the survey, the 5-point
Likert scale data (1, 2, 3, 4, 5) in the 2016 survey was converted to a
continuous one (0, 25, 50, 75, 100), and the 4-point Likert scale data (1, 2,
3, 4) in the 2018 survey was converted to a continuous one (0, 33.33, 66.67,
100). Another adjustment was made for the library space satisfaction questions.
The space satisfaction questions in the 2016 survey included quiet study space
and collaborative/group space, but the 2018 survey questions included quiet
study space, collaborative space, and group study room, separately. To compare
the library space satisfaction in both surveys, the responses of collaborative
and group space in the 2018 survey were calculated as a mean score.
Student Use of Library Website
The scales for the question related to how easy it was to use features
of the library website (e.g., finding a book, searching for journal articles)
were originally coded as a 6-point Likert scale, from Very difficult (1)
to I have not used this (6) in the 2016 survey. However, these scales
were coded as a 5-point Likert scale in the 2018 survey from I don’t use
this service (0) to Very easy (4). For the procedure of recoding and
rescaling data for students’ library website usage, the authors followed the
same methods as described for library space satisfaction.
Preferred Location for Studying
Students were also asked why they studied in
places other than the library by selecting all of the responses that apply.
While the options were not the same for both years, several options were
relatively similar: more study space, quieter study space, food/drink
availability, and equipment or software that I need are available.
How to Spend Funding
Students were also asked how they would spend
funding to improve the library. They could select two options in the 2016
survey and three options in the 2018 survey. Not all of the options were the
same in both surveys, but the options from both surveys included more
computers, more quiet study spaces, and more electric outlets. However, more
food and drink options was included only in the 2018 survey.
Participants
The total number of respondents in 2016 was 1,087 (response rate of 4%),
whereas the number of respondents in 2018 was 2,277 (response rate of 8%). This
reflects a 109% increase over the response rate of the 2016 survey. Both
surveys contained key demographics, including gender, age, class level (e.g.,
undergraduate and graduate), first generation status, and commuter status. As
shown in Table 1, it appears that the ratio of respondents from the 2016 and
2018 surveys was similar to the ratio of the 2018 university population (a
difference of less than 5%) in all of the demographic variables, except for two
categories: female respondents and graduate students were overrepresented in
both surveys. As such, on the whole, the survey respondents were representative
of the university’s population.
There are slight differences between the 2016 survey and 2018 survey
respondents’ demographics. The percentage of student respondents in the age
group between 16 and 25 increased almost 10% from 2016 (59.52%) to 2018
(69.43%), whereas the rest of the age groups slightly decreased. The percentage
of undergraduate respondents increased about 9% from 2016 (48.30%) to 2018
(56.96%), and the first generation respondents increased more than 2% from 2016
(10.86%) to 2018 (13.22%). Some of the respondents’ demographics were similar
in both surveys. For example, in both surveys, female students (61.64% in 2016
and 63.68% in 2018) were more likely to participate in the survey than male
students (38.36% in 2016 and 36.14% in 2018). In additional, the majority of
the respondents in both surveys (85.19% in 2016 and 85.68% in 2018) were
commuters, meaning they did not live on campus.
Data Collection
Students’ demographic information was obtained from the Office of
Institutional Research (OIR) with the participating students’ consent for both
the 2016 and 2018 surveys. The demographic information requested for both
surveys included gender, age, class level, first generation status, and
commuter/resident/online status (see Table 1). The OIR uploaded a “panel” in
Qualtrics that contained all students’ email addresses and demographic
information. Students were sent an email from Qualtrics requesting their
participation in the survey. The procedures for collecting survey responses
remained the same for both surveys and are outlined in detail in the study of
Scoulas and De Groote (2019). As an incentive, all survey respondents were able
to enter a drawing for one of three iPads in the 2018 survey. No incentives
were offered with the 2016 survey.
Table 1
Comparison of Students’ Demographic Information: 2016 and 2018
|
|
Sample |
Total 2018 Student
Population (N = 28,725) |
|
|
|
2016 (n = 1,087) |
2018 (n = 2,277) |
|
|
Gender, n (%) |
|
|
|
|
Female |
670 (61.64%) |
1,450 (63.68%) |
15,201 (52.92%) |
|
Male |
417 (38.36%) |
823 (36.14%) |
13,408 (46.68%) |
|
Unknown |
- |
4 (0.18%) |
116 (0.40%) |
|
Age Group, n (%) |
|
|
|
|
16-25 |
647 (59.52%) |
1,581 (69.43%) |
20,598 (71.71%) |
|
26-35 |
297 (27.32%) |
509 (22.35%) |
6,206 (21.60%) |
|
Above 35 |
143 (13.16%) |
187 (8.21%) |
1,921 (6.69%) |
|
Class, n (%) |
|
|
|
|
Undergraduate |
525 (48.30%) |
1,297 (56.96%) |
18,886 (65.75%) |
|
Graduate |
536 (49.31%) |
980 (43.04%) |
9,839 (34.25%) |
|
First Generation, n (%) |
118 (10.86%) |
301 (13.22%) |
4,801 (16.71%) |
|
Transfer, n (%) |
211 (19.41%) |
463 (20.33%) |
6,890 (23.99%) |
|
Residency, n (%) |
|
|
|
|
Commuters |
926 (85.19%) |
1,951 (85.68%) |
24,584 (85.58%) |
|
Resident |
109 (10.03%) |
276 (12.12%) |
3,114 (10.84%) |
|
Online |
52 (4.78%) |
50 (2.20%) |
1,027 (3.58%) |
Data Analysis
All data was analyzed using SPSS 25. Descriptive
statistics were used in response to Q1, student library visits and resource
use. To test whether a statistically significant difference in student library
space satisfaction and use of the library website existed in the 2016 and 2018
survey data, an independent sample t-test was used. Before conducting any
statistical tests, the requirements of the assumptions of each test were
checked. The 2016 response and 2018 response distributions were sufficiently
normal for the purposes of conducting a t-test (e.g., skew < |2.0| and
kurtosis < |9.0|; Schmider, Ziegler, Danay, Beyer & Bühner, 2010).
In addition, the assumption that homogeneity of variances in spread scores is
equal in different groups of cases was tested and was not met via Levene’s F test.
Therefore, adjusted degrees of freedom were used.
Results
Comparison of
Student In-Person Library Visits and Resource Use
Table 2 shows the student library visit and library resource use in the
2016 and 2018 survey data. With respect to their frequency of library visits,
the results indicate that student library visits slightly increased from 2016
to 2018. In additional, the frequency of student library resource use (journal
articles, books, and databases) moderately increased from 2016 to 2018.
Students’ in-person library visits and library
resource use were further organized by class level (undergraduate students and
graduate students) in order to show whether or not there were differences in
their library use between surveys. Figure 1 shows that overall undergraduate
students visited the library more than graduate students in both years.
Undergraduate students’ in-person library visits in 2018 (51.30%) were higher
than in 2016 (46.00%), whereas graduate students’ in-person library visits in
2018 (35.31%) were slightly lower than in 2016 (38.91%).
Table 2
Comparison of Student In-Person Library Visits and Use in Both Surveys
|
|
2016 (n = 1,087) |
2018 (n = 2,277) |
||
|
|
n |
% |
n |
% |
|
In-person visits |
923 |
84.91 |
1,972 |
86.61 |
|
Use of library resources |
850 |
78.20 |
1,946 |
85.46 |
Regarding students’ use of library resources,
as shown in Figure 2, the patterns by class level across the two surveys were
different. For example, undergraduate students’ use of library resources in
2016 (37.63%) was lower than that in 2018 (44.62%), whereas graduate students’
use of library resources remained similar in both years (40.57% in 2016 and
40.84% in 2018). Undergraduate students’ use of library resources (37.63%) was
lower than graduate students’ (40.57%) in 2016, but in 2018 undergraduate students’
use of library resources (44.62%) was higher than graduate students’ use
(40.84%).
Library Space
Usage and Satisfaction
Prior to analyzing the comparison of students’ library space
satisfaction, the percentages of the respondents answering that they did not
use a space were analyzed (see Figure 3). This information allowed us to see
whether or not the patterns of students’ library space usage have changed over
time. As shown in Figure 3, the respondents who indicated not using the space
for both quiet study space and collaborative/group space (11.32% and 19.69%) in
2016 were higher than those in 2018 (9.00% and 17.13%). The findings suggest
that the respondents in 2018 were more likely to use the quiet study space and
collaborative/group space than respondents in 2016.

Figure 1
Students’ in-person library
visits by class level.
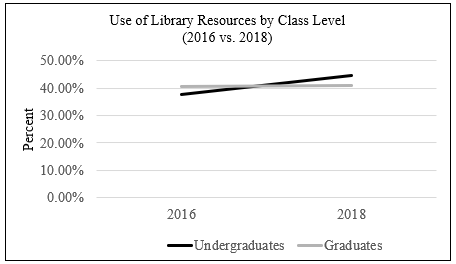
Figure 2
Students’ use of library resources by class
level.
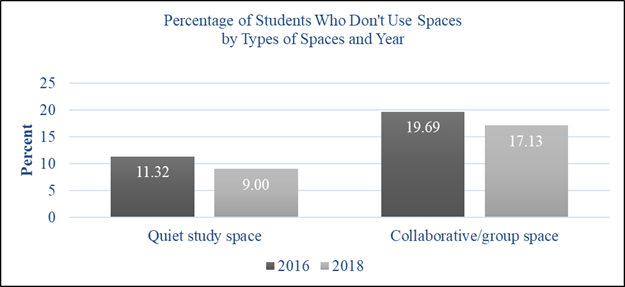
Figure 3
Percentage of
students responding that they do not use quiet study space or
collaborative/group space in 2016 and 2018.
An independent sample t-test was conducted to compare further students’
library space satisfaction in 2016 and in 2018. As shown in Table 3, the
results show that there was a statistically significant difference in the
scores of quiet study space for the 2016 surveys (M = 67.47, SD = 26.65)
and 2018 surveys (M = 73.84, SD = 24.15); t(1356) = -5.72, p <
.001, d = 0.25. This result suggests that the average student
satisfaction in the quiet study space in the 2018 survey was higher than in the
2016 survey. However, there was no significant difference in the mean scores of
collaborative/group study space for 2016 (M
= 65.93, SD = 25.46) and 2018 (M = 68.25, SD = 23.47); t(1322)
= -1.97, p = .05, d = 0.09.
Library Website
Use and Ease of Use
To see the pattern of students’ library website use in 2016 and 2018,
the responses indicating that students did not use a service were compared. The
findings show that the percentages of respondents who did not use services such
as asking a librarian for assistance on IM/Chat; finding films, videos, or
online images; and booking a group study room in 2016 were higher than those in
2018, meaning that students in 2018 tended to use those services more than
students in 2016 (see Figure 4). On the other hand, the percentages of
respondents who did not use services such as finding a print book, requesting a
print book, logging into my account, and subject and course guides in 2016 were
lower than those in 2018, suggesting that students in 2016 were more likely to
use those services than students in 2018.
Next, an independent sample t-test was conducted to investigate whether
there were differences in students’ ease of using the library website between
the 2016 and 2018 surveys. As shown previously in Table 3, the results of the
t-test indicate that there were statistically significant survey differences in
the ease of library website use, except for the finding media and booking a
group study room features, when comparing the 2016 survey with the 2018 survey
at the level of p < .05.
In 2016, the top reasons for studying in
places other than the library included more study space (42.41%), quieter study
space (37.72%), and food/drink availability (32.84%). However, in the 2018
survey, quieter study space was not in the top three responses. Instead, I
can find a seat was the top selection (46.90%), an option that was not
available in the 2016 survey. Studying in other places because of the
availability of food and drink increased (44.80%) and studying in other places
with more study space decreased (33.90%). In 2016, students indicated they
would spend funding on more online resources (24.38%), more computers (21.25%),
and more quiet study spaces (21.16%). In 2018, students indicated they would
spend funding on more food and drink options (32.37%), an option which was not
available in the 2016 survey. They also indicated the desire for more quiet
study space (31.14%) and more electric outlets (30.52%); compared to the
previous survey, both of these preferences increased compared to the previous
survey.
Table 3
Comparison
of Average Student Library Space Satisfaction and Library Website Ease of Use
in Both Surveys
|
|
2016 (2018)a |
||||||||
|
|
n |
M |
SD |
t |
df |
p |
95% Confidence Interval (Lower vs. Higher) |
Cohen’s db |
|
|
Student
Library Space Satisfaction |
|
|
|
|
|
|
|
|
|
|
Quiet study
space |
777 (1,799) |
67.47 (73.84) |
26.65 (24.25) |
-5.72 |
1356 |
*** |
-8.55 |
-4.18 |
0.25 |
|
Collaborative/group
space |
686 (1,231) |
65.93 (68.25) |
25.46
(23.47) |
-1.97 |
1322 |
|
-4.64 |
-.01 |
0.09 |
|
Ease
of Use of Library Website Features |
|
|
|
|
|
|
|
|
|
|
Searching for
journal articles |
748 (1,813) |
79.08 (72.79) |
23.32 (22.53) |
6.27 |
1350 |
*** |
4.32 |
8.26 |
0.27 |
|
Finding a
print book |
601 (1,391) |
74.63 (68.18) |
25.47 (25.42) |
5.19 |
1136 |
*** |
4.01 |
8.89 |
0.13 |
|
Requesting a
print book |
460 (1,114) |
78.37 (66.76) |
26.08 (26.26) |
8.02 |
862 |
*** |
8.77 |
14.46 |
0.44 |
|
Logging into
my library account |
477 (1,027) |
81.13 (70.66) |
24.04 (25.83) |
7.68 |
991 |
*** |
7.80 |
13.15 |
0.18 |
|
Asking a librarian for assistance on IM/Chat |
281 (1,038) |
80.61 (76.56) |
22.99 (23.84) |
2.60 |
456 |
* |
.98 |
7.11 |
0.17 |
|
Using library
subject and course guides |
515 (1,051) |
75.78 (69.84) |
24.94 (23.24) |
4.53 |
960 |
*** |
3.36 |
8.51 |
0.24 |
|
Finding films, videos, or
online images |
202 (845) |
66.46 (67.26) |
28.40 (25.62) |
-.37 |
284 |
|
-5.10 |
3.50 |
0.03 |
|
Booking a
group study room |
282 (950) |
71.37 (69.61) |
26.97 (26.34) |
.96 |
452 |
|
-1.82 |
5.33 |
0.07 |
aResults from the 2018 survey are provided in parentheses.
bCohen’s d: 0.2= small effect, 0.5= moderate effect, 0.8= large effect.
* p < .05.
*** p < .001.
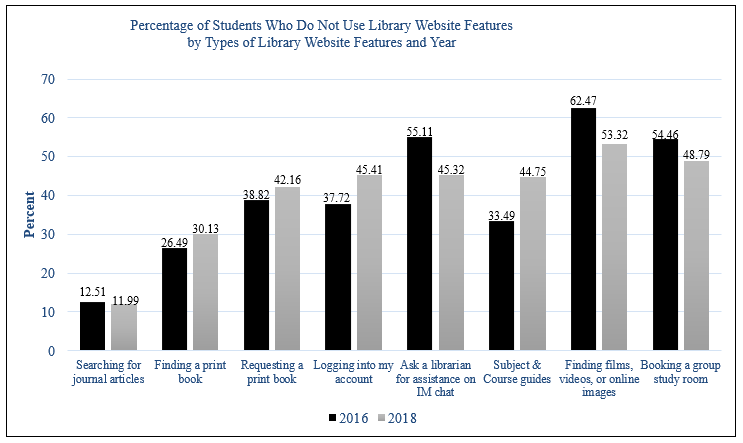
Figure 4
Percentage of students responding that they do
not use a website feature in 2016 and 2018.
Discussion
Patterns of Students’ Library Use
Using the 2016 and 2018 survey results, the current study examined if
there were differences in students’ library use in four areas: library visits,
resources, library space, and the website. The findings of this study
illustrate that, even within a short period of time between surveys (in this
case, 2 years), there were differences in users’ library use. From 2016 to
2018, there was an increase in students’ library visits, resource use, and
satisfaction, and there was a decrease in the ease of library website use.
Finding an increase in library visits is different from the decrease in
students’ library visits indicated in the literature (ARL [statistics from 2016
to 2018]; De Groote et al., 2007; Lee et al., 2010). However, students’
resource use was similar to what has been shown in the literature with an
increase in students’ online resource use such as e-journals (ARL [statistics
from 2016 to 2018]; Cohen, 2019). Continued efforts to provide space for
students may have contributed to the increase in undergraduate use of the
library. The findings about the increased use of library resources may be associated
with libraries providing a higher number of resources. In fact, according to
ARL Statistics, from 2016 to 2018 the volumes and e-books in the university’s
library collection have increased 37.16% and 60.44%, respectively. Use of the
library decreased between the survey period for graduate students. It could be
that the heavy presence of undergraduate students was a deterrent to graduate
student use.
From Analyzing Findings to Taking Action
The second goal of this paper is to discuss how the findings from the
survey were used to take further action. The findings from the surveys and
comparative data were presented to the AC2, to the steering committee, and to
all library staff to share the overall patterns of students’ library
experiences in various areas and demonstrate how the library is doing. The
findings were also shared with external stakeholders like the Faculty Advisory
Committee at the UIC to demonstrate the role and investment of the library in
efforts to support students’ academic success and to seek further insight and
feedback into the findings. The results of both surveys and their comparisons
were also used as evidence based data to further shape the strategic plan and
the university library’s assessment plan.
The quantitative results regarding increases in certain areas (library
visits, resource use, and space satisfaction) did not lead to new decisions or
actions but rather acknowledgement that there were areas where the library was
doing well. On the other hand, declining satisfaction results related to
services were indicators that further information should be sought and
potential action taken. Discussion of some of these findings and the actions
taken by the library follow.
Independent of findings from the 2016 survey, the library’s website had
undergone a redesign. Unfortunately, the respondents to the 2016 student survey
found using the library website to be easier than the respondents to the 2018
student survey. This pattern of library website user satisfaction was very important.
Anecdotal evidence from librarians suggested that users were encountering some
difficulties when navigating the library website. The responses to the 2018
survey provided clearer evidence that additional changes are needed. It is
possible that students who participated in the 2016 survey used the library
website before the re-design, so they found the old library website easier to
use. However, even newer students reported challenges with the website. No
immediate actions were taken to revise the webpage, but longer-term planning
includes further redesign of the webpage.
According to Lakos and Phipps (2004), one
example of whether a culture of assessment exists in a library is that the
organization has “relevant data and [that]
user feedback are routinely collected, analyzed, and used to set priorities,
allocate resources, and make decisions” (p. 353). Incorporating users’ feedback
into the decision-making process and making improvements based on the evidence
are part of the effort to strengthen a culture of assessment within the
library. Some of the key findings from the 2016 survey suggested that students
were not satisfied with quiet study space, access to computers, and electrical
outlets. To address these concerns, additional outlets were installed in
several areas in the library. To increase students’ quiet study space, in
Spring 2017 the main library of UIC increased the availability of designated
quiet study space from one floor to two floors in addition to providing more
single study furniture. Further, and again independent of 2016 survey results,
a complete renovation was done at the Library of the Health Sciences between
2017 and 2018, which provided additional study space, more electrical outlets,
a coffee shop, additional computers, additional seating, extended hours,
and—for a short period of time—microwaves.
It would appear that as a result of the space renovations, overall
satisfaction with the library spaces increased. However, access to space
remained a challenge. This is likely due in part to a 5% increase in
undergraduate enrollment and because space issues were already a problem in
2016. Without increasing the actual square footage of the library, the
overcrowding issue remains a challenge to solve. There are also not many more places
to add additional outlets. Findings related to the increase in students’ quiet
space satisfaction are similar to the patterns observed in other studies. For
example, in spite of the issue of insufficient space, other academic libraries
that continued to exert efforts to improve their space by reorganizing study
areas and dealing with noise problems based on users’ feedback did find that
students’ perceptions of quiet space improved over time (McCaffrey, 2019;
McCaffrey & Breen, 2016).
Comparing two surveys to understand the patterns of users’ library
experiences was useful; however, it is not always possible to understand why an
increased or decreased result occurred. McCaffrey (2019) argues that “detailed comparisons between two surveys can be problematic,
particularly when analyzed at a question, user group or dimension level, as
scores can increase or decrease for reasons that may be unknown or difficult to
explain” (p. 72). However, comparisons between two surveys provide a valuable
lesson. Libraries must keep asking core questions and monitoring users’
responses regularly to monitor their experiences and satisfaction with
resources and measure the impact of the library on students’ academic success
over time. In order to capture students’ responses and more accurately measure
the library’s impact on students’ success, the AC2 decided to revise the
response scales, wording, and content (Aksu Dunya
& De Groote, 2019). However, this revision was a very important step in
repeating user surveys over time that provide more meaningful evidence to the
university library staff. In addition, “the effectiveness of the revision” was
supported by the significant increase in the response rate (Aksu Dunya & De Groote, 2019, p. 54). Although the revisions
of both surveys resulted in adjustments to the scales within those surveys to
accurately compare them, the results provide reliable, informative, and
meaningful evidence. This is important because libraries are expected to follow
the steps of the methods rigorously tested and used by researchers (e.g.,
Holmes, & Mergen, 2013; Preston & Colman,
2000).
While the adjustments to the coding and scaling that were made to
compare both surveys were not the primary focus of this paper, it is important
to mention that adjustments to surveys may be needed in subsequent years to
collect the most useful data. This paper demonstrates that institutions should
be prepared from the beginning and be open to adjusting their tools as needed
in order to develop the ideal benchmarking tools that can be used consistently
over time. If a library has data from slightly different surveys (e.g.,
different scales and wording) that requires minor adjustments such as
rescaling, this process should be done carefully by following the methods used by
researchers (e.g., Holmes, & Mergen, 2013;
Preston & Colman, 2000) to make the findings reliable and accurate. The
authors also want to highlight that developing a tool for benchmarking does not
mean that questions need to be identical in each survey. A certain number of
questions can be used for assessing users’ needs related to new services or how
to address different needs based on changes in technology, student enrollment,
or other influences.
This study is unique compared to other studies
reported in the literature because few of those studies have examined how
libraries track and report their impact over time by using local user
experience surveys. By monitoring user trends over time, this study expands
current research on academic libraries’ efforts to use evidence based data for
improvements, decision-making, and future library assessments. Those practices
include reviewing the assessment tool, revising it as needed, and taking action
based on the findings; these are integral to reinforcing a culture of
assessment. These practices provide valuable and meaningful information that
guide librarians who plan to use local surveys to monitor users’ experiences
over time and
determine what to address in their next assessment plan.
Conclusion
Assessing users’ behaviors and satisfaction associated with their use of
library physical spaces, resources, and services should be conducted on an
ongoing basis in order to observe and respond to evolving trends. Determining
how often this type of survey will be conducted and monitored to explore these
trends over time will vary based on the availability of data at libraries and
how the libraries will use the data. The UIC Library plans to conduct student
surveys every other year. A specific set of questions that be asked each time
so that the library can better understand and react to changes in user needs
and interests.
Equally important to conducting assessment is what
academic libraries do in response to the assessment findings. Over time the
findings from surveys can be used as evidence based data to communicate with
various stakeholders for indicating the patterns of users’ behavior, identify
areas for improvement, demonstrate the library’s impact, and develop a deeper
understanding of users. Findings can also be used when developing strategic
plans and a library assessment plan. To accomplish this, the findings from the
surveys need to be carefully reviewed and, when feasible, used as the basis of
responding to users’ needs in order to improve the library spaces, resources,
and services. Not only that, it is critical to re-assess users’ experiences by
comparing present and future survey results with the findings of previous
assessments. This cycle of assessment will be critical for customizing and targeting
services that are useful for the diverse student body served by an academic
library. Establishing a culture of assessment in academic libraries begins with
assessing how users perceive the services and resources provided by the library
and improving users’ experiences based on these findings.
Acknowledgements
We greatly appreciate the support of our colleagues of the University of
Illinois at Chicago’s AC2, who contributed their expertise to the assessment.
We also thank Carl Lehnen and Mary Shultz for
reviewing the manuscript.
References
Aksu Dunya, B.,
& De Groote, S. (2019). Revision of an academic
library user experience survey. Performance Measurement and Metrics, 20(1),
48–59. https://doi.org/10.1108/PMM-10-2018-0026
Allen, L., Baker, N., Wilson, J., Creamer, K., & Consiglio, D. (2013). Analyzing the MISO data: Broader
perspectives on library and computing trends. Evidence Based Library and
Information Practice, 8(2), 129–138. https://doi.org/10.18438/B82G7V
Anderson, L. (2016). Library website visits and
enrollment trends. Evidence Based Library and Information Practice, 11(1),
4–22. https://doi.org/10.18438/B8F918
Association of Research Libraries. (n.d.). ARL
Statistics. Retrieved from https://www.arlstatistics.org/repository
Association of Research Libraries (n.d.). LibQUAL+ 2018 survey. Retrieved from http://www.libqual.org/publications
Cohen, D. (2019, May 26). The books of college
libraries are turning into wallpaper. The Atlantic. Retrieved July 25,
2019, from https://www.theatlantic.com/ideas/archive/2019/05/college-students-arent-checking-out-books/590305/
De Groote, S. L., Hitchcock,
K., & McGowan, R. (2007). Trends in reference usage
statistics in an academic health sciences library. Journal of the Medical
Library Association: JMLA, 95(1), 23–30. https://www.ncbi.nlm.nih.gov/pmc/articles/PMC1773032/
Dennis, M., Greenwood, J., & Watson, A. (2013). LibQUAL revisited: Further analysis of qualitative and
quantitative survey results at the University of Mississippi. Journal of
Academic Librarianship, 39(6), 512–516. https://doi.org/10.1016/j.acalib.2013.08.009
Farkas, M., Hinchliffe, L., & Houk,
A. (2015). Bridges and barriers: Factors influencing a culture of assessment in
academic libraries. College & Research Libraries, 76(2),
150–169. https://doi.org/10.5860/crl.76.2.150
Greenwood, J. T., Watson, A. P., & Dennis, M.
(2011). Ten years of LibQual: A study of qualitative
and quantitative survey results at the University of Mississippi 2001-2010. Journal
of Academic Librarianship, 37(4), 312–318. https://doi.org/10.1016/j.acalib.2011.04.005
Hinchliffe, L. J. (2015). Osservatorio:
Library assessment and user surveys in academic librarianship in the United
States. AIB Studi, 55(2), 247–257. https://doi.org/10.2426/aibstudi-11198
Holmes, D. S.,
& Mergen, A. E. (2013). Converting survey results
from four-point to five-point scale: A case study. Total Quality Management
and Business Excellence, 25(1–2), 175–182. https://doi.org/10.1080/14783363.2013.799330
Lakos, A., & Phipps, S. (2004). Creating a culture of assessment: A
catalyst for organizational change. portal: Libraries and the Academy, 4(3),
345–361. https://doi.org/10.1353/pla.2004.0052
Lee, M., Ritterbush, J.,
& Sivigny, R. (2010). Reference at the commons: A
case study. Reference Services Review, 38(1), 81–89. https://doi.org/10.1108/00907321011020743
Liebst, A., & Feinmark, D. (2016). Tools of
academic library assessment: The user survey. Journal of Library
Administration, 56(6), 748–755. https://doi.org/10.1080/01930826.2016.1199144
Matthews, J. R. (2007). Library assessment in
higher education. Westport, Conn.: Libraries Unlimited.
McCaffrey, C. (2019). Transforming the university
library one step at a time: A ten year LibQUAL +
review. New Review of Academic Librarianship, 25(1), 59–75. https://doi.org/10.1080/13614533.2018.1511438
McCaffrey, C., & Breen, M. (2016). Quiet in the
library: An evidence-based approach to improving the student experience. portal,
16(4), 775–791. https://doi.org/10.1353/pla.2016.0052
Mierzecka, A., & Suminas, A. (2018). Academic
library website functions in the context of users’ information needs. Journal
of Librarianship and Information Science, 50(2), 157–167. https://doi.org/10.1177/0961000616664401
Montgomery, S. E. (2014). Library space assessment: User learning
behaviors in the library. Journal of Academic Librarianship, 40(1),
70–75. https://doi.org/10.1016/j.acalib.2013.11.003
Norton, H. F., Tennant, M. R., Edwards, M. E., & Pomputius,
A. (2018). Use of annual surveying to identify technology trends and improve
service provision. Journal of the Medical Library Association, 106(3),
320–329. https://doi.org/10.5195/jmla.2018.324
Oberlander, C., Miller, B., Mott, E., & Anderson,
K. (2019, May 3). How data improved our library space. The Chronicle of
Higher Education. Retrieved from https://www.chronicle.com/interactives/20190505-Oberlander
Ojennus, P., & Watts, K. A.
(2017). User preferences and library space at Whitworth
University Library. Journal of Librarianship and Information Science, 49(3),
320–334. https://doi.org/10.1177/0961000615592947
Preston, C. C., & Colman, A. M. (2000). Optimal
number of response categories in rating scales: Reliability, validity,
discriminating power, and respondent preferences. Acta Psychologica,
104(1), 1–15.
https://doi.org/10.1016/S0001-6918(99)00050-5
Schmider, E., Ziegler, M., Danay, E., Beyer, L., &
Bühner, M. (2010). Is it really robust?
Reinvestigating the robustness of ANOVA against violations of the normal
distribution assumption. Methodology, 6(4), 147–151. https://doi.org/10.1027/1614-2241/a000016
Scoulas, J. M., & De Groote, S. L. (2019). The library’s impact on university students’ academic success and
learning. Evidence Based Library and Information Practice, 14(3),
2–27. https://doi.org/10.18438/eblip29547
Taylor, M., & Heath, F. (2012). Assessment and
continuous planning: The key to transformation at the University of Texas
Libraries. Journal of Library Administration, 52(5), 424–435. https://doi.org/10.1080/01930826.2012.700798
Thompson, B., Cook, C., & Health, F., (2000) The LibQual+ gap measurement model: the bad, the ugly, and the
good of gap measurement. Performance Measurement and Metrics, 1(3),
165–178.
https://doi.org/10.1108/EUM0000000007216
Voorbij, H. (2012). The use of LibQUAL+ by European
research libraries. Performance Measurement and Metrics, 13(3),
154–168. https://doi.org/10.1108/14678041211284704
Appendix A
2016 Student Survey
I have read the “Agreement to Participate” document and agree to
participate in this research.
o Yes
o No
In the past year, have you visited the library at your campus site for
study or research?
o Yes
o No
o I am an online student only
How satisfied are you with the quiet study space at your library?
o Very satisfied
o Satisfied
o Neutral
o Dissatisfied
o Very dissatisfied
o I do not use quiet space in the library
How satisfied are you with the collaborative/group space at your
library?
o Very satisfied
o Satisfied
o Neutral
o Dissatisfied
o Very dissatisfied
o I do not use group space in the library
How satisfied are you with the computers available at your library?
o Very satisfied
o Satisfied
o Neutral
o Dissatisfied
o Very dissatisfied
o I do not use the computers in the library
If you study in places other than your library, what do you like about
those spaces? [Check all that apply.]
o More study space
o Quieter
o Food/drinks are sold here
o Equipment or software that I need are available
o Other (please specify):___________________
o I do not study in spaces other than my library
In the past year, have you used the library books, e-books, databases,
journal articles, or other library resources?
o Yes
o No
How satisfied are you with the library resources you have used in the
past year?
|
|
Have not used this |
Very satisfied |
Satisfied |
Neutral |
Dissatisfied |
Very dissatisfied |
|
Textbooks on reserve
in the Library |
o |
o |
o |
o |
o |
o |
|
Books (other than
required textbooks) |
o |
o |
o |
o |
o |
o |
|
E-books (other than
required textbooks) |
o |
o |
o |
o |
o |
o |
|
E-journals |
o |
o |
o |
o |
o |
o |
|
Databases |
o |
o |
o |
o |
o |
o |
|
Streaming videos |
o |
o |
o |
o |
o |
o |
|
Online patient care
tools |
o |
o |
o |
o |
o |
o |
|
DVDs on reserve |
o |
o |
o |
o |
o |
o |
|
Other, please specify |
o |
o |
o |
o |
o |
o |
What two specific library resources have you used the most in the past
year?

Please rank up to 3 resources you use most often for research projects,
1 being the most important (where you go first)
o Search box on the library website
o Library subject/research guides
o Library of the Health Sciences website (Chicago, Peoria, Rockford, or
Urbana)
o The Health Sciences Gateway
o Database A-Z list
o Google or some other search engine (Bing, Yahoo, etc.)
o Wikipedia
o Academic search engine such as Google Scholar
o Blackboard
o Other (Please specify):_____________________
Think about your satisfaction with the library services you have used in
the past year. How satisfied were you with each service?
|
|
Have not used this |
Very satisfied |
Satisfied |
Neutral |
Dissatisfied |
Very dissatisfied |
|
A class session where
a librarian taught research skills for a specific assignment |
o |
o |
o |
o |
o |
o |
|
A library workshop
that teaches how to use online resources |
o |
o |
o |
o |
o |
o |
|
Assistance from staff
in the library |
o |
o |
o |
o |
o |
o |
|
Ask a librarian by
IM/chat, phone, or email |
o |
o |
o |
o |
o |
o |
|
A research consultation
with a librarian (scheduled appointment) |
o |
o |
o |
o |
o |
o |
|
Request a book or
article from another library |
o |
o |
o |
o |
o |
o |
|
Specialized research
assistance from the subject librarian for my department/college |
o |
o |
o |
o |
o |
o |
|
Group study rooms in
the library |
o |
o |
o |
o |
o |
o |
Think about how you used the library website in the past year. How easy
was it to use each feature below?
|
|
Have not used this |
Very easy |
Easy |
Neutral |
Difficult |
Very difficult |
|
Find a book at the
University |
o |
o |
o |
o |
o |
o |
|
Login to my account to
renew a library book or check the status of a request |
o |
o |
o |
o |
o |
o |
|
Search for journal
articles on my topic |
o |
o |
o |
o |
o |
o |
|
User a library
subject/research guide to find material by subject |
o |
o |
o |
o |
o |
o |
|
Find films, videos, or
online images at the university |
o |
o |
o |
o |
o |
o |
|
Request a book or
article from another library |
o |
o |
o |
o |
o |
o |
|
Ask a librarian for
assistance by email or IM chat |
o |
o |
o |
o |
o |
o |
|
Make an appointment
for research help |
o |
o |
o |
o |
o |
o |
|
Book a group study
room online |
o |
o |
o |
o |
o |
o |
|
Some other activity
(please specify): [ ] |
o |
o |
o |
o |
o |
o |
As part of your online course(s), have you used the university library
e-books, databases, journal articles or other library resources or services for
assignments or other course-related activities?
o Yes
o No
In the past year, have you used the library website to find e-books,
databases, e-journals, or other library resources?
o Yes
o No
Think about the library services you used in the past year in your
online program. How satisfied are you with each service?
|
|
Have not used this |
Very satisfied |
Satisfied |
Neutral |
Dissatisfied |
Very dissatisfied |
|
Requesting an article
from the university library or another library |
o |
o |
o |
o |
o |
o |
|
Online access to
full-test articles and e-books |
o |
o |
o |
o |
o |
o |
|
Online IM/chat
research help |
o |
o |
o |
o |
o |
o |
|
Telephone research
help |
o |
o |
o |
o |
o |
o |
|
Virtual consultation
with a librarian |
o |
o |
o |
o |
o |
o |
|
Online workshops about
library research (e.g., finding books, journals, requesting electronic
materials, finding literature and journal articles) |
o |
o |
o |
o |
o |
o |
|
Self-paced tutorials
about library research |
o |
o |
o |
o |
o |
o |
When should the library offer virtual consultations or online workshops
with a librarian to provide assistance with library research? Select you most
preferred time.
o 8am to 12 pm CST (Monday-Friday)
o 12-4 pm CST (Monday-Friday)
o 4-8 pm CST (Monday-Friday)
o 8 pm to 12 am CST (Monday-Friday)
o Weekends during the day
o Live virtual services not needed
How would you spend money to improve the library? Please select the two most important items.
o Longer hours
o More comfortable furniture
o More computers
o More online resources (ebooks, ejournals, databases, etc)
o More electrical outlets
o More individual desks
o More print books
o More quiet/silent study spaces
o More whiteboards
o Other (Please specify):_______________
Thinking about your overall experience with the library, what is one
thing that you would like us to know to improve your experience?

Appendix B
2018 Student Experience Survey
I have read the “Agreement to Participate”
document and agree to participate in this research.
o Yes
o No
Last semester, how often did you visit the
university library?
|
|
Daily |
Multiple days in a
week |
Once a week |
Once a month |
Never |
|
In person |
o |
o |
o |
o |
o |
|
Online |
o |
o |
o |
o |
o |
How satisfied are you with the library spaces
below at your library?
|
|
Very satisfied |
Satisfied |
Dissatisfied |
Very dissatisfied |
I don’t use this space
in the library |
|
Quiet study spaces |
o |
o |
o |
o |
o |
|
Collaborative study
spaces |
o |
o |
o |
o |
o |
|
Group study rooms |
o |
o |
o |
o |
o |
|
Computer areas |
o |
o |
o |
o |
o |
If you study in places other than the university library, what do you
like about those spaces?
[Check all that apply]
o More study space
o Quieter study space
o Food/drink availability
o Software availability
o Equipment (e.g., computer, printer, scanner, etc.) availability
o Longer hours
o More comfortable furniture
o I can find a seat
o I prefer to study at home
o Other (Please specify) [ ]
Last semester, how often did
you use each of the library resources below?
|
|
Daily |
Multiple days in a
week |
Once a week |
Once a month |
Never |
|
Journal articles |
o |
o |
o |
o |
o |
|
Subject specific
databases |
o |
o |
o |
o |
o |
|
Print books from the
stacks |
o |
o |
o |
o |
o |
|
Textbooks on reserve |
o |
o |
o |
o |
o |
|
Electronic books |
o |
o |
o |
o |
o |
|
Library Subject &
Course Guides |
o |
o |
o |
o |
o |
|
Special Collections
& University Archives |
o |
o |
o |
o |
o |
|
Digital images |
o |
o |
o |
o |
o |
|
Streaming media |
o |
o |
o |
o |
o |
|
DVDs on reserve |
o |
o |
o |
o |
o |
|
Patient care tools |
o |
o |
o |
o |
o |
Please indicate the relative importance
of each of the library resources/services for your research or coursework.
|
|
Very important |
Important |
Somewhat important |
Not at all important |
I don’t use this
tool/service |
|
Journal articles |
o |
o |
o |
o |
o |
|
Subject specific
databases |
o |
o |
o |
o |
o |
|
Print books from the
stacks |
o |
o |
o |
o |
o |
|
Textbooks on reserve |
o |
o |
o |
o |
o |
|
Electronic books |
o |
o |
o |
o |
o |
|
Library Subject &
Course Guides |
o |
o |
o |
o |
o |
|
Special Collections
& University Archives |
o |
o |
o |
o |
o |
|
Digital images |
o |
o |
o |
o |
o |
|
Streaming media |
o |
o |
o |
o |
o |
|
DVDs on reserve |
o |
o |
o |
o |
o |
|
Patient care tools |
o |
o |
o |
o |
o |
|
Library instruction
arranged by your professor |
o |
o |
o |
o |
o |
|
Library workshops that
you self-selected to attend |
o |
o |
o |
o |
o |
|
Other (Please specify) |
o |
o |
o |
o |
o |
How easy is it to use the university library website for the
services below?
|
|
Very easy |
Easy |
Difficult |
Very difficult |
I don’t use this
service |
|
Finding journal
articles using the search box on the library home page |
o |
o |
o |
o |
o |
|
Finding an e-book
using the search box on the library home page |
o |
o |
o |
o |
o |
|
Finding a print book
using the search box on the library home page |
o |
o |
o |
o |
o |
|
Accessing a database
to search for articles and other scholarly materials |
o |
o |
o |
o |
o |
|
Requesting a print
book from another library |
o |
o |
o |
o |
o |
|
Requesting an article from
another library |
o |
o |
o |
o |
o |
|
Logging into my
library account to renew a book |
o |
o |
o |
o |
o |
|
Asking for help from a
librarian by IM/chat |
o |
o |
o |
o |
o |
|
Using library Subject
& Course Guides to access materials by subject |
o |
o |
o |
o |
o |
|
Finding
media (e.g., films, videos, online images, etc.) |
o |
o |
o |
o |
o |
|
Booking a group study
room online |
o |
o |
o |
o |
o |
|
Other (Please specify) |
o |
o |
o |
o |
o |
How likely are you to
recommend the following library services to another student?
|
|
Very likely |
Likely |
Unlikely |
Very unlikely |
I don’t use this
service |
|
One on one research
consultation with a librarian |
o |
o |
o |
o |
o |
|
Library workshops
about library research (e.g., finding resources, requesting materials, etc.) |
o |
o |
o |
o |
o |
|
IM/Online chat
research help |
o |
o |
o |
o |
o |
|
E-mail research help |
o |
o |
o |
o |
o |
Suppose you had funding to improve the university library. Please select
up to three of your most important priorities from the list below.
o Access to more online journals
o Access to more books (e-books, print books, textbooks)
o More computers
o More quiet study space
o More group study space
o More electrical outlets
o More whiteboards
o More drink/food options
o Additional comfortable furniture
o Other (Please list) [ ]
Think about your overall library experience at the institution, please
tell us about your experiences with the library that positively impacted your
coursework or research.
|
|