Research Article
Assessment on a Dime: Low Cost User Data Collection
for Assessment
Eric Dillalogue
Assistant Director of
Operations
Kislak Center for Special Collections, Rare Books
and Manuscripts
University of Pennsylvania
Philadelphia, Pennsylvania,
United States of America
Michael Koehn
Director for Library
Operations
Augustus C. Long Health
Sciences Library
Columbia University Irving
Medical Center
New York City, New York,
United States of America
Received: 6 May 2019 Accepted: 27 Mar. 2020
![]() 2020 Dillalogue and Koehn. This is an Open Access article distributed under
the terms of the Creative Commons‐Attribution‐Noncommercial‐Share Alike License 4.0
International (http://creativecommons.org/licenses/by-nc-sa/4.0/),
which permits unrestricted use, distribution, and reproduction in any medium,
provided the original work is properly attributed, not used for commercial
purposes, and, if transformed, the resulting work is redistributed under the
same or similar license to this one.
2020 Dillalogue and Koehn. This is an Open Access article distributed under
the terms of the Creative Commons‐Attribution‐Noncommercial‐Share Alike License 4.0
International (http://creativecommons.org/licenses/by-nc-sa/4.0/),
which permits unrestricted use, distribution, and reproduction in any medium,
provided the original work is properly attributed, not used for commercial
purposes, and, if transformed, the resulting work is redistributed under the
same or similar license to this one.
DOI: 10.18438/eblip29582
Abstract
Objective
–
This article describes the construction and use of a low cost
tool for capturing user demographics in a physical library.
Methods – At
the Health Sciences Library of Columbia University Irving Medical Center, we
created the Tap In/Tap Out tool to learn about the demographic details of our
library visitors, such as their status, school affiliation, and department. The
Tap In/Tap Out tool was implemented twice for two weeks in 2013 and 2017, with
users voluntarily tapping their campus ID when entering and leaving the
library. We checked campus ID numbers against university databases to fill in
demographic details of the library users.
Results – We
constructed the Tap In/Tap Out tool using a Raspberry Pi and RFID card readers
mounted on a foam board poster and placed near the library entrance.
Participation in the Tap In/Tap Out tool ranged from 5-7% of the library gate
count numbers during the survey periods. Though low, this participation
provided a useful indication of user demographics that helped to strengthen
library discussions with university administration. The 2013 survey results,
which showed that the library space was actively used by students from all the
constituent Medical Center schools, were used to support funding
justifications. The 2017 survey results, which showed continued library usage,
were used to illustrate the value of the library to the Medical Center community.
Conclusion –
The Tap In/Tap Out tool was inexpensive to implement and provided more
information about library visitors than gate counts alone. Findings from the
Tap In/Tap Out results were used to demonstrate library usage and justify
funding. We describe how other libraries might create and implement the tool to
capture greater levels of detail about the users visiting their spaces.
Introduction
Assessment is an important function in any library for evaluating usage,
resource effectiveness, staff efficiency, and myriad other elements for
internal and external purposes. Though assessment is a constant point of
discussion today, it is not a new initiative for libraries. In 1976, the
Association of Research Libraries laid out the need to assess all aspects of
the library because “concern has increased for determining library output or
effectiveness – how well the library actually meets users’ needs. This concern
relates to the library’s responsibility to serve, with limited budgets, groups
widely diversified … [and] by the need to further justify activities to the
parent institution, to evaluate possible new services, and to predict and
influence change” (p. 1).
Traditionally, libraries have used gate counts as one way to assess
space use – how many patrons entered or exited the space at a given time on a
day. Though this data provides insight into the level of library foot traffic –
with characteristic spikes for testing periods and dips during breaks – the
data does not include information on who
used the space. As Nackerud, Fransen,
Peterson, and Mastel (2013) note, there are important
questions that go unanswered if all we know are numbers: “Who are these
students? What colleges do they represent? Does the library reach a majority of
students in some measurable way?” (p. 140). Of particular interest to libraries
are the demographic details of visitors: their university affiliation, status,
school, department, and/or program. These demographic details allow libraries
to demonstrate value to the wider campus through assessment efforts.
However, gathering patron demographic information can be difficult. Some
libraries have ID-swipe gate systems that consistently record demographic
information, but libraries without this gate functionality face a technological
hurdle. To address this issue, we have developed a tool called “Tap In/Tap Out”
to acquire patron demographics at the entry and exit points of the library. We
will discuss the technical aspects of setting up a Tap In/Tap Out tool, the
data we collected, and how we used that information.
The purpose of this article is to present a low cost
user information capture tool that can be adapted for assessment in many types
of settings. We discuss the tool’s use in a pre-renovation environment, with
the acquired information used to demonstrate library usage across five health
sciences schools and to make a case for funding, and in a post-renovation
environment to explore current user demographics. Though there are some
limitations to the Tap In/Tap Out tool, we believe it provides an innovative
method to assess library usage at the point of entry. This paper describes how
to create and implement the Tap In/Tap Out tool so other libraries that lack
the technological infrastructure or financial means to install swipe-card entry
gates can capture greater levels of detail about the people using their spaces.
Literature Review
A common way to assess and compare library usage is to
count the number of users who visit a library, most often done with gate counts
at the entry point(s). Whether using mechanical turnstiles or infrared
beam-counting gates, gate counts “remain one of the most widely accepted
methods for measuring facility use” (Stewart, 2011, p. 539). Typically,
commercial providers supply gates that combine methods of tracking library
materials (e.g., books) and counting people.
But gate counts with any device only provide
information on how many users enter or exit a space and do not include
information on who the users were nor how long they stayed in the library
space. The lack of patron details has been partially addressed in newer gate
technologies that require a user to swipe their ID for access, allowing the
library to count the number of visitors and, when connected to a database of
patron information, access additional demographic details on those visitors
(Jones, 2011). For example, Scarletto, Burhanna, and Richardson (2013) were able to determine the
demographics of users visiting the library during overnight hours by capturing
swipe-card entries at the library’s entrance and sending “identification
numbers of users during the study period … to the University Research, Planning
and Institutional Effectiveness (RPIE) office for associated demographic data
relating to department, major, grade point average, class standing,
international status, home campus, ethnicity, and gender” (p. 373). Using that
information, the library had a more informed view of their overnight users.
However, swipe-card entry gates are expensive and not
feasible for all libraries. To address the need for more user information to
assess library usage, some libraries are using alternate demographic data
collection methods to get a better understanding of their spaces and users. For
example, Dotson and Garris (2008), employed building
surveys to measure usage of their library’s physical resources. These surveys
were used to “examine exactly what physical resources people are using” and to
“use that information to make improvements to existing resources, services and
spaces” (p. 11). Nackerud, Fransen,
Peterson, and Mastel (2013) were able to capture
unique patron identifiers via computer log-ins and circulation transactions,
combining that data with other points of patron access, to analyze user
demographics and determine which students were (or were not) using the library.
For example, using this method they found “that 77 percent of undergraduate
students and 85 percent of graduate students made use of the library during the
Fall 2011 semester” (p. 142). And for those undergraduate students who did
visit, Nackerud et al. found that they “consistently
had higher semester GPAs than students who made no use of the library” (p.
140). And Lux, Snyder, and Boff (2016) used
touch-based surveys loaded on iPads to capture patron demographics and reasons
for coming to the library. The authors found that graduate students and faculty
used the library to either study individually or to access library materials;
whereas undergraduate students primarily visited to study alone or as part of a
group (p. 112). Similarly, there are studies that include observations and
seating sweeps, but these do not provide details on who the users are in the
space; hence, those studies are not included here.
Any collection of user data also raises privacy concerns. As the
American Library Association notes, “users expect … to have their personally
identifiable information and library-use data protected and kept private and
confidential …” and “libraries should collect and store only personally
identifiable data required for specific purposes that are disclosed to the
users” (2002). Privacy has been described as a “tightrope” along which we walk
and requires “a type of judgment call by a library staff member or
administrator which pits the mission and goals of the library against user
privacy” (Coombs, 2004, p. 495). There is a wealth of thoughtful literature on privacy
in libraries and we will not explore it all here, but we do address data
collection issues with regards to the Tap In/Tap Out tool in the Methods
section.
We find that Jones’ statement from nearly a decade ago is still true,
that there is an “absence of literature describing tools for analysis of and
practical use for swipe-card data, particularly in informing library decisions
…” (2010, p. 12). This paper adds to the literature on swipe-card data by
presenting the Tap In/Tap Out tool. This tool bridges the gap between the raw
numbers from an infrared beam gate counter and the detailed user information
from a swipe-card entry system, while keeping costs and staff involvement
low.
Background/Aims
As do many libraries, the Health Sciences Library at Columbia University
struggled to understand the populations who used its space. As the primary
provider of study space on the Columbia University Irving Medical Center
(CUIMC) campus, library staff could determine that most library space users
were students. Beyond that, assumptions were made about the demographics of
users in the space (status, school affiliation, program, etc.) based on staff
observations and anecdotal evidence, but these assumptions were not backed up
by quantitative evidence.
Space is a highly valued commodity at CUIMC. The library lost square
footage at several points in its history.
For example, a renovation completed in 2009 converted more than 20,000
sq. ft. of library stacks space into classroom space. The library needed to
demonstrate that students, faculty, and staff of all programs used the
library’s remaining physical space. This would allow the library to advocate
for enhanced maintenance of and upgrade to these spaces, which had seen only
minor updates since the building was completed in 1975.
Other libraries at Columbia University installed entry gates activated
by the University’s RFID badges, gaining useful demographic information about
the users entering their spaces. Rather than just a raw gate count, these
libraries had a wealth of demographic information. Users could be identified by
their university affiliation (student, faculty, or staff), their school or department, and their
enrolled program. In addition, time of day data was available for each entry.
This additional level of detail allows those libraries with swipe card entry
gates to get more information than just a gate count – they can understand how
users from different university departments or programs use their spaces and
how the makeup of users changes over time. These data points help to strengthen
library decision making and the case for funding.
Administrators at the Health Sciences Library examined the library’s
setting and determined that, aside from the financial costs of implementing
swipe-card access entry gates, the logistics of the library’s location created
challenges as well. The library was located immediately behind entry gates for
the Hammer Health Sciences Center, so there was no security benefit added
through entry gates. In addition, since space users had swiped into the
building just seconds before entering the library, staff thought space users
would be frustrated by the need to swipe in again, especially given the
challenges users were having with the existing gates.
But the basic concept of swipe-to-enter provided a starting point. The
library already had RFID card readers in use for circulation transactions at
the service desk. If similar readers could be coupled with an inexpensive data
collection device, it might be possible to produce similar demographics to
other libraries’ entry gates at a much lower cost. The Raspberry Pi (RPi) single board computer seemed like an ideal candidate
for our data collection needs.
To avoid frustrating users of the space, data collection had to be
voluntary and time limited. The resulting data would be a sample, but it would
be an indicator of usage patterns in the space, and the information returned
would be far more detailed than the library’s existing gate count data. Staff
realized that the same methodology could be used to also collect exit data,
providing length-of-stay data. Thus the Tap In/Tap Out
tool was created.
Methods
We designed the Tap In/Tap Out tool as a type of
survey data collection device. Specifically, this tool was created to take a
snapshot of the number and types of patrons entering and exiting the library
during a short sampling period. That Tap In/Tap Out tool follows the concept of
a “survey” defined by Cohen, Manion, and Morrison (2007) as a method to “gather
data at a particular point in time with the intention of describing the nature
of existing conditions …" (p. 205). Participation was voluntary. We were
not seeking statistical significance in collecting the information, but rather
data representative of use and demographics, providing more details than
existing gate counts or patron in/out numbers. We used historical gate count
information, academic calendars, and staff knowledge to choose the two weeks
for surveying, selecting a time in the middle of the semester that avoided any
school breaks or testing days. The study was conducted twice, once in 2013
(pre-renovation of the library) and once in 2017 (post-renovation). In addition,
each iteration included two rounds of data collection, once in the spring and
once in the fall semesters. The exact dates in 2013 and 2017 were different due
to the academic calendars in those years.
The study was designed as a management study of the
library’s patrons, rather than as a research study to develop generalizable
knowledge. As such, it is not human subject research and did not require IRB
approval (Columbia University, 2012). Information on the purpose of the study,
use of information collected, and contact information for additional details
were posted at the point of participation. (See Appendix A for posted text.)
Patron participation was voluntary. Staff were instructed to encourage
participation during the study, but patrons could, and often did, enter and
leave the library without participating. This intervention was the extent of
participation by front line staff, fulfilling the goal of low staff
involvement.
Several factors were considered when examining the
risk of disclosure of collected data. ID card numbers and date/time data stored
on RPi could only be linked to an individual through
secure university databases. Access to these databases is restricted to
employees with a legitimate business need. The work to link the ID card numbers
to user demographics was performed on secure endpoints as required by
university policy. At no time was demographic data stored on the RPi. Data on the RPi computers
was protected by standard Linux login security. Theft was not considered a
significant threat, given the low value of the hardware and constant
surveillance of the space. Given these factors, it was determined that
accidental or malicious disclosure of collected data represented little to no
harm to participants in the study.
Experimental Setup
The library used two RPi
single-board computers and two RFID card readers compatible with the
University’s ID system. Both RPis were running the
latest build of Raspbian Linux available at the time. For the 2013 study, the
library used first generation model B RPis, which
lack Wi-Fi capability. Because the RPi has no
real-time clock, network connectivity (via wired Ethernet) was required for
accurate timekeeping. For the 2017 study, we used third generation RPis with built-in Wi-Fi connectivity.
One of the goals of this project was to minimize the
costs associated with technology and supplies.
The total bill of materials was just over $170 (see Appendix B for a
breakdown). We were able to use RFID card readers from our spare stock,
otherwise these would have cost approximately $160.00 each. The above hardware
would have sufficed for the 2017 rounds of data collection, but we elected to
update our hardware to gain Wi-Fi networking. For the 2017 project, we spent a
similar amount, less the cost of the foam core board.
The RFID card readers are USB human interface devices,
appearing to the RPis as a keyboard. When an ID card
is placed on the reader, it reads the card number and outputs it as a series of
digits, followed by the enter key (similar to an individual typing the number
and pressing enter).
One RPi was designated “IN” and the other was
designated “OUT” for collecting library entry and exit data, respectively. Both
RPis were configured to turn off the graphical
interface and to auto-login on the first virtual terminal (/dev/tty1) to the “cardstats” user, which ran a script, written in Perl, to
collect the 9-digit card number along with date and time each time a card was
read, and write it to local storage. If the script were to crash or exit, the
account would log out, and the auto-login process would re-start it.
The library produced a poster, printed on foam core board, with graphics
indicating which RFID reader was “IN,” which was “OUT,” and mounted the RFID
readers to the board with tape (Figure 1). In addition, the poster contained
information about the purpose of the project and how the collected card data
would be used (see Appendix A for the poster text). To maximize impact, the
library designed a reminder poster that could be seen easily as users entered
or exited the library.

Figure 1
Poster design for Tap In/Tap Out on one board.
The poster was placed on a tripod in a conspicuous location near the
entry of the library, near power, and, for the 2013 study, near Ethernet ports.
Each time the survey ran for just over two weeks, to allow 14 full days
of data collection. To protect against accidental data loss, card data was
copied daily to a secure location. During the 2013 study, staff used scp to retrieve the data daily. For the 2017 study, a
nightly job ran to copy the data to a Windows share via Samba.
Data Analysis
Data collected was saved in a tab-delimited, plain text file, with the
first column containing the card number, the second column an ISO 8601 date and
time statement, and the third column a directional indicator (IN or OUT). (See
Appendix C for an example of the raw data.) After collection, data was
transferred to a secure endpoint for further analysis.
For the 2013 study, data was analyzed using a custom Perl script
(Appendix D). During this study period, the library closed daily before
midnight. Therefore, any IN taps without a corresponding OUT tap at the end of
the day represented instances where the users had tapped in, but not tapped
out. (See Appendix C for an example of merged data.)
After collecting all card data, the list of card numbers was sent to an
analyst at Columbia University Information Technology (CUIT), who matched the
card numbers against the University’s ID Management database. CUIT returned the
list with added affiliation information, including role (student, faculty, or
staff), school, division, department, and academic program. (See Appendix C for example demographic
data.)
The 2017 study involved some adjustments to the data analysis process.
The change to the library’s hours to a 24-hour space required the ability to
compare data spanning two days. It was no longer possible to determine who had
left without tapping their ID as we did in the 2013 study. To resolve this
issue, we used a sliding six hour window based on the
tap in time to look for any exit taps. If no matching exit was found within the
six hour window, we assumed the user left the library
without tapping. We chose the six hour window based on
the duration of visit information from the 2013 study, where only one user
exceeded four hours in the library and none exceeded six hours.
Results/Outcomes
The primary use of the Tap In/Tap Out data has been to
quantitatively demonstrate to university administration the continuing value of
library space to the Medical Center community. The data strengthened the
library’s case for increased investment in library spaces. We found the two
most useful reports for administration to be a tabular count by department
(Appendix E) and a pie chart of library visits by school (Appendix F).
Response rates to the Tap In/Tap Out surveys were low
– 5% of the gate count in both 2013 surveys and the fall 2017 survey, 7% in the
spring 2017 survey – but provided a useful snapshot of patron demographics. The
response rate was calculated for each day in the study period and remained
within a 4% to 6.5% daily range. While we acknowledge that the information
collected was not representative of all library users, it was still useful for
management purposes to indicate usage and justify funding.
Results from the Tap surveys confirmed that the Health Sciences Library was
actively used by students from each of the four main CUIMC schools – the
College of Dental Medicine, Joseph L. Mailman School of Public Health (MSPH),
School of Nursing, and College of Physicians & Surgeons (now Vagelos College of Physicians and Surgeons, VP&S) – as
well as by the cross-campus students from the Graduate School of Arts and
Sciences and by students enrolled in programs at the university’s Morningside
Heights campus. The results also showed taps from faculty and staff. Since
there had been a perception that the library was only a student space, this was
useful hard data.
For those who tapped out, we were able to extrapolate the duration of
their stay. For the 2013 study, approximately two-thirds of taps recorded were
part of a matched pair, meaning we could determine the length of a user’s time
in the library. Analysis showed that 44% of respondents spent less than a
half-hour in the library during their visit. The second largest group (about
30%) were those who stayed for at least one and up to three hours. This data
supported anecdotal staff observations that a number of library users mainly
came to access a computer or printer, and then left shortly thereafter. But it
also showed that we also had users who spent more time in individual study or
on collaborative projects.
The 2013 study was used to determine the level of use from each of the
health sciences schools. We found that, in both the spring and fall semesters,
students from each of the CUIMC schools visited the library in roughly proportional
numbers in comparison to each school’s campus enrollment. The largest school by
enrollment, the Mailman School of Public Health (MSPH), were also the users who
tapped the most. The finding that MSPH users were the largest library user
population was a bit of a surprise. For many years, the working assumption had
been that the Vagelos College of Physicians &
Surgeons (VP&S) students were the largest library user population. In
addition, the duration data indicated that the space had to support both quick,
in-and-out uses such as printing, as well as extended study sessions.
At the time of the 2013 study, the library had started planning a major
renovation of its main reading room, but it had no source of funding for the
improvements. The demonstration that students from all of the CUIMC schools
used the library space allowed the library to tap into funding earmarked to
benefit students of all of the constituent schools. Recognition that MSPH
students were our largest community, along with knowledge that the MSPH
curriculum focused heavily on small group cooperation pointed toward the need
for spaces accommodating such groups. Finally, duration data led us to design
spaces suitable for both quick, in-and-out type visits, and for long study
sessions.
The 2017 study results were used to examine the extent of library use
(post-renovation) by students from each of the schools, as well as to compare
with the 2013 results to assess if our patron base had changed. Comparing the
same periods for both survey periods, one of the most significant findings was
that the VP&S students, one of our largest groups of users, had decreased
in the number of taps by 11 percentage points for the spring semester and 13
percentage points for the fall. This decrease was expected, as VP&S had
completed construction of a new medical education building in the interim, but
it was a welcome confirmation of the effect of this change and a reassurance
that the medical students had not completely abandoned the library, as was
feared.
Limitations
The primary limitation of the Tap In/Tap Out tool is that the data is a
self-selected sample. The study only captures a brief period of time and
participation is voluntary. Staff encouraged users to participate, but it was
observed that not all users swiped their IDs. As shown in the comparison of
taps with gate count, participation was low. To overcome this, more active
staff involvement in soliciting users to tap their IDs could help to increase
participation rates.
A second limitation is related to the concept of a “visit” to the
library. Users of the Health Sciences Library space will interrupt their study
time to access facilities outside of the library, such as restrooms and the
café. If users return immediately after leaving, is this one visit or two? The
correct answer to this question likely depends upon the intended case use for
the collected data. However, it is possible to process the data and screen for
an “OUT” tap followed closely by an “IN” tap so as to remove these brief exits
and re-entrances.
A third limitation is the requirements of the Raspberry Pi computer. As
a data collection device, the RPi performed admirably
for such an inexpensive device. As noted above, the lack of built-in Wi-Fi
capability in the first generation RPi dictated some
logistics of design and placement, which was resolved when we obtained a newer,
Wi-Fi capable, version of the RPi. The need for
electricity continues to constrain placement. In addition, as it is a general purpose computer, configuration requires staff with
knowledge of the Linux operating system and general programming that some
libraries may not possess. However, the Raspberry Pi online community includes
a wealth of helpful tutorials to configure and operate the computer. Academic institutions
with a computer science program could also potentially borrow the expertise of
students.
Conclusion
The Tap In/Tap Out tool met the design needs of the library
Our goal in creating the Tap In/Tap Out tool was to create a low-cost
method of collecting more details about the people using the library space. The
Tap In/Tap Out tool met our design needs because the Raspberry Pi computer
system and auxiliary items were low cost (under $200) and allowed us to gather
more demographic information on our users, such as their status, school
affiliation, and department. The tool was also voluntary and required little
interaction from library staff.
The Tap In/Tap Out tool allowed us to gather useful demographic data to
inform decision making
The data we collected with the Tap In/Tap Out tool helped to flesh out
the quantitative information we were collecting about library space use during
gate counts and to back-up or refute staff observations about space use. The
tool was a way to compensate for a lack of card-swipe entry gates and the
demographic detail those gates can provide. The Tap In/Tap Out tool allowed us
to gather similar demographic information about the users visiting the space,
such as their university affiliation, status, school, department, and/or
program. The 2013 and 2017 surveys were used to assess library space visits by
users from each of the Medical Center schools, make informed justifications for
library funding and renovation, and to help show that the library is a vital
element to the campus community.
The Tap In/Tap Out tool data was persuasive to university administration
The primary use of the Tap In/Tap Out data was to quantitatively
demonstrate to university administration the continuing value of library space
to the Medical Center community. The 2013 survey results helped to demonstrate
that students from all of the CUIMC schools used the library space. This
allowed the library to tap into funding earmarked to benefit students of all of
the constituent schools. The 2017 survey findings helped to demonstrate to
university administration that there was continued use by members from each
CUIMC school.
The Tap In/Tap Out tool is a possible option for other institutions
looking to gather more detailed user information
Institutions that want to know more than the number of people walking
through their doors, but who do not have the technological or financial means
to implement swipe-card entry gates, could use the Tap In/Tap Out tool as a
low-cost solution for gathering user information. As implemented, there are
some limitations due to the voluntary nature of participation, but more active
involvement by library staff in encouraging participation could overcome this.
Setting-up the tool is possible at most institutions, requiring only minimal
technical knowledge of the Linux operating system and a suitable programming
language.
References
American Library Association. (2002). Privacy: An
interpretation of the Library Bill of Rights. Retrieved from http://www.ala.org/advocacy/intfreedom/librarybill/interpretations/privacy
Association of Research Libraries. (1976). User
statistics and studies. SPEC Flyer, 25, 1-2. Retrieved from https://catalog.hathitrust.org/Record/000689858
Cintron, J., Courtier, D., & DeLooper, J.
(2017). Testing three types of Raspberry Pi counters. Code{4}Lib
Journal, 38. Retrieved from https://journal.code4lib.org/articles/12947
Cohen, L., Manion, L., & Morrison, K. (2007). Research
methods in education. (6th ed.). Routledge.
Columbia University. (2012). Institutional Review Board standard operating procedures. Retrieved
from https://research.columbia.edu/sites/default/files/content/
HRPO/IRB_SOPSuperseded_v4.2_Nov2.12.pdf
Coombs, K. A. (2004). Walking a tightrope: Academic
libraries and privacy. The Journal of Academic Librarianship, 30(6),
493-498. https://doi.org/10.1016/j.acalib.2004.08.003
Dotson, D. S., & Garris,
J. B. (2008). Counting more than the gate: Developing building use statistics
to create better facilities for today's academic library users. Library
Philosophy & Practice, 1-13. Retrieved from https://digitalcommons.unl.edu/libphilprac/208
Jones, J. L. (2011). Using library swipe-card data to
inform decision making. Georgia Library Quarterly, 48(2), 11-13.
Retrieved from https://scholarworks.gsu.edu/univ_lib_facpres/21
Lux, V., Snyder, R. J., & Boff,
C. (2016). Why users come to the library: A case study of library and
non-library units. The Journal of Academic Librarianship, 42(2),
109-117. https://doi.org/10.1016/j.acalib.2016.01.004
Nackerud, S., Fransen, J., Peterson, K., & Mastel, K. (2013). Analyzing demographics: Assessing
library use across the institution. Portal, 13(2), 131-145. https://doi.org/10.1353/pla.2013.0017
Sanders, M., & Hodges, C. (2014). An overnight success?: Usage patterns and demographics of academic
library patrons during the overnight period from 11 p.m.-8 a.m. Journal of Access Services, 11(4),
309-320. https://doi.org/10.1080/15367967.2014.945121
Scarletto, E. A., Burhanna, K. J., & Richardson, E.
(2013). Wide awake at 4 AM: A study of late night user
behavior, perceptions and performance at an academic library. The Journal of Academic Librarianship, 39(5),
371-377. https://doi.org/10.1016/j.acalib.2013.02.006
Stewart, S. (2011). Building measurements: Assessing
success of the library’s changing physical space. The Journal of Academic Librarianship, 37(6), 539-541. https://doi.org/10.1016/j.acalib.2011.09.002
Appendix A
Tap In/Tap Out Poster Text
Why Tap?
Q: Why is the library collecting data?
A: The library is collecting data to know more about
space use patterns.
Q: How is the library collecting data?
A: Library users should tap their ID cards when they
enter and exit the library.
Q: What data is the library collecting?
A: The library is collecting ID card number, time of
tap, and direction (“in” or “out”). CUIT
will look up card numbers and provide demographic information such as school
and department. The library will not
have access to personally identifiable information.
Q: How does this information help the library?
A: The library will be better able to understand who
is using the library, when, and for how long.
This understanding will inform space planning and future surveys.
For more information, please contact the Library at
hs-library@columbia.edu
Appendix B
The 2013 Tap In/Tap Out study bill of materials
|
Product |
Unit price ($) |
Quantity |
Total ($) |
|
Raspberry
Pi model B |
35.00 |
2 |
70.00 |
|
RPi case |
7.35 |
2 |
14.70 |
|
RPi power supply |
7.00 |
2 |
14.00 |
|
8GB
SD flash drive |
10.75 |
2 |
21.50 |
|
Printed
foam core mounting board |
50.00 |
1 |
50.00 |
|
TOTAL |
|
|
170.20 |
Appendix C
Sample of Data Collected
Sample of Raw Data
|
Card
Number |
Date/Time |
Direction |
|
XXXXXX365 |
2013-04-22T08:30:30 |
IN |
|
XXXXXX985 |
2013-04-22T08:33:10 |
IN |
|
XXXXXX121 |
2013-04-22T08:36:06 |
IN |
Sample of Merged Data
|
Card
Number |
Date/Time
IN |
Time
IN |
Date/Time
OUT |
Time
OUT |
Duration
of visit (minutes) |
Duration
of visit HH:MM:SS |
|
XXXXXX379 |
2013-04-25T08:37:16 |
8:37:16 |
2013-04-25T08:44:12 |
8:44:12 |
6.93 |
0:06:56 |
|
XXXXXX839 |
2013-04-25T09:06:00 |
9:06:00 |
2013-04-25T09:34:37 |
9:34:37 |
28.62 |
0:28:37 |
|
XXXXXX324 |
UNKNOWN |
UNKNOWN |
2013-04-25T09:39:40 |
9:39:40 |
UNKNOWN |
UNKNOWN |
|
XXXXXX991 |
2013-04-25T21:04:48 |
21:04:48 |
UNKNOWN |
UNKNOWN |
UNKNOWN |
UNKNOWN |
Sample of Demographic Data
|
SECURITY
ROLE |
ACAD
LEVEL |
SCHOOL
CODE |
SCHOOL
NAME |
DIV
CODE |
DIV
NAME |
ACAD
DEPT CODE |
ACAD
DEPT NAME |
PROG
CODE |
PROGRAM
NAME |
|
CUIMC FT Support Staff |
P |
SPUB |
THE JOSEPH L. MAILMAN
SCHOOL OF PUBLIC HEALTH |
PH |
PUB HEALTH |
HPM |
HEALTH POLICY
MANAGEMENT |
PMHPM |
HEALTH POLICY AND
MANAGEMENT |
|
CUIMC FT Student |
U |
SNUR |
SCHOOL OF NURSING |
RN |
NURSING-UGRD |
NURS |
SCHOOL OF NURSING |
RNETP |
COMBINED BS/MS PROGRAM
IN NURSING |
|
CUIMC FT Student |
P |
COPS |
COLLEGE OF PHYSICIANS
AND SURGEONS |
PT |
PHYSCL THRPY |
PHYT |
PHYSICAL THERAPY |
PTDPT |
PHYSICAL THERAPY |
|
CUIMC FT Student |
G |
SNUR |
SCHOOL OF NURSING |
NP |
NURSING-GRAD |
NURS |
SCHOOL OF NURSING |
NPWOMH |
WOMEN'S HEALTH |
Appendix D
Perl Script
1)
Combine the IN and OUT files for each date.
2)
Sort the combined files for a single date in ascending
order by timestamp.
3)
For each IN record, save the card number and the time.
4)
For each OUT record, check previous INs
to see if there’s a corresponding entry.
a.
If yes, calculate duration of stay and output card
number, entry and exit times, and duration, write the result to file, and clear
the saved IN entry.
b.
If no, set IN time and duration to UNKNOWN and write
the result to file.
5)
At the end of processing, write out any unmatched IN
entries, setting OUT data and duration to UNKNOWN.
Appendix E
Count by Department
|
|
SUN |
MON |
TUE |
WED |
THU |
FRI |
SAT |
Total |
|
COLLEGE OF DENTAL MEDICINE |
|
|
7 |
4 |
6 |
2 |
2 |
21 |
|
COLLEGE OF PHYSICIANS AND SURGEONS |
17 |
27 |
32 |
30 |
32 |
18 |
17 |
173 |
|
HUMAN NUTRITION |
|
5 |
1 |
2 |
2 |
6 |
|
16 |
|
MEDICINE |
10 |
14 |
15 |
14 |
17 |
11 |
11 |
92 |
|
OCCUPATIONAL THERAPY |
1 |
|
1 |
2 |
1 |
|
|
5 |
|
PHYSICAL THERAPY |
6 |
8 |
15 |
12 |
12 |
1 |
6 |
60 |
|
COLUMBIA COLLEGE |
|
1 |
|
|
|
|
|
1 |
|
GRADUATE SCHOOL OF ARTS AND SCIENCES |
1 |
1 |
3 |
3 |
2 |
4 |
2 |
16 |
|
SCHOOL OF CONTINUING EDUCATION |
|
|
1 |
1 |
|
1 |
|
3 |
|
SCHOOL OF GENERAL STUDIES |
|
2 |
|
|
|
|
|
2 |
|
SCHOOL OF NURSING |
4 |
9 |
21 |
11 |
6 |
3 |
4 |
58 |
|
THE FU FOUNDATION SCHOOL OF ENGINEERING &
APPLIED SCIENCE |
|
|
|
|
1 |
|
|
1 |
|
THE JOSEPH L. MAILMAN SCHOOL OF PUBLIC HEALTH |
15 |
46 |
41 |
47 |
36 |
23 |
11 |
219 |
|
BIOSTATISTICS DEPT |
2 |
|
2 |
|
3 |
|
|
7 |
|
ENVIRONMENTAL HEALTH SCIENCES |
1 |
3 |
1 |
1 |
1 |
|
1 |
8 |
|
EPIDEMIOLOGY |
7 |
23 |
15 |
23 |
16 |
12 |
7 |
103 |
|
HEALTH POLICY MANAGEMENT |
2 |
10 |
6 |
10 |
5 |
1 |
2 |
36 |
|
POPULATION AND FAMILY HEALTH |
1 |
3 |
7 |
4 |
|
7 |
|
22 |
|
PUBLIC HEALTH |
|
|
3 |
|
4 |
|
|
7 |
|
SOCIOMEDICAL SCIENCES |
2 |
7 |
7 |
9 |
7 |
3 |
1 |
36 |
|
(blank) |
2 |
8 |
12 |
11 |
15 |
8 |
2 |
58 |
|
Grand Total |
39 |
94 |
117 |
107 |
98 |
59 |
38 |
552 |
|
Gate Count |
628 |
2425 |
2241 |
2344 |
1913 |
1428 |
572 |
11551 |
|
Response Rate |
6.2% |
3.9% |
5.2% |
4.6% |
5.1% |
4.1% |
6.6% |
4.8% |
Appendix F
Usage Charts
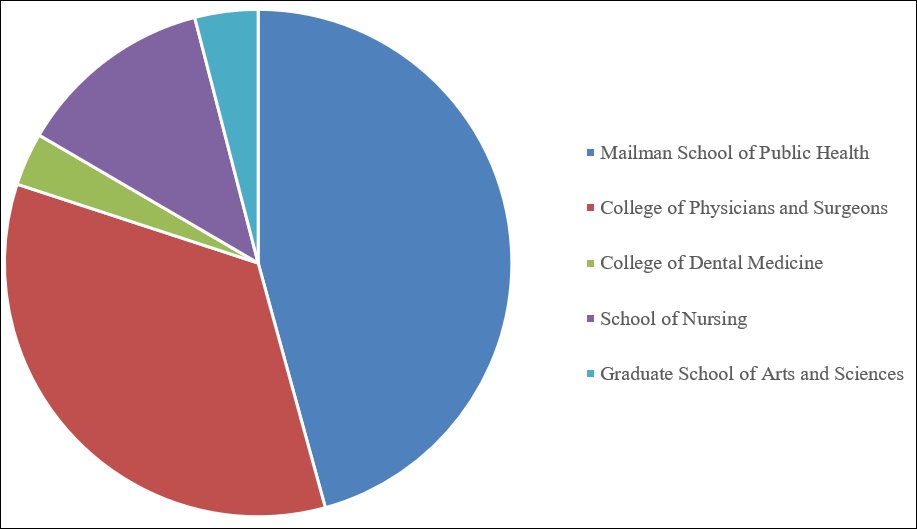
Usage Chart 1
Library Visitors by School -- Spring 2013 (based on a
2-week sample)
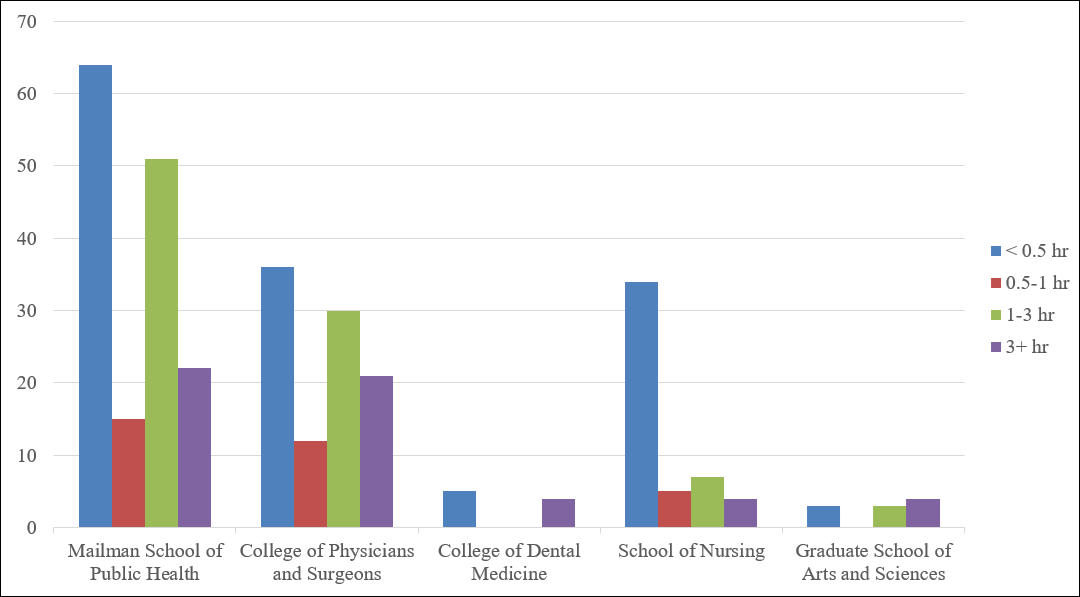
Usage Chart 2
Duration of Visit by School -- Spring 2013 (based on a
2-week sample)