Research Article
An Analysis of Student Performance at the Intersection
of Diversity and Information Literacy
Nastasha E. Johnson
Assistant Professor of
Library Science
Physical and Mathematical
Sciences Information Specialist
Purdue University Libraries
and School of Information Studies
Purdue University
West Lafayette, Indiana,
United States of America
Nathan Mentzer
Associate Professor
Engineering/Technology
Teacher Education
Dept of Technology
Leadership & Innovation
Dept of Curriculum and
Instruction
Purdue University
West Lafayette, Indiana,
United States of America
Received: 26 Apr. 2018 Accepted: 26 Apr. 2019
![]() 2019 Johnson and Mentzer. This is an Open
Access article distributed under the terms of the Creative Commons‐Attribution‐Noncommercial‐Share Alike License 4.0
International (http://creativecommons.org/licenses/by-nc-sa/4.0/),
which permits unrestricted use, distribution, and reproduction in any medium,
provided the original work is properly attributed, not used for commercial
purposes, and, if transformed, the resulting work is redistributed under the
same or similar license to this one.
2019 Johnson and Mentzer. This is an Open
Access article distributed under the terms of the Creative Commons‐Attribution‐Noncommercial‐Share Alike License 4.0
International (http://creativecommons.org/licenses/by-nc-sa/4.0/),
which permits unrestricted use, distribution, and reproduction in any medium,
provided the original work is properly attributed, not used for commercial
purposes, and, if transformed, the resulting work is redistributed under the
same or similar license to this one.
DOI: 10.18438/eblip29438
Abstract
Objective – When teaching
Information Literacy (IL) concepts, instructors often have no knowledge about
the background or previous IL exposure of the students they are teaching.
This study aims to create a holistic
picture of the students at a large Midwestern United States university in a first year introductory course on the design process for
solving engineering problems.
Methods – Institutional
data and course level data were traced and linked to individual students in an
introduction to design thinking first year course. This course is at a major
high research activity institution in the Midwestern United States. From a
total course size of 650, institutional and course level data of 127 students
were selected randomly and analyzed. Some data points are self-reported and some
data points are performance-based.
Results – Underrepresented
minorities (URMs) had a higher increase in IL score from assignment 1 to
assignment 3 than non-URM students. However, non-URMs performed higher on both
the first and the last assignments. Students in concurrent IL designated
courses had a higher increase from assignments 1 to 3 than those not in
simultaneous IL designated courses. Black and international students had the
highest increases from assignments 1 to 3 of any demographic. Regarding IL, the
fact that none of the students had been exposed to much IL instruction
justified continued collaboration in the course between the instructor of
record and the IL specialist. There were significantly negative correlations
between the final grade and first-generation status. Legacy students also
performed more poorly from assignments 1 to 3.
Conclusion – Students are more diverse in a single
classroom setting than presumed prior to research; therefore, our instructional
practices should be diverse and inclusive, as well. More preparation work and
fact finding should be conducted by library faculty and instructors to
facilitate the learning of the students, and not just the act of teaching.
Librarians could ask for more information about the course demographics and
respond accordingly. Librarians should also be properly trained in
instructional practices to be better equipped to meet the expectations and
challenges of teaching a diverse class.
Introduction
In higher education, library faculty and instructors
rarely know about the backgrounds of the students we teach. We are often
encouraged to teach to a variety of types of students, not completely
understanding what that means or looks like in the context of our individual
classes. Furthermore, librarians may be at a disadvantage, not knowing the
information literacy (IL) skills of the students that we teach. We may be
invited to speak on a topic, with little to no knowledge about what they are
preparing for and how much they may already know. Information literacy
instruction sometimes occurs as if in a vacuum, with little knowledge about the
background and IL exposure of the students taught. This same lack of knowledge
often applies when we design our own courses. We often
teach what we want them to know, but not what they are prepared to
understand.
Not only are past IL experiences ignored, so are
students’ concurrent research and IL experiences. We know that preparedness
gained in high school can have an impact on performance in college, including
research practices (McCarron & Inkelas, 2006). Preparedness
can sometimes be related to the rigor and resources of their high schools (Roderick, Coca, & Nagaoka, 2011) but also
to family finances (Bettinger, 2004; Castleman & Long, 2016) or not
having exposure to those who have attended college before, i.e.,
first-generation college students (Bui, 2002; Pike & Kuh, 2005; Stroud, 2017). There
have been many studies on the intersection of gender and grade performance,
especially in STEM disciplines (Hubbard, 2005; Severiens & ten Dam, 2012).
Furthermore, information literacy and library usage are positively correlated
with student matriculation (Soria, Fransen, & Nackerud,
2013).
In the LIS literature, the relationship between student success and
information literacy has been well documented. In 2014, Soria, Fransen, and Nackerud conducted a
series of regression analyses of over 5000 students and found that students who
had used the library resources and services at least once in the first year had
a higher GPA than those who did not. Though several data points were collected,
they did not specifically report about the performance differences of students
along ethnicities, income, and other “pre-college” data. There was an
opportunity to explore the library use and exposure along with a variety of
data points, which this study will do.
The LIS profession is continuously challenged to think
beyond race and ethnicity to include other diversity measures. Specifically, we
were challenged to expand our definition of diversity to include
“underrepresented, disadvantaged, and underserved in terms of information” (Jaeger, Subramaniam, Jones, & Bertot, 2011, p. 11). Based on their definitions, diversity expands
to include any people who may not have the best access to information, whether
it is because of language barriers, access to technology, or statistical status
as a minority. According to Fabbi’s (2015) research on the use of the iSkills assessment
of information and computer testing, she found that there are four predictive
variables to a high school student’s success: student’s best language, race,
cumulative GPA score and honors/non-honors curricular paths. This was supported
by Huerta and Watt’s (2015) work that also said that GPA and AP courses in high
school predicted college success. After
high school, more research is needed to explore those predictive variables over
time. Conversely, Lanning and Mallek (2017) found that students’ high school performance and demographics had no
influence on their information literacy performance. They collected demographic
and high school information, along with admission test scores. Only their
current GPA and ACT were relevant in their post-test regression analysis of IL
performance.
Library instruction and cultural competence is an
emerging area of interest for researchers. Understanding diversity is quite
different than being culturally competent and adept when working with people
who are different than you, especially in an instructional setting. Lori S.
Mestre’s research (2009) has been looking at cultural competence in K-12 and
college environments. In 2009, she published a work that found a significant
gap in the cultural competence training of librarians before professional
positions (Mestre, 2009). She
found that such training would help librarians modify their instruction to be
more culturally non-offensive (Mestre, 2009). In
2010, in the book Librarians Serving
Diverse Populations (Mestre, 2010) she
expanded on her earlier research to suggest how librarians could be trained in
intercultural competence, as well as in strategies for library administration
and library school curriculum development to effect positive change for
professionals and pre-professionals. Some of the efforts include strategic
assessment and ongoing training on incorporating multiculturally sensitive
stories in the lesson planning (Mestre, 2010, pp. 100-101).
In 1991, Marilyn Loden and Judy Rosener
published pioneering work on the dimensions of diversity (Loden & Rosener, 1991). In their book, they
introduced the diversity wheel, with primary and secondary levels of diversity
of individuals and institutions. The first level of diversity represents the
internal dimensions of diversity, characteristics that influence self-identity.
The six dimensions on the first level are age, gender, sexual orientation,
physical ability, ethnicity, and race. The second level of diversity represents
external characteristics that influence social identity. The 10 dimensions on
the second level are: marital/family status, parental status, geographic
location, income, personal habits, recreational habits, first language, work
experience, educational background, and work experience. The original
dimensions were expanded in 2010 to include income, class, and spiritual
beliefs. These dimensions and characteristics of diversity can influence how
people value themselves and those around them. Because of the value placed on
these dimensions, individually and collectively, the dimensions of diversity
can positively or negatively influence interpersonal interactions in the
classroom (Milem, Chang, & Antonio, 2005).
Understanding these dimensions and where students appear within the social
construct of the classroom is within the realm of responsibility for teaching
faculty who are interested in effectively teaching to all walks of students (Milem et al., 2005). For
this study, we will relate these dimensions of diversity with student
performance on assignments to understand more about their performance along those
dimensions. The dimensions are many of the data points collected by the
university or self-reported by students at admission. We will collate those
variables to create a holistic picture of the students in the course studied.
Background of the Course
According to the Association of American Colleges and Universities
(AACU) Information Literacy VALUE Rubric, information literacy is “the ability
to know when there is a need for information, to be able to identify, locate,
evaluate, and effectively and responsibly use and share that information for
the problem at hand” (Association of American College and Universities, 2019). In the
classroom setting it may be manifest as written assignments, projects, or other
learning objects that require research and producing an assignment or
experience. According to criterion 3 of the AACU rubric, the student should be
able to evaluate information and its sources critically. Additionally, in
criterion 5, students should access and use information ethically and legally.
The course studied, TECH 120, is a first-year gateway course which introduces
students to design thinking for solving problems. The steps of the design
thinking include utilizing available information at each step, including defining the problem,
brainstorming solutions, and developing and testing a prototype. The AACU IL
standards, not the current or previous ACRL IL standards, are the approved
definitions used to create the “information literacy” core curriculum
designation by University Administration at the institution where the study was
held. The learning objectives for this course, and others that are considered
core curriculum IL designated courses at the institution, are created using the
AACU IL standards.
TECH 120, Technology and the Individual, an introduction to technology
design, typically enrolls approximately 650 students each year, most of whom go
on to pursue majors in science, technology, engineering and mathematics (STEM)
disciplines. It is the gateway course to the College of Technology and is a
required course for all of the majors in that College. Most of the students are
first-year students. TECH 120 also fulfills the information literacy course
category of the general education core curriculum requirements that all
students must complete before graduating. A librarian has been an integral part
of the course design and has contributed information literacy-related content
through the entire length of the semester-long course, including assistance
with rubric design and assignments.
Student assignments are produced along the design thinking continuum of
designing prototypes, including three IL-specific assignments that were
analyzed as a part of this study. The first assignment is a bibliography
created by the students on pedestrian safety at crosswalks, after watching a
librarian-created video on keyword selection and the basic use of the databases
Google Scholar, Engineering Village, and Academic Search Premier. The second
assignment is a repeat of the first assignment, after a librarian in-class
visit to review the databases and answer questions about their experiences. At
the end of the semester, as a final project and the third assignment of this
study, students produce academic-style poster presentations about a
technological problem and solution within their College. A bibliography section
is included in the rubric for this assignment and is also a part of the
optional templates provided. The self-selected problems vary from
mechanical/facilities problems to student time-management problems.
Aims
This study aims first to create a holistic picture of the lives of the
students in a single technology course; capturing demographic data, high school
rank, Pell Grant eligibility, college transcript, and other institutional data
and assessments. We want to investigate which demographics and common
categories of diversity, i.e., underrepresented minorities (URMs),
first-generation and legacy students (relatives,
usually children, of a graduate of a school), and family financial
contribution, correlate to their IL performance in a first-year course. We also
investigate how students perform who have taken IL courses before or
concurrently.
Methods
Two separate IRB approvals were granted for this
study. The first IRB protocol enabled the ethical use of the student
assignments for citation analysis. The second IRB protocol granted consent to
engage in data agreements with Financial Aid, the Registrar, and Admissions for
the ethical use of the institutional data of the students studied in the first
IRB. The institutional data was paired with the citation scores of the
assignments completed by the students.
Variables
There are 11 non-IL independent variables in this
project, along with 3 IL dependent variables. The variables are defined in
Table 1.
Table 1
Project Variable
Definitions
|
High
School Name & Location |
secondary
institution listed on the student’s transcripts, geographic location |
|
Course
Grade Data Final grade letter & value |
the
final grade submitted to the registrar’s office, and its weight |
|
Major |
selected course of undergraduate study |
|
Gender |
commonly
referred to as “sex”, self-identified biological and physiological
characteristics that denote male and female, as defined by the World Health
Organization |
|
Ethnicity |
identified
as having the physical characteristics of a particular ethnic or cultural
group; one of 6 options: 2+ Races, Asian, Black/African American,
Hispanic/Latinx, International, White; includes non-domestically/foreign born |
|
Underrepresented
Minority (URM) status |
university assigned; denotation of the student as an underrepresented racial minority, such as Latinx,
African American/Black, or Asian American.
Does not include non-domestically/foreign born |
|
Semester
GPA |
cumulative
grade point average with all coursework in the semester studied |
|
Overall
GPA |
cumulative
grade point average with all coursework in entire college career |
|
First
generation status |
whether
a student’s parents have not attended or graduated from a higher education
institution |
|
Legacy
status |
whether
a student’s parents or other immediate family members have attended the
institution where the study was held |
|
Birthdate |
the date when a student was born |
|
Pell
Grant eligibility |
whether
a student’s financial contribution or family’s contribution makes them
eligible for need-based federal financial aid, i.e. how much of the cost of
education can be provided by the student and/or the parents. |
|
Assignment
one |
an
annotated bibliography collected and analyzed using the rubric in the Appendix,
before librarian-led instruction |
|
Assignment
three |
a
bibliography collected and analyzed using the rubric in the Appendix at the
end of the course |
|
Average
(Avg) IL Difference |
average difference in the citation scores between assignment 1
and assignment 3 |
|
Concurrent
IL Status |
whether student is enrolled in another IL designated core
curriculum course during the same semester such as Freshmen English |
Citation Analysis Process
A 127-student sample population was randomly
selected from a total 650-student course, across 17
sections. Each of the students was assigned a number, and numbers were selected
using an online randomizer, www.randomizer.org. Student assignments were
collected and analyzed using a customized three-point scale rubric based on the
CRAAP test (Meriam Library, 2010) on the
elements of currency, relevance, authority, accuracy, and purpose of the
citations rendered. The author created a 3-point scale to measure the merit of
each criterion, from low (1) to high (3). Three separate assignments were
collected: 1) a bibliography after watching an online IL video, 2) a
bibliography created after a librarian-facilitated face-to-face session, and 3)
an end-of-course project bibliography. However, for this study, we evaluated
the difference in IL performance from assignment 1 and assignment 3. That is,
we evaluated the difference between an assignment early in the semester with an
assignment at the end of the semester. Those IL results were then paired with
institutional data about each student. Four librarians, in two teams of two,
normed the citation scores of the students’ assignments to establish
inter-rater reliability. The librarians randomly selected 10 assignments, measured
them individually, and then discussed them to normalize the scores given.
Librarians met three times to discuss the scores due to the number of
assignments and to ensure consistency over time. The librarians were from
different disciplines or departments, in order to minimize the subjective bias
inherent with being familiar or unfamiliar with the disciplines that the
students cited.
Institutional Data Collection
Data sources include the campus learning management
system, the campus Office of Institutional Research, Assessment and
Effectiveness, and the Financial Aid office. Some data points, such as the
first-generation status, are self-reported, and other data points are
performance based. Data were retrieved via IBM Cognos Analytics, which is web
modeling and analysis software. All identifiable data were anonymized by a
campus data analyst prior to being shared with the other authors. Project
metadata was kept via a shared Google document.
Data were stored using Excel spreadsheets. Data analysis was conducted
using Minitab, Excel, and Tableau. We used descriptive and inferential
statistics to determine how different demographics and preparedness affect
performance. Minitab was used to calculate Pearson correlations to determine
whether or not there were any associations between variables. Next, Excel was
used to test for significance. One-sided t-tests and ANOVA t-tests were
conducted to determine p values. Cohen’s D was used to determine effect size. A
t-test’s statistical significance indicates whether or not the difference
between groups’ means most likely reflects a real difference in the population
from which the groups were sampled. Finally, Tableau was used to create data
visualizations to get a view of the demographic breakdowns.
Results
After compiling the data, we found the overall demographics of the
class. Students from outside of the College of Technology comprised 9% of those
enrolled, which means that 91% were College of Technology majors. The class
consisted of 81% that were self-identified as male, 69% white, and 13%
underrepresented minorities. A total of 76% of the students were freshmen.
Concurrent Enrollment in an IL Course
A total of 62% of TECH 120 students were not concurrently enrolled in
another information literacy core curriculum course. However, 32.28% (41)
students were also enrolled in ENGL 106, the cornerstone English course
required by all freshmen. Another 5.51% (7) were enrolled in STAT 301, which
also fulfilled the IL requirements as required by the university.

Figure
1
Percentage
of students in concurrent IL course.
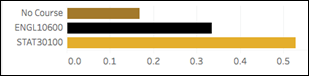
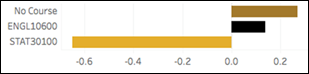
Figure 2
Citation score
difference of students in concurrent IL course.
Prior Enrollment in an IL Course
Most students, 83.46%, had not completed an IL categorized core
curriculum course prior to enrollment in this course. However, one student who
scored considerably worse on both assignments had taken STAT 301 previously and
had the largest difference between assignments.
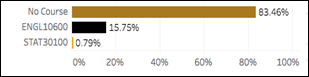
Figure
3
Percentage
of students who previously enrolled in IL course.
Figure
4
Citation
score difference of students who previously enrolled in IL course.
Ethnicity
In terms of ethnicity, 68.50% (87) of the students identified as white
and 8.66% (11) of the students identified as Asian or Asian American. In terms
of nationality, 7.87% (10) students were identified as International students
or non-domestically born. Nearly 10% of the students were identified as an
underrepresented minority, with 4.72% (6) Black/African American, 5.51% (7)
Latinx, and 5 (3.94%) that identified themselves as multiracial.
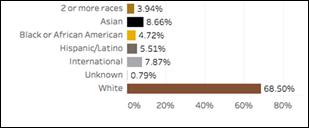
Figure
5
Ethnic
backgrounds of the students.
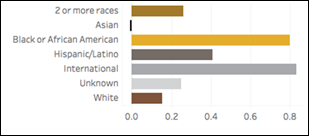
Figure
6
Citation
score difference by ethnic background.
First Generation Status
First-generation college students made up 20% (26) of
the sample. There were 101 students (79.53%) who reported that at least one
parent or both parents had attended a higher education institution.
Interestingly, the difference in IL performance was greater with non-first generation students than first-generation students.
That is, students who were exposed to family members who had a college
education had a greater performance gap than those who did not have a family
member who had attended college.
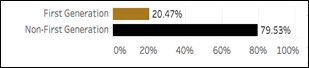
Figure
7
First
generation status of students.

Figure
8
Citation
score difference based on first generation status.
Gender Status
Only 24 students (18%) were female, while the remaining 81% were male.
The difference in IL performance was greater among male students than female
students.
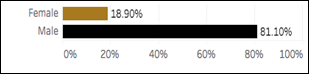
Figure
9
Gender
of the students.
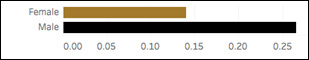
Figure
10
Citation
score difference by gender.
Legacy Status
A total of 63.78% (81) of the students were not the immediate family
members of university alumni. The remaining students had a parent, sibling, or
another relative that attended the university. Most students with relatives who
attended the university had a positive IL performance difference from
assignment 1 to assignment 3. However, students whose parents attended the
university had a negative IL performance difference, which means that they
actually did worse on the final assignment than the first assignment.
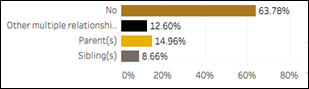
Figure
11
Legacy
status of the students.
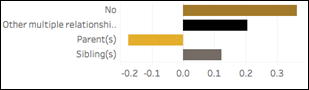
Figure 12
Citation score difference by legacy status.
Pell Grant Eligibility
Although 89 students were not eligible for the Pell Grant, 30% (38) of
students were eligible for the grant. Those who were eligible for a Pell Grant
had a greater IL difference, denoting a larger improvement from assignment 1 to
assignment 3.
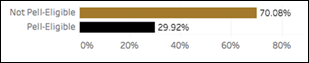
Figure
13
Pell
Grant eligibility by student.

Figure
14
Citation
score difference by Pell Grant eligibility status.
Underrepresented Minority Status
A significant majority of students, 87% (111), were not underrepresented
minorities. A count of 16 students identified as URM; 13% of students were
identified as Black/African American, Asian American, or Latinx. Based on the
ethnicity data, multi-racial students may also be grouped with underrepresented
minorities. This is unclear, but the data supports this as a possibility.
Students who were URM had a larger IL difference from assignment 1 to
assignment 3 than those who were non-URM.
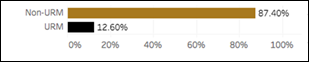
Figure
15
Underrepresented
Minority status.
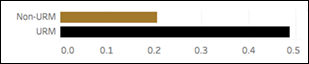
Figure
16
Citation
score difference by Underrepresented Minority status.
Information Literacy
Overall with all variables controlled, the average citation score for
all students was 2.289 on the first IL assignment, on a scale of 1 to 3, with
30 students scoring below 2. The overall average citation score on the second
assignment was 2.532, with 3 students (8.66%) scoring below 2. This suggests
growth in overall IL performance for the entire sample of 127 students from
assignment 1 to assignment 3.
Table 2
Average Citation
Score, cumulatively
|
|
Assignment #1 |
Assignment #3 |
|
Average IL Score |
2.289940031 |
2.532168551 |
Discussion
Diversity
Diversity within higher education can be defined along many variables; including,
but not limited to, gender, ethnicity, URM status, and economic contributions.
Research has shown that gender (Moss-Racusin, Dovidio, Brescoll, Graham, & Handelsman, 2012)) does
influence the performance of females in STEM. There are inherent and explicit
biases in the classroom that can dictate the success of a diverse group of
students (Greenwald & Krieger, 2006; Gregory, Skiba, & Noguera, 2010;
Hill, Corbett, & St Rose, 2010; Jacoby-Senghor, Sinclair, & Shelton,
2016; Staats, 2015).
According to the findings, there was a significantly negative correlation
between the IL performance of URM students and their course grade, suggesting
the grades of URMs decreased in relation to minority status. There were no
other significant correlations found between those variables identified as
pertaining to diversity, gender, and Pell grant eligibility. Our findings are
supported by the literature that URMs can perform more poorly academically in
certain settings. However, our study found no significant differences along
gender lines nor economic status.
Table 3
T-Tests Scores
Comparing URM Status, Gender, and Pell Grant Eligibility Status with IL
Performance
|
|
URM (Y=1) |
Gender (M=1) |
Pell-eligible (Y=1) |
|
IL 1 |
-0.093 |
-0.072 |
-0.062 |
|
IL 3 |
0.05 |
-0.017 |
0.004 |
|
Change in IL |
0.12 |
0.063 |
0.064 |
|
TECH
120 Grade |
-0.209* |
-0.087 |
-0.109 |
|
F14 Term GPA |
-0.127 |
-0.142 |
-0.1 |
*Statistically
significant at p<.05
Exposure
An important interest in the study was to find the influences of
pre-college and concurrent college experiences on the performance of IL related
assignments. One of those influences is exposure to formal IL instruction in
other courses. We ran Pearson’s correlations to determine the relationship
between exposure to concurrent and prior courses. There was a significantly
negative correlation between the performances on assignment 1 and being
concurrently enrolled in another IL course. That is, students who were in two
IL designated courses simultaneously performed poorer on assignment 1 than
those enrolled in the single course. Different IL topics, techniques, and
course elements could be the reason for the difference in performance.
Librarian involvement could also be a contributing factor, as IL is a
significant portion of the learning outcomes for the course and the librarian
was significantly involved with the course design of the studied course. It is
unknown whether a librarian was involved with the design of other courses.
Preparedness
College readiness can be an accurate measure of performance capability
at the college level. College readiness is often denoted with the academic
rigor of the courses offered and taken in high school (Roderick et al., 2011).
However, college readiness can also be attributed to exposure through social
networks like family and fellow students (Bui, 2002). We
found that there was a significant negative correlation between the IL
performance of first-generation students and their GPA during the term of the
study. That finding suggests that first-generation students perform less than
their counterparts both in IL performance and overall for the course and the
term studied. This is consistent with existing literature regarding the
performance of first-generation students, justifying the need for support
interventions. Interestingly, legacy students had a negative average change in
IL score, meaning that their IL scores decreased over the course of the
semester. High school was not a significant correlation, though considered as a
preparedness factor. Only those students who attended high schools in the same
state of the study were included.
Table 4
T-Test Scores
Comparing First-Generation Status, Legacy
Status, and High School Rank
|
First Generation (Y=1) |
Legacy
(Y=1) |
HS
Rank (n=79) |
|
|
IL 1 |
0.04 |
0.135 |
0.093 |
|
IL 3 |
0 |
-0.165 |
-0.072 |
|
Change
in IL |
-0.04 |
-0.224* |
-0.138 |
|
TECH
120 Grade |
-0.254** |
-0.06 |
-0.029 |
|
F14
Term GPA |
-0.185* |
-0.087 |
-0.011 |
*Statistically
significant at p<.05
**Statistically
significant at p<.01
Conclusion
Students within a single course are more diverse than the eye can see.
They have complicated upbringings and have followed different paths to arrive
in the college classroom. From this study, we investigated the diversity of the
backgrounds of the students and aspects of their social network contributions,
tangible and intangible. We learned that having concurrent or prior IL
instruction may compromise the integrity of the IL instruction that took place
in this course because students who took prior or concurrent IL courses did not
perform as well as those who had not. This contradicts the study done by Soria
et al. about the use of the library databases (2014). More research is needed to explore what happens when students take
more than one research heavy or IL related course, especially in their first or
second years. Perhaps further work can be done to understand why more IL
instruction did not lead to a stronger performance in this study. Additionally,
we learned that the impact of the URM and international experience on their
overall performance cannot be overlooked in the IL instructional setting.
International and URM students experienced lower IL performance gains. More IL
related research and inclusive IL instructional practices should be explored to
engage traditionally underserved students, like URM and international students.
Perhaps considerations should be made for lower-income students, in regard to
the use of technology and prior exposure to IL that may have been limited prior
to their university arrival. That is to say, we can question whether every
student has every app or cool new technology device to adequately engage with
some course materials. Similar considerations may apply to first-generation
students understanding the nuances of navigating the academic setting,
including IL instruction and course and library materials. This study
demonstrates that in some instances instructor assumptions may not be supported
by data, and we instructors should make efforts to understand and teach the
whole student with equity, not equality..
References
Association of American Colleges & Universities.
(2019). Information literacy VALUE rubric. Retrieved from https://www.aacu.org/value/rubrics/information-literacy
Bettinger, E. (2004). How financial aid affects persistence. In C. M. Hoxby (Ed.), College choices: The economics of where to
go, when to go, and how to pay for it. (pp. 207-238). Chicago, IL:
University of Chicago Press.
Bui, K. V. T. (2002). First-generation college
students at a four-year university: Background characteristics, reasons for
pursuing higher education, and first-year experiences. College Student
Journal, 36(1), 3-12.
Castleman, B. L., & Long, B. T. (2016). Looking
beyond enrollment: The causal effect of need-based grants on college access,
persistence, and graduation. Journal of Labor Economics, 34(4), 1023-1073.
https://doi.org/10.1086/686643
Fabbi, J. L. (2015). Fortifying the pipeline: a quantitative exploration of
high school factors impacting the information literacy of first-year college
students. College & Research Libraries, 76(1), 31-42. https://doi.org/10.5860/crl.76.1.31
Greenwald, A. G., & Krieger, L. H. (2006).
Implicit bias: Scientific foundations. California Law Review, 94(4),
945-967.
Gregory, A., Skiba, R. J., & Noguera,
P. A. (2010). The achievement gap and the discipline gap: Two sides of the same
coin? Educational Researcher, 39(1), 59-68. https://doi.org/10.3102/0013189X09357621
Hill, C., Corbett, C., & St. Rose, A. (2010). Why so few? Women in science, technology,
engineering, and mathematics. Washington, DC: American Association of
University Women.
Hubbard, L. (2005). The role of gender in academic
achievement. International Journal of Qualitative Studies in Education, 18(5),
605-623. https://doi.org/10.1080/09518390500224887
Huerta, J., & Watt, K. M. (2015). Examining the
college preparation and intermediate outcomes of college success of AVID
graduates enrolled in universities and community colleges. American
Secondary Education, 43(3), 20-35.
Jacoby-Senghor, D. S., Sinclair, S., & Shelton, J.
N. (2016). A lesson in bias: The relationship between implicit racial bias and
performance in pedagogical contexts. Journal of Experimental Social
Psychology, 63, 50-55. https://doi.org/10.1016/j.jesp.2015.10.010
Jaeger, P. T., Subramaniam, M. M., Jones, C. B., &
Bertot, J. C. (2011). Diversity and LIS education:
Inclusion and the age of information. Journal of Education for Library and
Information Science, 52(3), 166-183.
Lanning, S., & Mallek,
J. (2017). Factors influencing information literacy competency of college
students. The Journal of Academic Librarianship, 43(5), 443-450. https://doi.org/10.1016/j.acalib.2017.07.005
Loden, M., & Rosener, J.
B. (1991). Workforce America!: Managing employee
diversity as a vital resource. New York, NY: McGraw-Hill.
McCarron, G. P., & Inkelas,
K. K. (2006). The gap between educational aspirations and attainment for
first-generation college students and the role of parental involvement. Journal
of College Student Development, 47(5), 534-549. https://doi.org/10.1353/csd.2006.0059
Meriam Library, California State University-Chico.
(2010). Evaluating information – Applying the CRAAP test. Retrieved from https://library.csuchico.edu/sites/default/files/craap-test.pdf
Mestre, L. (2009). Culturally responsive instruction
for teacher-librarians. Teacher Librarian, 36(3), 8-12.
Mestre, L. (2010). Librarians serving diverse
populations: Challenges and opportunities. (ACRL publications in librarianship, 62). Chicago, IL: Association
of College & Research Libraries.
Milem, J. F., Chang, M. J., & Antonio, A. L. (2005). Making diversity
work on campus: A research-based perspective. Washington, DC: Association
of American Colleges and Universities.
Moss-Racusin, C. A.,
Dovidio, J. F., Brescoll, V. L., Graham, M. J., &
Handelsman, J. (2012). Science faculty’s subtle
gender biases favor male students. Proceedings of the National Academy of
Sciences, 109(41), 16474-16479. https://doi.org/10.1073/pnas.1211286109
Osa, J. O., Nyana, S. A., & Ogbaa, C. A. (2006). Effective cross-cultural communication
to enhance reference transactions: Training guidelines and tips. Knowledge
Quest, 35(2), 22-24.
Pike, G. R., & Kuh, G.
D. (2005). First- and second-generation college students: A comparison of their
engagement and intellectual development. The Journal of Higher Education, 76(3),
276-300. https://doi.org/10.1080/00221546.2005.11772283
Roderick, M., Coca, V., & Nagaoka, J. (2011).
Potholes on the road to college: High school effects in shaping urban students’
participation in college application, four-year college enrollment, and college
match. Sociology of Education, 84(3), 178-211. https://doi.org/10.1177/0038040711411280
Severiens, S., & ten Dam, G. (2012). Leaving college: A gender comparison in
male and female-dominated programs. Research in Higher Education, 53(4),
453-470.
https://doi.org/10.1007/s11162-011-9237-0
Soria, K. M., Fransen, J.,
& Nackerud, S. (2013). Library use and
undergraduate student outcomes: New evidence for students' retention and
academic success. portal: Libraries and the Academy, 13(2), 147-164. https://doi.org/10.1353/pla.2013.0010
Soria, K. M., Fransen, J.,
& Nackerud, S. (2014). Stacks, serials, search
engines, and students' success: First-year undergraduate students' library use,
academic achievement, and retention. The Journal of Academic Librarianship,
40(1), 84-91. https://doi.org/10.1016/j.acalib.2013.12.002
Staats, C. (2015). Understanding implicit bias: What educators should know. American Educator, 39(4), 29-44.
Retrieved from: https://eric.ed.gov/?id=EJ1086492
Stroud, D. I. (2017). A quantitative exploration of
the educational paths to completion taken by first generation college students
and students who have a parent with a four-year college degree (Doctoral dissertation, University of
Missouri--Kansas City). ProQuest Dissertations
and Theses Global, 1927182146.
Appendix
Rubric – Citation Analysis, based on CRAAP Test
Currency: The timeliness of the information
- How old is the
information and is that important for your topic?
- Does it report facts
from the actual time of the event or issue?
- Is it retrospective,
providing some review or analysis of previous research?
Relevancy: The importance of the information for your needs
·
Does the information relate
to your topic or answer your question?
·
Who is the intended
audience?
·
Is the information at an
appropriate level (i.e., not too elementary)?
·
Have you looked at a variety
of sources before determining the appropriateness of this source?
Authority: The source of the information
·
Who is the author/creator of
the information? Is it a person, group of people, an organization?
·
Is he/she the original
author/creator?
·
Is the person qualified?
What are his/her credentials? What is his/her occupation?
·
Is the source sponsored or
endorsed by an institution or organization?
·
Is there a potential for
bias?
Accuracy: The reliability, truthfulness, and correctness of the content
·
Is the bias of the
author/creator obvious? Is the source trying to convince you of a point of
view?
·
Where does the information
come from? Is it supported by evidence?
·
Is the publication in which
the item appears published, sponsored, or endorsed by a political or other
special interest group?
·
Does the language or tone
seem unbiased or free of emotion?
·
Are there typos, spelling
errors, or grammatical errors?
Purpose: The reason the information exists
- What is the intended purpose of the information: inform, teach,
sale?
- Is the information fact, opinion, propaganda?
- Does the point of view appear objective and impartial?
- Are there political, ideological, culture, religious, institutional
leanings presented?
Considerations for Evaluators Scale – low (1) to high (3)
Currency: Timeliness
1-
Not Acceptable: No date indicated, inappropriate,
obsolete, or outdated for paper topic/assignment
2-
Acceptable: Should be used with sources from other
dates
3-
Completely Appropriate: Most timely for paper
topic/assignment
Relevancy: Importance of the
information to the topic/assignment
1-
Not At All Relevant/Partially
Relevant to Topic: show to minimal understanding of the relation between the
source and the paper topic/assignment; not appropriate for academic level &
audience
2-
Relevant to topic: Information relates to the topic;
shows some understanding of the relation between the source and the paper
topic/assignment; fairly appropriate for academic level & audience
3-
Completely Relevant: Information relates to the topic;
clear relation between the source and the paper topic/assignment; appropriate
for academic level & audience
Authority/Accuracy: Source
of the information
1-
Not Accurate/No Authority: Unedited/Unverifiable; no
to little accountability of the author; no author identified, potentially
biased
2-
Some Accuracy/Some Authority: Popular or unscholarly
source; demonstrates some understanding of the information
3-
Authoritative/Accurate: verifiable content, demonstrate
thorough understanding of the information, scholarly source
Purpose: Reason the
Information Exists (inform, sell, persuade)
1-
No Understanding/Minimal Understanding of the purpose
of the information
2-
Adequate understanding of the purpose of the information
3-
Expert understanding of the purpose of the source
understanding difference between fact and opinion; recognizing bias or
misinformation