Research Article
Assessment of Multilingual Collections in Public Libraries: A Case Study of the Toronto Public Library
Valentina Ly
Research Assistant
Mount Sinai Hospital
Toronto, Ontario, Canada
Email: vly@ualberta.ca
Received: 8 Feb. 2018 Accepted: 24 July 2018
![]() 2018 Ly. This is an Open
Access article distributed under the terms of the Creative Commons‐Attribution‐Noncommercial‐Share
Alike License 4.0 International (http://creativecommons.org/licenses/by-nc-sa/4.0/),
which permits unrestricted use, distribution, and reproduction in any medium,
provided the original work is properly attributed, not used for commercial
purposes, and, if transformed, the resulting work is redistributed under the
same or similar license to this one.
2018 Ly. This is an Open
Access article distributed under the terms of the Creative Commons‐Attribution‐Noncommercial‐Share
Alike License 4.0 International (http://creativecommons.org/licenses/by-nc-sa/4.0/),
which permits unrestricted use, distribution, and reproduction in any medium,
provided the original work is properly attributed, not used for commercial
purposes, and, if transformed, the resulting work is redistributed under the
same or similar license to this one.
DOI: 10.18438/eblip29408
Abstract
Objective – The Toronto Public Library has been frequently identified as having an exemplary multilingual collection to serve the information needs of the most diverse population in Canada; however, there is no evidence or collection assessment information available in the literature to validate those claims. This research sought to gain an understanding of the current state of their multilingual collection and compare it to the most recent multicultural population demographics.
Methods – This was a case study of the Toronto Public Library multilingual collection using data collected from their online public access catalogue in November 2017. Data was collected about all languages available, with English, French, and the 17 most spoken mother tongues explored in more detail. Language results from the Statistics Canada 2016 Census of Population were also collected. Data was used to calculate and compare the English, French, and language collections to the population of reported mother tongues spoken in Toronto.
Results – It was found that the Toronto Public Library has items in 307 languages. While the collection comprises many languages, there is far more focus on official language items than any other language compared to the population in terms of number of items and variety of formats. All 17 non-official languages that were studied had fewer items proportionally available in the catalogue than the proportion of speakers with that mother tongue.
Conclusion – The high circulation rates of the Toronto Public Library’s multilingual collection indicate that it has had some success in meeting the needs of its community. However, as the largest library system in Canada with a highly regarded multilingual collection and with many resources for collection development, the Toronto Public Library falls short of having a language collection that is proportional to the languages spoken within the community. While it may not be possible to have a multilingual collection that is entirely representative of the community, this study shows that libraries can use census data to monitor population shifts in order to be responsive to the information needs of their changing communities.
Introduction
Public libraries are institutions that serve the community’s information needs, regardless of language barriers. It is vital for libraries to reflect the full range of community diversity, which is often delivered through multilingual (ML) services such as collection items in non-official languages (Chilana, 2001; Rodrigues, Jacobs, & Cloete, 2006). Language is a major part of a person’s identity and sense of belonging. When a library serves a linguistic minority, it shows consideration and respect for that language in the community, resulting in improved relationships between the library and that group. The provision of these materials also allows the group to preserve their mother tongue and cultural diversity, and stay connected to their roots while they settle into life in a new country (Atlestam, Brunnström, & Myhre, 2011; Bezugloff, 1980; Picco, 2008; Tanackovic, Lacovic, & Stanarevic, 2012). However, the variation in community demographics makes it difficult to prescribe a one size fits all solution for how each public library should meet those needs. What makes it more challenging is that many communities are constantly changing due to migration and globalization, but it is imperative for public libraries to be aware of these changes in demographics and act accordingly.
In a survey of public libraries across Canada, Dilevko and Dali (2002) found that many libraries reported that their ML collections are underused. As such, there is mixed response about the direction that public librarians want to take their ML collection, especially when there is a requirement for them to justify the development of ML collections (Chilana, 2001; Dilevko & Dali, 2002). While collections should be representative of the linguistic diversity of the community, it is not necessarily feasible for public libraries to build a perfect ML collection (Atlestam et al., 2011). The Toronto Public Library (TPL) has reported high circulation of their ML materials and has been lauded for how they build their ML collection (Oder, 2003; Rogers, 2003; Sathi, Ngan, & Debenham, 2016). As suggested by Godin (1994), smaller libraries can learn from larger libraries that have the resources to focus on ML collection development. This case study of the TPL ML collection sought to reveal how representative the collection is of the immigrant population and demonstrate how ML collections can be developed in practice.
Literature Review
The ML collection is often the first service libraries start with when developing services that cater to immigrant populations (Hoyer, 2011). Early in public library service, there was some evidence of collection development of non-English items. As migration and movement of populations became common, more libraries began to include materials in other languages to meet demand (Bezugloff, 1980). The National Library of Canada used to maintain the Multilingual Biblioservice so that public libraries could offer their community books in non-official languages without having to develop the service themselves. Towards the end of the twentieth century there was a push for ML collections with nationwide efforts and guidelines, but there have been fewer updates in the last decade (Godin, 1994; International Federation of Library Associations and Institutions, 2009; Library and Archives Canada, 2005; Reference and User Services Association, 2007).
Many varieties of ML collections assessments have been explored globally to determine the breadth and depth of the collection, and it has been consistently found that public libraries are not providing equitable service to linguistic minorities (Berger, 2002; Hansson, 2011; Picco, 2008; Rodrigues et al., 2006). Some of these studies are based on user information collected through focus groups and questionnaires and others are based on evaluating the collection, circulation statistics, or presence of key titles. Overall, researchers have found that the official language of the country is the dominant language collected at a library. In Canada, the official languages are English and French, however, the majority of Canadians speak English.
A library collection consists of a variety of formats and the same should apply to the ML collection as well. Official guidelines and recommendations for ML collections stress the need to have print and other media formats (IFLA, 2009; Library and Archives Canada, 2005; Reference and User Services Association, 2007). The study of collection formats is an important part of ML collection assessment (Chilana, 2001; Dilevko & Dali, 2002; Rodrigues et al., 2006). Online formats are also important as more libraries begin to deliver digital content. The internet is a major gateway to ML information, with many foreign newspapers accessed through this route (Atlestam et al., 2011; Berger, 2002; Dilevko & Dali, 2002; Tanackovic et al., 2012).
A community profile or needs assessment is an important step to knowing who a library’s users are and applying that information to build library services. Authorities on library services suggest that this process can take many forms, but the simplest and most accessible method for a public library to find its population demographics is to use national census results (Library and Archives Canada, 2005; Reference and User Services Association, 2007). Although these results may not provide information about community needs, they can provide information about immigration, distribution within an area, and languages spoken by residents. Most assessments of ML collections include this type of demographic information as a measure of the population (Atlestam et al., 2011; Dilevko & Dali, 2002; Garrison, 2013; Hoyer, 2011; Rodrigues, 2006). Libraries that have not utilized a community profile, such as census results, also have been found to have very imbalanced ML collections (Hansson, 2011; Hoyer, 2011; Rodrigues, 2006).
As Canada’s largest and most multicultural city, Toronto plays a significant role in receiving immigrants to Canada (Kumaran & Salt, 2010; Quirke, 2007). In 2016, 47.03% of Torontonians were immigrants, with 6.98% of those immigrants having come within the past five years (Statistics Canada, 2017). Soon after arrival, many newcomers to Toronto seek out memberships to the TPL, with double the usage by immigrants compared to those born in Canada, which correlates with other immigrant library usage studies (Berger, 2002; Dali, 2016; Oder, 2003; Quirke, 2007). TPL has been noted for rising to the challenge of serving the most linguistically diverse population through continued investment in newcomer programming, particularly for their responsive building of ML collections and devotion to its development for the past few decades (Dilevko & Dali, 2002; Quirke, 2007; Rogers, 2003; Zielinska, 1980). As such, the TPL can be used as an exemplar for other public libraries since many have noticed its influence, compared to any other Canadian public library (Kumaran & Salt, 2010; Rogers, 2003; Zielinska, 1980).
While the TPL may be known for actively collecting and curating their ML collection for the large immigrant population, only the broader picture of delivering ML services and programs is addressed. Other Canadian public libraries have been evaluated for their linguistic diversity; for example, Picco (2008) determined that the items at three Montreal libraries do not reflect the diversity of the population. However, there are no similar studies of the TPL, and there is a need to quantify its ML collections. Many may want to model after the TPL ML collection, but there is no collection assessment information available. This TPL ML collection assessment will allow for comparative analytics across public libraries in Canada through the collection count process.
Aims
The purpose of this case study is to determine how well the TPL ML collection development reflects the diversity of languages spoken by the community. The following four research questions were posed:
· How many different language collections are available at the library?
· How many items are available in each language collection?
· What formats are available in each language collection?
· Is the size of each language collection equitable to the size of the minority language community?
Method
Using Statistics Canada’s (2017) 2016 census profile, the Toronto census division map was aligned with the TPL branch map and locations to confirm that they are contained within the same geographic boundary. This confirmed that the demographics for that census division are relevant to the TPL system.
From the census demographics, data from “mother tongue” and “language spoken most often at home” was collected and arranged based on the number of respondents. When ranked, the spoken mother tongues and the languages spoken most often at home did not correspond in ranking or proportions of the population; however, the top 18 languages listed in both categories were the same. These 18 most commonly spoken languages were selected: Cantonese, Mandarin, Tagalog, Spanish, Italian, Portuguese, Tamil, Persian, Urdu, Russian, Korean, Arabic, Bengali, Greek, Gujarati, Polish, Vietnamese, and Punjabi. These languages were also listed in TPL’s ML collection directory, as part of the languages that they actively collect and advertise (TPL, 2018). These languages correspond to searchable languages in the TPL (2017) online public access catalogue (OPAC), except that only “Chinese” can be selected on the TPL catalogue, rather than Mandarin and Cantonese individually. The census value for “Chinese languages” was used in lieu, which includes Cantonese, Mandarin, Hakka, Min Dong, Min Nan, Wu, Chinese not otherwise specified, and Chinese not listed elsewhere (Statistics Canada, 2017). Therefore, 17 non-official languages were explored, as well as the official languages of Canada, which are French and English.
Using the TPL OPAC on November 12, 2017, the total number of items available in every language was collected, as well as the number of items in each of the formats of the selected 17 languages and in English and French. Next, the proportions of mother tongue language groups, library items, and formats were analyzed and compared. Calculations for the number of items per capita were determined, but altered to consist of the number of items for a specific language and the number of people who speak it.
Results
Language Collection at TPL
Through the advanced search in the TPL OPAC, 362 language categories were available for selection at the time of data collection. Of those, there were 307 language categories (including English and French) that had at least one item in the collection. However, this includes languages that are not spoken in modern society or that are not considered as one of the 215 languages that are quantified by Statistics Canada. Figure 1 displays the languages and number of items available from TPL for non-official languages that had more than 100 items catalogued. There were 229 non-official language categories that have not been included since they had 100 items or less.

Figure 1
The number of items in each TPL non-official language collection that contains more than 100 items.
Table 1
Number of Non-Official Language Collections within Each Item Range
|
Number of items in language collection |
Non-official language collection |
|
1-9 |
156 |
|
10-99 |
72 |
|
100-999 |
37 |
|
1,000-9,999 |
34 |
|
10,000+ |
6 |
In total, TPL had 2,234,867 items listed in their OPAC. Of that, there were 1,849,095 English items and 130,377 French items. The remaining 255,395 items were split up amongst 305 languages. Table 1 presents the number of items in all the non-official TPL language collections that fit within the designated item ranges. There are six non-official languages that had 10,000 or more items, 34 languages that had 1,000-9,999 items, 37 languages that had 100-999 items, 72 languages with 10-99 items, and 156 languages with 1-9 items. This shows that most of the languages collected by the TPL comprised very few items, while few languages had substantial collection sizes.
Collection Representation
Further investigation of non-official languages was limited to the top 17 mother tongues in Toronto. Table 2 presents the proportion of items listed in these languages and the proportion of people in Toronto that speak that mother tongue. All TPL items considered, 1,849,095 items (82.74%) in the collection were in English, 130,777 (5.83%) items were in French, and 255,395 (11.43%) items were in a non-official language. Table 2 reveals a portion of the distribution of non-official languages.
Based on the Toronto census 2016 results, out of the total 2,704,415 responses, there were 1,375,905 (50.88%) people who said their mother tongue is English, and 35,440 (1.31%) indicated that French is their mother tongue. Comparatively, 1,186,885 (43.89%) of the population had a mother tongue that is not considered an official language of Canada. The remainder of respondents listed multiple mother tongue languages. Despite the high number of Toronto residents reporting a non-official language native tongue, fewer people primarily spoke these languages at home. With the exception of English, the study languages dropped by 26% to 58% in usage at home (Statistics Canada, 2017).
A common collection assessment calculation is items per capita. Figure 2 displays the language items per mother tongue speaker, which is the item number available in that language, divided by the number of respondents with that mother tongue. The mean item per mother tongue speaker was 0.17 items per capita, with a standard deviation of 0.11. Of the 17 study languages, Tagalog was the most underrepresented at 0.03 items per Tagalog speaker, while Polish had the largest rate of the non-official study languages at 0.50 items per speaker. English speakers had a very large collection with 1.43 items per speaker, but it was the French language that far surpassed that at 3.68 items per speaker.
Similarly, Figure 3 presents the items per capita based on the number of respondents that indicated that that language was spoken most often at home. Since there were fewer people speaking languages other than English at home, the items per capita value was higher compared to Figure 2, with a mean of 0.31 items per capita and a standard deviation of 0.25. Again, French language items per capita were far more represented than any other language. Interestingly, there were 1.18 Polish items per capita, compared to the 1.13 English items per capita.
Table 2
Proportion of Language Collection Items in Comparison to the Population
|
Languages |
Proportion of collection |
Proportion of mother tongue speakers |
Proportion of languages spoken most often at home |
|
English |
82.74% |
50.88% |
64.33% |
|
French |
5.83% |
1.31% |
0.63% |
|
Chinese |
1.41% |
9.07% |
6.70% |
|
Spanish |
0.86% |
2.69% |
1.54% |
|
Italian |
0.71% |
2.32% |
1.00% |
|
Polish |
0.56% |
0.93% |
0.39% |
|
Russian |
0.48% |
1.34% |
0.85% |
|
Portuguese |
0.30% |
2.20% |
1.24% |
|
Tamil |
0.30% |
2.13% |
1.55% |
|
Korean |
0.23% |
1.25% |
0.87% |
|
Gujarati |
0.21% |
0.98% |
0.61% |
|
Greek |
0.20% |
1.03% |
0.48% |
|
Urdu |
0.20% |
1.38% |
0.87% |
|
Punjabi |
0.18% |
0.74% |
0.45% |
|
Persian |
0.17% |
1.82% |
1.23% |
|
Bengali |
0.17% |
1.05% |
0.70% |
|
Vietnamese |
0.15% |
0.92% |
0.63% |
|
Arabic |
0.14% |
1.10% |
0.61% |
|
Tagalog |
0.12% |
3.08% |
1.57% |
|
Total |
94.96% |
86.22% |
86.25% |
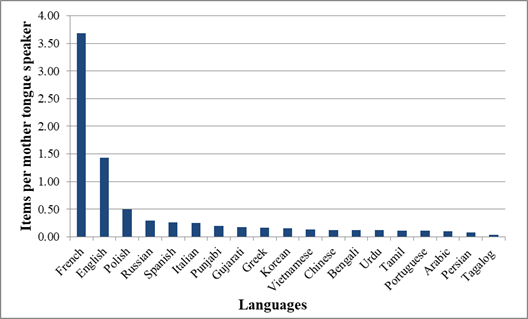
Figure 2
Items per capita for each mother tongue language group.

Figure 3
Items per capita for each language group spoken most often at home.
Available Formats
Table 3 shows that out of the possible 32 formats listed by the TPL OPAC, French had items in 29 formats and English had items available in 31 formats, which was the largest format variety. For the 17 study languages, there was a mean of 15.53 formats, standard deviation of 5.35, and a range of 8 to 26 formats.
Table 4 presents the formats available at TPL and the proportion of the collection for each format. From the 17 language collections explored in this study, 71.40% of these items were catalogued as regular print books; however, this ranged from 40.47% to 88.15%. In comparison, 64.85% of official language items (71.54% French and 64.41% English) were catalogued as regular print books. Some items had very few items present within format types; however, DVDs and music CDs were categories that consistently had several items available in each language, especially for the 17 non-official languages.
Table 3
Number of Format Types Available in Each Language
|
Languages |
Format types |
|
English |
31 |
|
French |
29 |
|
Italian |
26 |
|
Spanish |
25 |
|
Portuguese |
20 |
|
Chinese |
19 |
|
Korean |
19 |
|
Russian |
18 |
|
Arabic |
16 |
|
Greek |
16 |
|
Polish |
16 |
|
Persian |
15 |
|
Urdu |
14 |
|
Vietnamese |
13 |
|
Tamil |
12 |
|
Bengali |
10 |
|
Tagalog |
9 |
|
Gujarati |
8 |
|
Punjabi |
8 |
Table 4
Distribution of Language Collections in Each Format Type
|
Physical formats |
Study non-official languages |
French |
English |
|
Regular print books |
71.41% |
71.54% |
64.41% |
|
Large print books |
0.05% |
0.16% |
1.05% |
|
Multimedia kits |
0.12% |
0.01% |
0.01% |
|
Braille books |
0.03% |
0.02% |
0.01% |
|
Tactile books |
0.02% |
0.02% |
0.00% |
|
Cloth books |
0.01% |
0.00% |
0.00% |
|
Images |
0.01% |
0.06% |
5.07% |
|
DVDs |
8.02% |
2.11% |
1.60% |
|
VHS |
0.02% |
0.01% |
0.06% |
|
Music CDs |
9.69% |
1.91% |
1.19% |
|
Vinyl |
0.49% |
0.29% |
0.06% |
|
Cassettes |
0.00% |
0.00% |
0.00% |
|
Sheet music |
0.66% |
0.65% |
0.39% |
|
Pictures and photographs |
0.00% |
0.01% |
4.97% |
|
Image Maps |
0.01% |
0.03% |
0.02% |
|
Posters and printed ephemera |
0.00% |
0.02% |
0.07% |
|
Photo Albums |
0.00% |
0.00% |
0.00% |
|
Audiobook cassettes |
0.04% |
0.04% |
0.03% |
|
Audiobook CDs |
0.77% |
0.72% |
0.68% |
|
Talking Books |
0.00% |
0.00% |
0.63% |
|
Magazines, newspapers, and journals |
0.40% |
1.25% |
1.78% |
|
Microforms |
0.12% |
15.78% |
4.55% |
|
Atlases |
0.00% |
0.00% |
0.00% |
|
Maps |
0.10% |
0.13% |
0.16% |
|
Computer disks |
0.01% |
0.01% |
0.06% |
|
Digital formats |
|||
|
eBooks |
1.00% |
3.10% |
9.22% |
|
eAudiobooks |
0.10% |
0.03% |
1.42% |
|
eMusic |
4.31% |
1.44% |
0.73% |
|
eVideo |
0.43% |
0.20% |
0.66% |
|
eJournals |
2.12% |
0.44% |
1.13% |
|
Databases and online tools |
0.02% |
0.01% |
0.00% |
|
Downloadable magazines |
0.05% |
0.02% |
0.02% |
|
Total |
100% |
100% |
100% |
As collections are shifting towards electronic availability, it is important to determine whether non-official languages are being collected in digital formats as well. These would be items that are catalogued as an eBook, eAudiobook, eMusic, eJournal, eVideo, database and online tool, or downloadable magazine in Table 4. From the 17 language collections explored in this study, 8.04% of the total items were available in an electronic format. In comparison, 12.69% of official language items (5.22% French and 13.19% English) were digital content.
Discussion
The TPL can potentially serve as a model library for other institutions through their ML collection development strategies. In their article, Kumaran and Salt (2010) concluded that compared to other large, urban library systems, TPL was the most dedicated to their diverse community based on their non-English services and community partnerships. Nevertheless, the results of this study reveal that at the time of data collection the TPL ML collection was far from proportional in representation to the population. Further explorations of these results reveal the many challenges that exist with ML collection development.
Some might assume that if the library is responding to community demographics, then there should be equitable representation of the linguistic diversity in the collection as there is in the population (Rodrigues et al., 2006). However, that is not the case with the TPL, nor of any ML collection assessment in the literature so far. Older ML collection development models recommend having equitable and fair services per capita if there are 300 or more minority language speakers within a community (Godin, 1994). The Reference and User Services Association’s (1990) “Guidelines for Multilingual Materials Collection and Development and Library Services” echo that statement, relating the size of the collection to the size of the group; however, the updated 2007 “Guidelines for the Development and Promotion of Multilingual Collections and Services” version removes that wording from their guidelines. While it is important to compare the language collection to the population that speaks that language, there is a move away from what a “balanced” collection may refer to; rather, the goal of collection development is about meeting the needs of the user groups within the given constraints (Dali, 2010; Kumaran & Salt, 2010).
TPL has the added challenge of collecting for the most linguistically diverse population in Canada, let alone North America. The Toronto 2016 census results reveal that while there are many people with a non-official language mother tongue, there are fewer people indicating that this is the language spoken most often at home. There were 64.96% respondents who noted they speak an official language at home, whereas 25.95% said that the primary language spoken at home was a non-official language, and 8.85% said that they equally speak an official and a non-official language at home (Statistics Canada, 2017). While a large portion of the Toronto population was born outside of Canada and grew up with a different mother tongue, English still seems to be the dominant speaking language, which may explain why it is TPL’s main budgetary and developmental focus. In addition, Dilevko and Dali (2002) point out that in 2001 the TPL was allocating 12% of their book budget for the French and ML collection, which is far below the proportion of the community that that budget was meant to serve.For more detailed analysis in this study, only the most commonly spoken mother tongues in Toronto were explored. Large disparities were revealed in Table 2 between the proportions of the TPL ML collection compared to the population in Toronto speaking that language. Although the TPL has actively funded and built their ML collection over the years, Toronto’s 17 most spoken mother tongues and languages spoken most often at home are not as highly represented in the collection compared to the official languages of Canada. Since the study languages were not randomly selected, the 17 languages are more likely to be better represented than a random sample of the ML collections because these languages have a larger population of speakers and more representation in the community. Also, the 17 study languages are part of the 40 languages that the TPL actively collects (Oder, 2003; Rogers, 2003). The results from this study may over-represent the state of the total ML collection. However, Zielinska (1980) recommends looking at the more popular languages for ML collection building, so analysis of the most popular languages may make sense for libraries with less diverse communities.
According to Figure 2, of the non-official languages, Polish speakers have the most selection of library items in their language, while Tagalog speakers had the least available selection. This imbalance between individual language collections may be due to migration changes and library response time. The Polish are a more settled population in the community compared to immigrants from the Philippines. According to the 1996 census, there was a burst of immigrants from Poland in Toronto (Statistics Canada, 1997). More recently, immigrants from the Philippines living in Toronto have increased by 15.86% between 2011 and 2016, while Polish immigrant populations have dropped by 11.93% (Statistics Canada, 2013, 2017). Within the span of five years between census collections, that is a significant change in population demographics, whereas collection changes happen at a slower pace. Although the TPL relies on information from settlement workers, supplemented with census data to stay up to date on population shifts, the TPL and other libraries face difficulty when collecting for newer immigrant populations, especially those that have been affected by international events like wars. This is an issue since these groups have a need for information in their languages, they may not have any knowledge of English or French, and fewer materials in their language may be available (Bowles, 2016; Quirke, 2007; Rodrigues et al., 2006; Rogers, 2003).
Based on ML collection assessment trends in which the dominant spoken language of the country is the one that is heavily collected, it is surprising to see in Figure 2 that the French collection has the most items per capita. This far surpasses the rate for any other language, including English. This may be due to the fact that although there are few people who have French as a mother tongue, it is a protected language in Canada and supported in government and school systems (Mougeon, 2015). Furthermore, there may be more ease in locating French resources compared to other non-English materials (Rogers, 2003). Dilevko and Dali (2002) note that the ML budget at TPL includes money to be spent on French resources as well, so most of the ML budget could be spent on developing French over the other non-English languages.
Based on the results, English and French collection users have had the most variety of formats available to them. Considering this study investigated the most popular non-official languages, there were significantly fewer formats to choose from in those study languages. Across all languages, the collections in this study consisted mostly of regular print books, which IFLA (2009) states is the most likely format available in ML collections. Non-English languages had fewer digital resources available for its language groups. TPL has cited the difficulty of locating databases in languages other than English, which may be the issue for other digital resources as well. As a way of combatting this issue, TPL has built their own internet subject gateway to newspapers worldwide; however, this was not considered as part of the ML collection in the TPL OPAC (Rogers, 2003).
Besides print books, DVDs and music CDs were abundant in foreign languages compared to its availability in English and French. This vast ML DVD collection may be due to the previously high circulation rates and demand of foreign DVDs at TPL, which contributed to the overall high circulation of the ML collection (Bowles, 2016). This fits with Garrison’s (2013) findings that some libraries may build their collection with more emphasis on circulation rather than on equitable service. Recently, there have been fewer DVD loans, which has negatively impacted the ML collection circulation, with a decline of 12.6% in the past year. The TPL attributes the drop in DVD loans to the ease of online streaming services and to certain language minority groups moving out of the TPL service area (Bowles, 2016).
Certain TPL staff who speak another language are in charge of that language collection in terms of selecting items and connecting with vendors (Oder, 2003; Rogers, 2003). However, the ML collection selection process takes place on a branch level, with only the local residents’ needs in mind (Martin Prosperity Institute, 2013). Some of the variation of the ML collection stock could be due to that branch-level selection and having individual employees independently focused on one language. Over time, this could result in an imbalance of collection development since individual purchasers may not reflect on the balance of the whole collection. Investigation of the ML collection on a branch level may reveal that the collection is more balanced to each catchment area than it does when explored as a whole.
Many libraries cite the challenge of building ML collections due to lack of staff knowledge of other languages. Libraries struggling to develop and catalogue their ML collections can learn from other library systems that share their expertise and knowledge, one of which is the TPL. Rogers’ (2003) article reveals that even librarians from large metropolitan cities such as the Seattle Public Library reach out to other library systems, including the TPL, to better inform their collection building processes. Kumaran and Salt (2010) also highlighted the partnerships between the TPL and organizations that directly deal with immigrant populations to better cater their services to different language speakers. Furthermore, Rogers (2003) noted that the TPL has excelled in locating ML vendors and have staff who speak 34 of the 40 active language collections, so the TPL should face fewer challenges than other library systems.
Conclusion
While the official languages are important collections to focus on, in Toronto there were 4.91% of residents who have no knowledge of either official language at the time of this study. They will face a much more difficult experience accessing information if the public library does not develop collections or build services to meet their information needs (Statistics Canada, 2017). Circulation of ML materials in 2015 made up 7.7% of total TPL circulations, showing that there was a need for those materials (Bowles, 2016; Sathi et al., 2016).
There is a difference between proportions of the population of foreign language speakers in Toronto and the items available in those languages at the TPL. Of the 17 non-official languages that were studied in November 2017, all were underrepresented in the collection. Given the constraints of collecting in other languages, it should not be expected that public libraries have completely representative ML collections. However, libraries can use census data to monitor the population and migration patterns in their local communities and strive to collect an adequate number of items to satisfy the information needs of those who speak other languages besides English and French.
This study has a few limitations. Of note, this study investigates items listed in the TPL OPAC. The item numbers used represent the number of unique items, not copies of each item, so may not be completely representative of the actual selection available at TPL. Errors can also arise through the way items are catalogued. Furthermore, the study does not consider the currency or quality of the ML items, which should be a major consideration of any collection assessment.
Libraries may be unsure of how to meet the linguistic needs of their growing and changing communities. Due to the number of resources needed to build ML library collections, librarians are reaching out to other library systems to better inform their collection building practices. As Toronto has been acknowledged as a diverse city and the TPL has a reputation for their ML collection development, it may be more feasible for public libraries to follow the example of the TPL ML collection, rather than to pursue an equally representative collection.
Acknowledgments
The author thanks Tami Oliphant for guidance and proofreading.
References
Atlestam, I., Brunnström, A.-C., & Myhre, R. (2011). Collection development for immigrants - What to purchase, and why? Findings in Gothenburg, Sweden. IFLA Journal, 37(1), 69-79. https://doi.org/10.1177/0340035210397308
Berger, Å. (2002). Recent trends in library services for ethnic minorities – The Danish experience. Library Management, 23(1/2), 79-87. https://doi.org/10.1108/01435120210413878
Bezugloff, N. B. (1980). Library services to non-English-language ethnic minorities in the United States. Library Trends, 29(2), 259-274.
Bowles, V. (2016, Apr.). 2015 annual performance measures and benchmarking. Toronto Public Library. Retrieved from http://www.torontopubliclibrary.ca/content/about-the-library/pdfs/board/meetings/2016/apr25/15-2015-annual-performance-measures-and-benchmarking.pdf
Chilana, R. (2001). Delivering multilingual services in public libraries in British Columbia: A case study of the Fraser Valley Regional Library. PNLA Quarterly, 65(3), 18-20.
Dali, K. (2010). Readers’ advisory interactions with immigrant readers. New Library World, 111(5/6), 213-222. https://doi.org/10.1108/03074801011044089
Dali, K. (2016). Readers’ histories as a way of studying and understanding multicultural library communities. Library Review, 65(8/9), 519-534. https://doi.org/10.1108/lr-04-2016-0035
Dilevko, J., & Dali, K. (2002). The challenge of building multilingual collections in Canadian public libraries. Library Resources & Technical Services, 46(4), 116-137.
https://doi.org/10.5860/lrts.46n4.116
Garrison, K. L. (2013, Aug.). “This intense desire to know the world”: Cultural competency as a personal and professional disposition in collection development practices. Paper presented at the meeting of IFLA World Library and Information Congress: 79th IFLA General Conference and Assembly, Singapore. Retrieved from http://library.ifla.org/66/1/101-garrison-en.pdf
Godin, J. (Ed.). (1994). A world of information: Creating multicultural collections and programs in Canadian public libraries. Library and Archives Canada. Retrieved from
http://www.nlc-bnc.ca/obj/005007/f2/005007-210.1-e.pdf
Hansson, J. (2011). Public libraries and the national minorities of Sweden – Results of a national survey. New Library World, 112(9/10), 406-415. https://doi.org/10.1108/03074801111182003
Hoyer, J. (2011). Reshaping to serve evolving communities: Addressing immigrant needs in the library. Journal of Organisational Transformation & Social Change, 8(3), 297-312. https://doi.org/10.1386/jots.8.3.297_1
International Federation of Library Associations and Institutions [IFLA]. (2009). Multicultural communities: Guidelines for library services (3rd ed.). Retrieved from https://www.ifla.org/files/assets/library-services-to-multicultural-populations/publications/multicultural-communities-en.pdf
Kumaran, M., & Salt, L. (2010). Diverse populations in Saskatchewan: The challenges of reaching them. Partnership: The Canadian Journal of Library & Information Practice & Research, 5(1), 1-25. https://doi.org/10.21083/partnership.v5i1.1012
Library and Archives Canada. (2005). Multicultural resources and services toolkit. Retrieved from https://www.collectionscanada.gc.ca/obj/005007/f2/005007-300.1-e.pdf
Martin Prosperity Institute. (2013, Dec.). So much more: The economic impact of the Toronto Public Library on the city of Toronto. Retrieved from http://www.torontopubliclibrary.ca/content/about-the-library/pdfs/board/meetings/2013/dec09/10_1.pdf
Mougeon, R. (2015). French language in Canada. In The Canadian Encyclopedia. Retrieved from http://thecanadianencyclopedia.ca/en/article/french-language/
Oder, N. (2003). Growing into a changing city. Library Journal, 128(10), 40-42.
Picco, M. A. P. (2008). Multicultural libraries' services and social integration: The case of public libraries in Montreal Canada. Public Library Quarterly, 27(1), 41-56. https://doi.org/10.1080/01616840802122443
Quirke, L. C. (2007). More than books: Examining the settlement services of the Toronto and Windsor public libraries. Our Diverse Cities, 4, 156-160.
Reference and User Services Association. (1990). Guidelines for multilingual materials collection and development and library services. Retrieved from http://www.ala.org/rusa/sections/rss/rsssection/rsscomm/spanishspeaking/guidelinesmultilingual
Reference and User Services Association. (2007). Guidelines for the development and promotion of multilingual collections and services. Reference & User Services Quarterly, 47(2), 194-197. https://doi.org/10.5860/rusq.47n2.198
Rodrigues, A. (2006). Serving culturally diverse communities in South African public libraries. Libri, 56(4), 213-226. https://doi.org/10.1515/libr.2006.213
Rodrigues, A., Jacobs, L., & Cloete, L. (2006). Providing equitable public library services to South Africa's multicultural communities. Mousaion, 24(2), 211-231.
Rogers, M. (2003). Serving up world languages. Library Journal, 128(11), 42-44.
Sathi, S., Ngan, E., & Debenham, S. (2016, Jan.). Building responsive multilingual collections at Toronto Public Library [PowerPoint slides]. Paper presented at the Ontario Library Association Super Conference, Toronto. Retrieved from http://accessola2.com/superconference2016/sessions/1200SER%20F.pdf
Statistics Canada. (1997, November 4). 1996 Census: Immigration and citizenship. The Daily. Retrieved from http://www.statcan.gc.ca/daily-quotidien/971104/dq971104-eng.htm
Statistics Canada. (2013). NHS Profile, Toronto, C, Ontario, 2011. (Statistics Canada Catalogue no. 99-004-XWE). Retrieved from
http://www12.statcan.gc.ca/nhs-enm/2011/dp-pd/prof/index.cfm?Lang=E
Statistics Canada. (2017). Census profile, 2016 census: Toronto, CDR [Census division], Ontario and Ontario [Province]. (Statistics Canada Catalogue no. 98-316-X2016001). Retrieved from http://www12.statcan.gc.ca/census-recensement/2016/dp-pd/prof/index.cfm?Lang=E
Tanackovic, S. F., Lacovic, D., & Stanarevic, S. (2012). Public libraries and linguistic diversity: A small scale study on the Slovak ethnic minority in eastern Croatia. Libri, 62(1), 52-66. https://doi.org/10.1515/libri-2012-0004
Toronto Public Library. (2017). Advanced search. Retrieved from http://www.torontopubliclibrary.ca/advanced/
Toronto Public Library. (2018). Material in your language. Retrieved from https://www.torontopubliclibrary.ca/books-video-music/your-language/
Zielinska, M. (1980). Public library services to Canadian ethnocultural communities: An overview. Library Trends, 29(2), 275-292.