Research Article
Visualization of the Scholarly Output on Evidence Based Librarianship: A Social Network Analysis
Nafiseh Vahed
MSc Student
Department of Medical Library and Information Sciences
School of Management and Medical Informatics
Tabriz University of Medical Sciences
Tabriz, Iran
Email: vahedn66@gmail.com
Vahideh Zarea Gavgani
Associate Professor
Department of Medical Library and Information Science, School of Management and Medical Informatics
Tabriz University of Medical Sciences
Tabriz, Iran
Email: vgavgani@gmail.com
Rashid Jafarzadeh
PhD Candidate
Department of Knowledge and Information Science
Tehran University
Tehran, Iran
Email: rashid.jafarzadeh@gmail.com
Ziba Tusi
Scientometrics Librarian
Department of Knowledge and Information Science
Yazd University
Yazd, Iran
Email: zbtusi@yahoo.com
Mohammadamin Erfanmanesh
Senior Lecturer
Department of Library & Information Science, Faculty of Computer Science & Information Technology
University of Malaya
Kuala Lumpur, Selangor, Malaysia
Email: amin.erfanmanesh@gmail.com
Received: 23 Dec. 2017 Accepted: 14 Oct. 2018
![]() 2018 Vahed,
Gavgani, Jafarzadeh, Tusi, and Erfanmanesh. This is an Open
Access article distributed under the terms of the Creative Commons‐Attribution‐Noncommercial‐Share
Alike License 4.0 International (http://creativecommons.org/licenses/by-nc-sa/4.0/),
which permits unrestricted use, distribution, and reproduction in any medium,
provided the original work is properly attributed, not used for commercial
purposes, and, if transformed, the resulting work is redistributed under the
same or similar license to this one.
2018 Vahed,
Gavgani, Jafarzadeh, Tusi, and Erfanmanesh. This is an Open
Access article distributed under the terms of the Creative Commons‐Attribution‐Noncommercial‐Share
Alike License 4.0 International (http://creativecommons.org/licenses/by-nc-sa/4.0/),
which permits unrestricted use, distribution, and reproduction in any medium,
provided the original work is properly attributed, not used for commercial
purposes, and, if transformed, the resulting work is redistributed under the
same or similar license to this one.
DOI: 10.18438/eblip29396
Abstract
Objective – This paper aimed to analyze worldwide research on evidence based librarianship (EBL) using Social Network Analysis (SNA).
Methods – This descriptive study has been conducted using scientometrics and a SNA approach. The researchers identified 523 publications on EBL, as indexed by Scopus and Web of Science with no date limitation. A range of software tools (Ravar PreMap, Netdraw, UCINet and VOSviewer) were utilized for data visualization and analysis.
Results – Results of the study revealed that the United Kingdom (UK) and the United States (US) occupied the topmost positions regarding centrality measures, clearly indicating their important structural roles in EBL research. The network of EBL research in terms of the degree of connectedness showed low density in the co-authorship networks of both authors (0.013) and countries (0.214). Seven subject clusters were identified in the EBL research network, four of which related to health and medicine. The occurrence of the keywords related to these four subject clusters suggested that EBL research had a greater association with the setting of health and medicine than with traditional librarianship elements such as human resources or library collection management.
Conclusion – This study provided a systematic understanding of topics, research, and researchers in EBL by visualizing the networks and may thus inform the development of future aspects of EBL research and education.
Introduction
Evidence based practitioners consider evidence based librarianship (EBL) a trusted and robust approach to improve professional decisions and service, based on the collection, interpretation and integration of valid, significant and applicable user-reported, librarian-observed and research-derived evidence (Eldredge, 2006). Since this approach first emerged in the library science literature in 1995 (Haines, 1995; Booth & Brice, 2004), numerous research outputs have been published. However, limited research has been conducted on the characteristics and properties of the EBL research network. In the research field of complex networks and bibliometrics, co-authorship network analysis represents an important area of study. Co-authorship networks are a kind of social network which are constructed by connecting two or more authors together if they have co-authored at-least one article. This method has been utilized in a number of fields, such as library and information science (LIS) (Erfanmanesh & Hosseini, 2015; Hu, Hu, Gao, & Zhang, 2011; Larivière, Sugimoto & Cronin, 2012; Liu, Bollen, Nelson, & Van de Sompel, 2005; Shu, Larivière, Mongeon, Julien, & Piper, 2016; Yan, Ding, & Zhu, 2010), scientometrics (Erfanmanesh, Rohani, & Abrizah, 2012), medicine (Gonzalez-Alcaide, Park, Huamaní, Gascón, & Ramos, 2012), general practitioner research (Hong et al., 2016), cardiology (Yu, Shao, & Duan, 2013) and computer science and information systems (Bazzan & Argenta, 2011; Takeda, 2010). The aforementioned researchers have pointed out the functionality and importance of co-authorship networks in the field of complex networks. However, there is still a gap in the literature of librarianship with regard to analysis of scientific collaboration networks, determination of subject clusters, and visualization of the scientific map of EBL. Therefore, comprehensive studies are required to understand the characteristics of co-authorship and keyword co-occurrence networks in EBL research. Social network analysis (SNA), as a process of investigating social structures through the use of networks and graph theory (Otte & Rousseau, 2002), is particularly suited to this purpose. Using SNA by visualizing the study of EBL as a scientific map could provide us with a greater understanding of the status of research in this field. The findings of this research could be used to inform future educational policies and research development plans.
Literature Review
A number of previous studies have investigated social network measures in the area of librarianship and information science. Ding, Chowdhury, and Foo (2001) mapped the intellectual structure of the field of information retrieval during the period of 1987-1997 using co-word analysis. The results suggested the information retrieval field had some established research themes and had also changed rapidly to embrace new themes. Erfanmanesh et al. (2012) studied the co-authorship networks of 3024 authors, 1207 institutions, and 68 countries in the field of scientometrics. Results revealed that the scientometrician’s collaboration network forms a small-world topology in which authors are typically separated by a short path. Zong et al. (2013) visualized the subject clusters of doctoral dissertations in LIS in China using co-word analysis. The results revealed 15 clusters with 51 keywords. The highest number of occurrences related to knowledge management. The researchers concluded that topics of LIS doctoral dissertations in China were varied, with many immature research fields and a few well-developed, core research fields.
Erfanmanesh and Hosseini (2015) analyzed international co-authorship networks in LIS research across a time span of 50 years (1963-2012). Findings showed that the co-authorship network of countries in LIS research contained 151 vertices which connected together through 3121 links (co-authorships). Moreover, the results of clustering analysis revealed that this network comprised 39 clusters. The greatest density of research was found in those clusters relating to the US and the UK. Velmurugan and Radhakrishnan (2015) studied the authorship trend and network of papers published in the DESIDOC Journal of Library and Information Technology. Results of the study revealed that the degree centrality of authors’ collaboration networks ranged from 0.36 to 0.77. Moreover, the average degree of collaboration was found to be 0.5, which indicated a high level of collaboration amongst researchers. Shu et al. (2016) studied the evolution of research topics in LIS doctoral dissertations in North America during 1960-2013. Findings showed that the dominant research interest in doctoral dissertations was in information science rather than library science. However, the mapping of doctoral dissertations’ topic co-assignments revealed a strong relationship between library science and information science. Moghadami, Hassanzadeh, and Shokreian (2016) studied EBL research outputs with quantitative methods in scientometrics. They aimed to identify the most productive authors, countries, institutions and journals in EBL over 30 years. Findings showed: the US, England, and Canada were leading countries; Booth was the most prolific author; and the Health Information and Libraries Journal was the core journal in publishing EBL papers (Moghadami et al., 2016).
Our review showed that whilst mapping and visualization have been investigated in the field of library and information sciences, there is a gap in the use of scientometrics or SNA to demonstrate collaboration networks, interdisciplinary relations, and subject clusters in EBL.
Aims
This study aimed to investigate the scientific output of EBL using scientometric and SNA methods. Detailed objectives of the study were to:
· Visualize the collaboration network of authors in EBL research.
· Visualize the collaboration network of countries in EBL research.
· Visualize subject clusters in EBL research.
Methods
The researchers used scientometrics and SNA methods to visualize and analyze research collaboration networks and subject clusters in EBL.
We aimed to identify all publications on EBL indexed by Scopus and Web of Science. The selection of appropriate key words was critical to building a robust search. The identified words and phrases were converted into Key Word Validity Ratio (KWVR) format. A panel of experts, including five search experts and subject specialists, were invited to vote on the validity of presence of terms in the search strategy, according to a scale of three criteria (essential, related but needs modification, nonessential). The votes were matched with Lawshe’s table, which is used for content validity ratio (CVR) (Gavgani & Vahed, 2017). Terms scoring 0.99 or higher were included in the search strategy. The search strategy included the following terms relevant to EBL: evidence based, systematic review, meta-analysis, journal club, librarianship, information practice, library and information sciences, library sciences, and eblip. We limited the search to the title, abstract, and keyword fields and applied no date limitation. We conducted the search on October 1st, 2017. A total of 523 unique publications (398 from Scopus and 125 from Web of Science) were identified which constituted the sample of the study.
To visualize and analyze the collaboration networks, we used the following software tools: Ravar PreMap, Netdraw, UCINet and VOSviewer. First, bibliographic data were retrieved from the Scopus and Web of Science databases. Data cleansing was conducted to detect and remove errors and duplicates. This also included disambiguation of author and country names which were written in different forms (e.g., Eldredge J.D. and Eldredge J., or UK and United Kingdom). To prepare the adjacency matrixes of authors, countries, and subjects, the data were separately imported to the Ravar PreMap software. The Ravar PreMap software generated the matrixes and produced data in .txt format. The UCINet software program was used to convert the data to a format which could be used within Netdraw to visualize the collaboration network of authors and countries. Moreover, the VOSviewer software was used to visualize subject clusters and the co-occurrence analysis of the keywords. To identify the main topics in EBL research outputs, we used a co-word occurrence approach. Described by Son, Jeong, Kang, Kim, and Lee (2015), this approach assumed that terms which frequently co-occur in a body of text tend to be more closely related. This approach is therefore a good indicator of the terminology used within a subject area. In other words, the more frequent the co-occurrence of a pair of words in the literature, the more similar the themes they indicate (Hong et al., 2016).
To recognize the co-occurrence of the words and determine subject clusters in EBL, five further tasks were conducted to prepare and cleanse data:
- the single and plural forms of keywords were merged,
- all abbreviations were written in their full format,
- ambiguous keywords such as location and date were deleted from the list,
- synonyms were combined, and
- the threshold for the frequency of occurrences was agreed as three. As a result, keywords with one or two occurrences were excluded.
We then conducted the SNA to describe collaboration and subject cluster networks. We utilized both macro and micro-level metrics. Macro-level metrics concentrated on the topology of a network as a whole, with the aim of capturing the overall structure of a network; while micro-level metrics focused on the evaluation of individual actors with the aim of capturing the features of each actor in a network (Yan et al., 2010). In this study, one macro-level indicator, namely density, and three micro-level indicators, namely degree centrality, betweenness centrality and closeness centrality, were investigated. The density was scored as a number between zero and one. A number close to one meant that the network was consistent and the relationships between nodes showed greater density. The density indicated direct relations between agents in a network and a high proportion of possible relations (Ergün & Usluel, 2016). In other words, when the number of links is less than the number of nodes, the density of network is low (Scott & Carrington, 2011).
Results
Visualizing the Collaboration Network of Authors in EBL Research
The co-authorship network of authors in EBL research was mapped and analyzed. The results showed that the authors’ co-authorship network consists of 73 nodes and 384 links. Centrality of the nodes was analyzed using three measures: degree, closeness, and betweenness. In a co-authorship network, the degree centrality of a node showed the total number of co-authorships that a node had with other researchers. In this network, A. Booth, with the normalized degree centrality of 1.385, had the highest number of co-authorships, followed by J.D. Eldredge (1.293) and A. Brice (1.108). A network member with a high degree centrality can be considered to be an active member, indicated by a higher number of partnerships with other members in the network. Closeness centrality can be defined as how close an author was on average to all others in the network (Hanneman, & Riddle, 2005). It is the mean length of all shortest paths from a node to all other nodes in the network. As indicated in Table 1, all of the top 30 authors in EBL research had the same normalized closeness centrality (0.099). These authors were closest, or more central, actors of the network, because the sum of their geodesic distances to other actors was among the lowest. Another centrality measure that depicted the importance of a particular node was betweenness centrality. The betweenness centrality was defined as the number of shortest paths that pass through a node divided by all shortest paths in the network (Guns, Liu, & Mahbuba, 2011). In regard to normalized betweenness centrality, the most influential authors in the network were A. Booth (0.278), J.D. Eldredge (0.164) and A. Brice (0.116). Table 1 shows the most important authors based on centrality measures. Additionally, the network had very low density (0.013), which indicated only 1.3% of all possible links being present. This could suggest that the network was still relatively developmental, characterized by limited and weak relationships between nodes.
Table 1
Top 10 Authors in Centrality Measures
|
Rank |
Authors |
Degree Centrality |
Closeness Centrality |
Betweenness Centrality |
|
1 |
Booth A. |
1.385 |
0.099 |
0.278 |
|
2 |
Eldredge J.D. |
1.293 |
0.099 |
0.164 |
|
3 |
Brice A. |
1.108 |
0.099 |
0.116 |
|
4 |
Koufogiannakis D. |
0.923 |
0.099 |
0.094 |
|
5 |
Cleyle S. |
0.831 |
0.099 |
0.162 |
|
6 |
Partridge H. |
0.831 |
0.099 |
0.099 |
|
7 |
Lewis S. |
0.739 |
0.099 |
0.055 |
|
8 |
Hallam G. |
0.739 |
0.099 |
0.029 |
|
9 |
Howlett A. |
0.554 |
0.099 |
0.024 |
|
10 |
Grant M.J. |
0.185 |
0.099 |
0.012 |
Table 2
Top 10 Countries in Centrality Measures
|
Rank |
Country |
Degree Centrality |
Closeness Centrality |
Betweenness Centrality |
|
1 |
UK |
53.488 |
5.250 |
12.373 |
|
2 |
US |
44.186 |
5.225 |
5.747 |
|
3 |
Germany |
39.535 |
5.212 |
0.542 |
|
4 |
Denmark |
37.209 |
5.206 |
1.199 |
|
5 |
Australia |
37.209 |
5.206 |
0.945 |
|
6 |
Portugal |
34.884 |
5.200 |
0.313 |
|
7 |
Spain |
34.884 |
5.200 |
0.259 |
|
8 |
Netherlands |
34.884 |
5.200 |
0.259 |
|
9 |
Norway |
34.884 |
5.200 |
0.259 |
|
10 |
Canada |
25.581 |
5.174 |
0.369 |
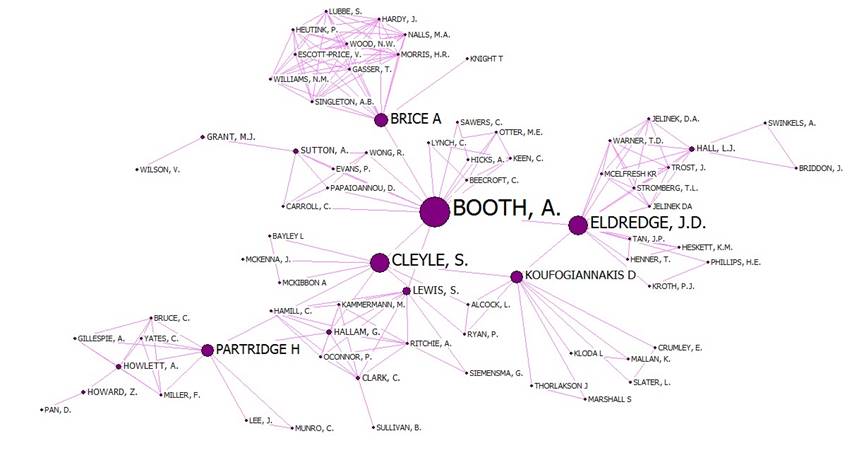
Figure 1
The co-authorship network of authors in EBL research.
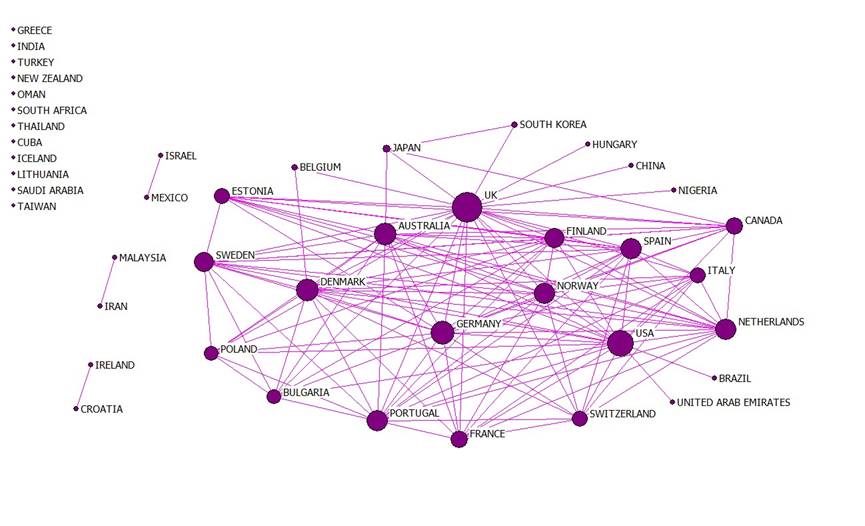
Figure 2
The co-authorship network of countries in EBL research.
Figure 1 visually depicts the collaboration network of authors in EBL. This network consisted of the nodes and links: nodes represented authors, while links connected vertices in the form of co-authorships.
There was a link between two nodes if they had co-authored at least one paper. The size of a node was proportional to its betweenness centrality. The nodes with high betweenness played a significant role in bridging sub-networks and controlling the flow of information in the network. The EBL network would display greater fragmentation into separate unconnected components without these key brokers with high betweenness centrality (Figure 1).
Visualizing the Collaboration Network of Countries in EBL Research
The co-authorship network between countries in EBL research was also visualized. This network contains 44 nodes (countries) and 268 links (co-authorships) (Figure 2). There were 12 isolated nodes such as Greece, India, and Turkey which represented countries that had not collaborated with others. Moreover, three components with only two countries (dyads) existed, including Iran and Malaysia, Israel and Mexico, as well as Ireland and Croatia. Table 2 indicates the top 10 countries contributing to the EBL research based on centrality measures. Among all countries within the sample, the UK occupied the topmost positions in normalized betweenness centrality (12.373), normalized closeness centrality (5.250), and normalized degree centrality (53.488), which indicated its central role in collaboration network of countries in this field.
The second country with the highest betweenness centrality was the US (5.747), followed by Denmark (1.199), Australia (0.945), and Germany (0.542). These countries featured prominently in the network, appearing on the geodesic paths between other pairs of countries, suggesting a crucial role in knowledge flow in EBL research. Countries with the highest normalized degree centrality included the UK (53.488), US (44.186), Germany (39.535), Denmark (37.209), and Australia (37.209). In regard to closeness centrality, the UK was very close to the other nodes, suggesting that the UK had been very successful in establishing collaborations with other countries compared with other countries.
The collaboration network of countries in EBL research is presented in Figure 2. In this network, each node stands for a country and there was a link between two nodes if the authors affiliated with those countries had co-authored at least one paper. The size of a node was proportional to its normalized betweenness centrality. The density of the collaboration network of countries was found to be equal to 0.223, which indicated only 22.3% of all possible links being presented and the network had a low overall cohesion.
Identifying and Visualizing Subject Clusters in EBL Research
Co-word analysis is a content analysis technique for discovering the linkages and associations among subjects through the analysis of the co-occurrence frequency of pairs of words or noun phrases (He, 1999, p.134). To map subject clusters, keywords were extracted from the title and keywords sections of papers identified in the search. A total of 1901 keywords were identified. Applying a threshold of three word co-occurrences, 134 keywords were subsequently identified. Analysis and visualization of keywords was conducted using VOSviewer (Figure 3).
Table 3 shows the top 20 keywords which occurred most frequently, with scores for closeness centrality, betweenness centrality and degree centrality. Results showed that “library science”, “evidence based medicine”, “evidence based practice”, “systematic review” and “education” were the most frequent keywords in EBL research.
Table 3
Top 20 Keywords with the Highest Frequency in EBL Research
|
Betweenness Centrality |
Closeness Centrality |
Degree centrality |
Frequency of keyword |
Keyword |
Rank |
|
8.699 |
90.476 |
89.474 |
316 |
Library Science |
1 |
|
5.501 |
84.177 |
81.203 |
194 |
Evidence Based Medicine |
2 |
|
4.701 |
77.778 |
71.429 |
148 |
Evidence Based Practice |
3 |
|
3.021 |
70.370 |
57.895 |
116 |
Systematic Review |
4 |
|
3.179 |
76.000 |
68.421 |
114 |
Education |
5 |
|
2.754 |
73.077 |
63.158 |
112 |
Review |
6 |
|
2.543 |
76.000 |
68.421 |
110 |
Medical Science |
7 |
|
3.162 |
76.879 |
69.925 |
102 |
Information Storage and Retrieval |
8 |
|
3.252 |
75.141 |
66.917 |
96 |
Librarians |
9 |
|
1.044 |
62.150 |
39.098 |
84 |
Meta-Analysis |
10 |
|
0.908 |
60.455 |
34.586 |
72 |
Evidence Based Librarianship |
11 |
|
1.484 |
65.517 |
47.368 |
70 |
Research |
12 |
|
0.604 |
63.942 |
43.609 |
54 |
Medical Libraries |
13 |
|
1.361 |
68.557 |
54.135 |
54 |
Organization and Management |
14 |
|
1.538 |
67.172 |
51.128 |
52 |
Statistics |
15 |
|
1.654 |
70.370 |
57.895 |
46 |
Health Services |
16 |
|
1.513 |
66.834 |
50.376 |
46 |
Library Services |
17 |
|
0.770 |
63.033 |
41.353 |
46 |
Publication |
18 |
|
0.608 |
57.576 |
26.613 |
44 |
Academic Libraries |
19 |
|
1.863 |
67.172 |
51.128 |
42 |
Information Services |
20 |

Figure 3
Co-occurrence network of keywords in EBL research.
Table 4
Subject Clusters in EBL Research
|
Keywords within the cluster |
Number of Keywords |
Name of the Cluster |
No. |
|
Academic Libraries, Bibliometric, Citation Analysis, Clinical Librarianship, Collaborative Information Activities, Consumer Health Information, Digital Libraries, Evidence Based Librarianship, Evidence Based Practice, Health Science, Health Information Literacy, Health Information Needs, Health Librarianship, Health Science Libraries, Higher Education, Information Communication Technology, Information Literacy, Information Practice, Information Professional, Information Science, Information Services, Information Sources, Information Systems, Information Technology, Knowledge Transfer, Knowledge Translation, Learning, Library Instruction, Library Research, Library Services, Management, Medical Librarianship, Professional Development, Professional Development, Public Libraries, Research, School Libraries, Special Libraries, User Study |
39 |
Library and Information Science |
1 |
|
Access to Information, Biomedical Research, Clinical Practice, Data Mining, Decision Support Systems, Financial Management, Health Care Delivery, Health Education, Information Processing, Medical Documentation, Medical Education, Medical Informatics, Medical Information, Medical Information Systems, Medical Research, Needs Assessment, Patient Education, Patient Information, Practice Guidelines, Quality Assurance, Risk Assessment, Search Engine, University Teaching Hospitals |
23 |
Health and Medical Information |
2 |
|
Clinical Competence, Computer Science, Consumer Satisfaction, Continuing Education, Cooperative Behavior, Curriculum, Education, Evidence Based Nursing, Health Knowledge, Health Services, Information Dissemination, Information Seeking Behavior, Internet, Nursing, Nursing Education, Nursing Research, Program Development, Program Evaluation, Public Relations, Quality of Health Care, Research Design, Teaching |
22 |
Nursing |
3 |
|
Clinical Effectiveness, Clinical Research, Decision Making, Drug Efficacy, Drug Safety, Health Care System, Hospitalization, Meta-Analysis, Outcome Assessment, Patient Care, Psychology, Publication, Quality Control, Quality of Life, Systematic Review, Treatment Outcome, Urology |
18 |
Clinical Outcome |
4 |
|
In-service Training, Library Collection Development, Library Science, Medical Libraries, Medical Science, Organization and Management, Periodicals, Personnel Management, Professional Management, Professional Standard, Staff Development |
12 |
Management |
5 |
|
Clinical Decision Support Systems, Communication, Emergency Medicine, Evidence Based Medicine, Health Science, Hospital Emergency Service, Hospital Libraries, Information Management, Interpersonal Communication, Knowledge Management, National Health Services, Ontology |
12 |
Evidence Based Medicine |
6 |
|
Epidemiology, Health Care Policy, Information Storage and Retrieval, Publishing, Social Science, Sociology, Statistics, Technology |
8 |
Information Storage and Retrieval |
7 |
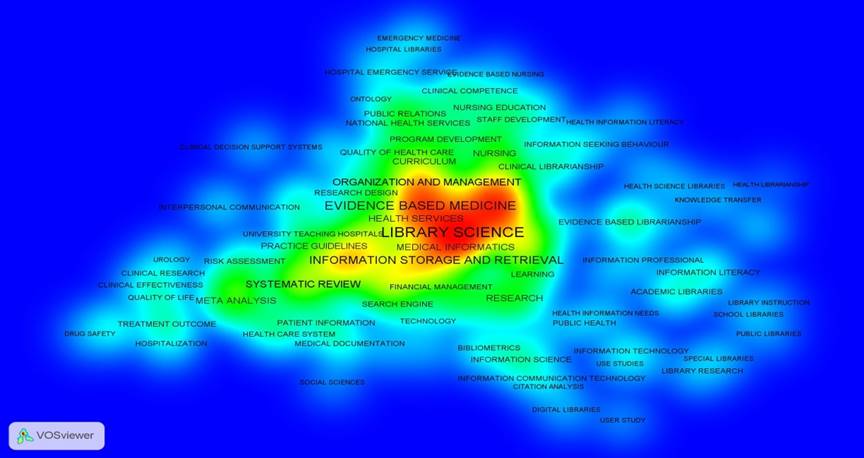
Figure 4
Cluster density map of keywords in EBL research.
Seven subject clusters were identified as sub-networks in the field of EBL (Table 4). Cluster analysis was performed to categorize key words appearing in the EBL network and the primary cluster. A cluster is a set of closely related nodes with each node in a network assigned to exactly one cluster (Waltman, Van Eck, & Noyons, 2010, p.7). The leading and the biggest cluster, which is shown with red color (Figure 3), was formed of 39 keywords (Table 4). In this cluster, “evidence based practice” and “evidence based librarianship” were the keywords with the highest number of occurrences. The second cluster (colored in pale green) consisted of 23 terms, in which the terms “medical informatics” and “medical information”, with a frequency of 36, were the most frequently co-occurring terms. The third cluster (colored in dark blue) was comprised of 22 keywords; “education” with a frequency of 114 was found to be the most frequent key word. The fourth cluster (colored in yellow) contains 18 terms; “systematic review” and “review”, with frequencies of 116 and 112 respectively, were the most frequently occurring keywords. The fifth cluster (colored in violet) included 12 terms; “library science”, with a frequency of 316, was the most frequently occurring keyword. The sixth cluster (colored in pale blue) comprised 12 terms, of which “evidence based medicine” with a frequency of 194, was the most prevalent keyword. Finally, the seventh cluster (colored in dark green) consisted of 8 keywords, of which “information storage and retrieval” with a frequency of 102, was the most frequently occurring term. To better illustrate the clusters, we named them based on the most leading words based on frequency (Table 4).
A density view of the network was visualized to provide a high level overview of the network structure and to highlight areas of particular density (Figure 4). In this map, each node had a color that depended on the weight of the vertex in the network, the number of vertices in the neighborhood, and the importance of the neighboring vertices. The highest number of vertices in the neighborhood of a vertex and the higher weights of the vertices were indicated by the color red. Conversely, fewest vertices in the neighborhood of a point and the lower weights of the vertices were indicated by the color blue. It can be argued that subjects located in dense areas of the map (shown in red) indicated importance in EBL research (Figure 4).
Discussion
For this study, the researchers examined the collaboration network of authors and countries as well as subject clusters in EBL research. We used SNA to investigate the research collaboration network, allowing for analysis which was both rigorous and highly visual. We analyzed the network at the micro-level, using degree, closeness, and betweenness centrality measures, and at the macro-level, exploring density.
Results showed that the share of co-authored papers represented a high percentage of the total number of publications in EBL research. Our findings resonated with other studies of research and authorship networks. Pecaric and Tudman (2017) revealed similar patterns, finding that multiple authorship grew during the three years of the research. Our results also revealed that the share of multiple authorship in information science and librarianship was greater than in other disciplines.
The distribution of degree centrality in the collaboration network of EBL research can be said to follow a power-law distribution. As Rastogi (2016) described, power law refers to “a relationship between two quantities in a way that, a relative change in one quantity would be reflective of relative change in the other quantity, but it is not necessarily representative of changes in initial value of the quantities” (p.7) and can be used in SNA to show changes over time. Our findings were consistent with earlier studies in LIS, such as Erfanmanesh and Hosseini (2015) which revealed that a high number of authors with small degrees of centrality and a low number with large degrees of centrality were seen in the network analysis. The co-authorship network of authors in EBL research consisted of 73 nodes and 384 links with 10 authors (see Table 1) positioned as central to the collaboration network.
Additionally, through our findings we suggest that the EBL co-authorship network was weak in term of density (0.013), with only 1.3% of all possible links being present. This weak density implied the network had limited cohesion with the potential for more relationships between nodes. Other studies have found similarly low density in LIS authorship networks, including Fahimifar and Sahli (2015), Hariri and Nikzad (2011), and Soheili & Osareh (2014). It can be inferred that the EBL authorship network followed the same characteristics of the broader LIS network in terms of density.
Regarding the co-authorship network of countries, we found the UK, US, Germany, Denmark, and Australia scored highest in terms of centrality. The UK and the US had the strongest collaborative ties together as well as the highest “betweenness” with other countries in the network, consistent with findings from the broader LIS field (Erfanmanesh & Hosseini, 2015). Results showed that the highest number of links within the EBL network were direct with no mediation. According to Otte and Rousseau (2002), “A co-authorship network is an example of an undirected graph: if author A co-authored an article with author B, automatically author B co-authored an article with A therefore the links (or edges) are bidirectional. An undirected graph can be represented by a symmetrical matrix M = (mij), where mij is equal to 1 if there is an edge between nodes i and j, and mij is equal to 0 if there is no direct link between nodes i and j" (p. 442). This issue was not a favorable sign in analyzing the connections in a network, as it was expected that the nodes in the network facilitated the connections among themselves and empowered the network as well.
This finding was consistent with a former study of Iranian LIS journals in Web of Science (Soheili & Osareh, 2014). Those countries with a high betweenness centrality were of particular importance in connecting different nodes and promoting the unity of the network; they occupied a central position in the network and played an important role in knowledge flow. Our study revealed the EBL co-authorship network was of low density (0.223). A similarly low density (0.082) was found in Erfanmanesh and Hosseini’s (2015) study of co-authorship within LIS research across countries, indicating only 8.2% of all possible links as present.
We identified seven subject clusters in the EBL research network (see Table 4). Four out of seven clusters, more than half of all identified subject themes, were related to health, for example: Evidence Based Medicine, Education and Nursing, Clinical Outcome, Health and Medical Informatics. This seems to resonate with the results of Ankem’s (2008) evaluation of systematic reviews and meta-analyses in LIS literature, which found all published systematic reviews in LIS at the time related to medical library or medical information settings. Exploring LIS specialties, Chang and Lin (2015) identified information systems, information retrieval, and bibliometrics as the dominant themes in a study exploring the broader LIS literature. Similar findings were evident in studies of dissertations, which can be a useful indicator of research activity within a subject field. Zong et al.’s (2013) investigation of Chinese doctoral dissertations in LIS found the leading topics to be information resource, ontology, semantic web, semantic search, electronic government, information resource management, knowledge management, knowledge innovation, knowledge sharing, knowledge organization, network, information service, information need, and digital library. Shu et al.’s (2016) analysis of the US LIS doctoral dissertations also revealed a similar shift from traditional library science toward information science. Mostafavi, Osareh, and Tavakolizadeh-Ravari’s (2018) content analysis and SNA in the field of knowledge and information science (KIS) highlighted the following main subjects clusters: “teaching and learning of KIS; Information literacy”, “Knowledge & Information Organization”, “Web resources and social networks”, “professional ethics in information science”, “informatics, communication and health information services”, “information management; information systems; knowledge management and innovation", and “indicators of informetrics and scientometrics.” Based on these findings, it can be inferred that EBL had stronger roots in the health and medical library community and was less associated with traditional library science subjects like collection development, acquisition, and organization.
Conclusion
Through this study, the researchers investigated the research outputs of EBL by social network analysis to explore collaboration between authors and between countries and to visualize research topics.
Results highlighted a core role for the UK and US in the international EBL research network, both playing a leading role in research and engaging in collaboration with authors around the world. The study also revealed a number of countries with limited relationships within the network, suggesting an opportunity to develop their research collaboration with the leaders or other countries in the main network. Based on the findings of this study and results of previous research, we concluded that EBL is more deeply rooted within health and medical settings,
Our findings provided evidence about the current status of EBL research around the world, thus helping researchers and policy makers better understand the nature of EBL research and predict the future dimension of research.
Acknowledgements and Appreciations
This study was ethically approved and financially supported by the Tabriz University of Medical Sciences, Iran and the Ethical Committee of Research Department, with the reference number: IR-TBZMED-REC-1395-1262. We are grateful to Dr. Mohammad Tavakkolizadeh, designer and developer of Ravar PreMap software, for his instructions and guidances on using the Ravar PreMap.
References
Ankem K. (2008). Evaluation of method in systematic reviews and meta-analyses published in LIS. Library and Information Research, 32(101), 91-104. https://doi.org/10.1.1.870.3067
Bazzan, A. L., & Argenta, V. F. (2011). Network of collaboration among PC members of Brazilian computer science conferences. Journal of the Brazilian Computer Society, 17(2), 133-139. https://doi.org/10.1007/s13173-011-0033-7
Booth, A., & Brice, A. (2004). Evidence-based practice for information professionals: A handbook. London: Facet Publishing.
Chang, Y. W., Huang, M. H., & Lin, C. W. (2015). Evolution of research subjects in library and information science based on keyword, bibliographical coupling, and co-citation analyses. Scientometrics, 105(3), 2071-2087. https://doi.org/10.1007/s11192-015-1762-8
Ding, Y., Chowdhury, G., & Foo, S. (2001). Bibliometric cartography of information retrieval research by using co-word analysis. Information Processing & Management, 37(6), 817-842. https://doi.org/10.1016/S0306-4573(00)00051-0
Eldredge, J. D. (2006). Evidence-based librarianship: The EBL process. Library Hi Tech, 24(3), 341-354. https://doi.org/10.1108/07378830610692118
Erfanmanesh, M., & Hosseini, E. (2015). Cross-time analysis of countries co-authorship networks in library & information science research. Library Philosophy and Practice. Retrieved from http://digitalcommons.unl.edu/libphilprac/1316/
Erfanmanesh, M., Rohani, V. A., & Abrizah, A. (2012). Co-authorship network of scientometrics research collaboration. Malaysian Journal of Library & Information Science, 17(3), 73-93. Retrieved from http://ejum.fsktm.um.edu.my/article/1298.pdf
Ergün, E., & Usluel, Y. K. (2016). An analysis of density and degree-centrality according to the social networking structure formed in an online learning environment. Journal of Educational Technology & Society, 19(4), 34-46. Retrieved from https://www.jstor.org/stable/pdf/jeductechsoci.19.4.34.pdf
Fahimifar, S., & Sahli, F. (2015). Investigation of the co-authorship network of Farsi scientific journals in the field of information science. Research on Information Science and Public Libraries, 21(1), 127-151.
Gavgani, V. Z., & Vahed, N. (2017). 184: Keyword Validity Ratio (KWVR); a tool for validity of keywords for building an accurate literature search strategy. BMJ Open, 7. https://doi.org/10.1136/bmjopen-2016-015415.184
Gonzalez-Alcaide, G., Park, J., Huamaní, C., Gascón, J., & Ramos, J. M. (2012). Scientific authorships and collaboration network analysis on Chagas disease: Papers indexed in PubMed (1940-2009). Revista do Instituto de Medicina Tropical de São Paulo, 54(4), 219-228. https://doi.org/10.1590/S0036-46652012000400007
Guns, R., Liu, Y. X., & Mahbuba, D. (2011). Q-measures and betweenness centrality in a collaboration network: a case study of the field of informetrics. Scientometrics, 87(1), 133-147. https://doi.org/10.1007/s11192-010-0332-3
Haines, M. (1995). Librarians and evidence-based purchasing. Evidence-Based Purchasing, 8(1).
Hanneman, R., & Riddle, M. (2005). Introduction to social network analysis. Riverside CA: University of California. (Published in digital form at http://faculty.ucr.edu/~hanneman/.
Hariri, N., & Nikzad, M. (2011). Co-authorship networks of Iranian articles in library and information science, psychology, management and economics in ISI during 2000-2009. Iranian Journal of Information Processing Management, 26(4), 825-844. Retrieved from http://jipm.irandoc.ac.ir/
He, Q. (1999). Knowledge Discovery through Co-Word Analysis. Library Trends, 48(1), 133-159. Retrieved from: https://www.ideals.illinois.edu/bitstream/handle/2142/8267/librarytrendsv48i1i_opt.pdf?sequence=1
Hong, Y., Yao, Q., Yang, Y., Feng, J. J., Ji, W. X., Yao, L., & Liu, Z. Y. (2016). Knowledge structure and theme trends analysis on general practitioner research: A co-word perspective. BMC Family Practice, 17(1), 10.
https://doi.org/10.1186/s12875-016-0403-5
Hu, C. P., Hu, J. M., Gao, Y., & Zhang, Y. K. (2011). A journal co-citation analysis of library and information science in China. Scientometrics, 86(3), 657-670. https://doi.org/10.1007/s11192-010-0313-6
Larivière, V., Sugimoto, C. R., & Cronin, B. (2012). A bibliometric chronicling of library and information science's first hundred years. Journal of the Association for Information Science and Technology, 63(5), 997-1016. https://doi.org/10.1002/asi.22645
Liu, X., Bollen, J., Nelson, M. L., & Van de Sompel, H. (2005). Co-authorship networks in the digital library research community. Information Processing & Management, 41(6), 1462-1480. https://doi.org/10.1016/j.ipm.2005.03.012
Moghadami, M., Hassanzadeh, M., & Shokreian, S. (2016). Thirty years of Evidence-based Librarianship (EBL): Citation analysis and review. COLLNET Journal of Scientometrics and Information Management, 10(2), 209-218. https://doi.org/10.1080/09737766.2016.1213965
Mostafavi, I., Osareh, F., & Tavakolizadeh-Ravari, M. (2018). Identifying content structure of “Knowledge and Information Science (KIS)” studies based on co-word analysis of articles in “Web of Science (WoS)” database (2009-2013). Iranian Journal of Information Processing and Management, 33(3), 1285-1314. Retrieved from http://jipm.irandoc.ac.ir/
Otte, E., & Rousseau, R. (2002). Social network analysis: A powerful strategy, also for the information sciences. Journal of Information Science, 28(6), 441-453. https://doi.org/10.1177/016555150202800601
Rastogi, T. (2016). A power law approach to estimating fake social network accounts. Retrieved from https://arxiv.org/abs/1605.07984
Pecaric, D., & Tudman, M. (2017). Co-authorship networks of scientific elite: case study of information science in Croatia. Qualitative and Quantitative Methods in Libraries, 5(1), 49-59. Retrieved from http://www.qqml-journal.net/index.php/qqml/article/view/28
Scott, J., & Carrington, P. J. (2011). The SAGE handbook of social network analysis. London, U.K.: SAGE publications.
Shu, F., Larivière, V., Mongeon, P., Julien, C. A., & Piper, A. (2016). On the evolution of library and information science doctoral dissertation topics in North America (1960-2013). Journal of Education for Library & Information Science, 57(2), 131-142. Retrieved from https://utpjournals.press/doi/abs/10.3138/jelis.57.2.131
Soheili, F., & Osareh, F. (2014). A survey on density and size of co-authorship networks in information science journals. Iranian Journal of Information Processing Management, 29(2), 351-372. Retrieved from http://jipm.irandoc.ac.ir/
Son, Y. J., Jeong, S., Kang, B. G., Kim, S. H., & Lee, S. K. (2015). Visualization of e-Health research topics and current trends using social network analysis. Telemedicine Journal and E-Health, 21(5), 436-442. https://doi.org/10.1089/tmj.2014.0172
Takeda, H. (2010). A social network analysis of the IS field: A co-authorship network study. Proceedings of the Southern Association for Information Systems Conference, 25. Retrieved from https://aisel.aisnet.org/
Velmurugan, C., & Radhakrishnan, N. (2015). Scientometric observations of Authorship Trends and Collaborative Research on DESIDOC Journal of Library and Information Technology. COLLNET Journal of Scientometrics & Information Management, 9(2), 193-204. https://doi.org/10.1080/09737766.2015.1069957
Yan, E., Ding, Y., & Zhu, Q. (2010). Mapping library and information science in China: A coauthorship network analysis. Scientometrics, 83(1), 115-131. https://doi.org/10.1007/s11192-009-0027-9
Yu, Q., Shao, H., & Duan, Z. (2013). The research collaboration in Chinese cardiology and cardiovasology field. International Journal of Cardiology, 167(3), 786-791. https://doi.org/10.1016/j.ijcard.2012.03.019
Zong, Q. J., Shen, H. Z., Yuan, Q. J., Hu, X. W., Hou, Z. P. & Deng, S. G. (2013). Doctoral dissertations of Library and Information Science in China: A co-word analysis. Scientometrics, 94(2), 781-799. https://doi.org/10.1007/s11192-012-0799-1