Research Article
Embracing the Generalized Propensity Score Method:
Measuring the Effect of Library Usage on First-Time-In-College Student Academic
Success
Jingying Mao
Department of Statistics
Florida State University
Tallahassee, Florida, United
States of America
Email: mjy_jean@hotmail.com
Kirsten Kinsley
Assessment Librarian
Florida State University
Libraries
Tallahassee, Florida, United
States of America
Email: kkinsley@fsu.edu
Received: 2 Aug. 2017 Accepted:
9 Nov. 2017
![]() 2017 Mao and Kinsley. This is an Open
Access article distributed under the terms of the Creative Commons‐Attribution‐Noncommercial‐Share Alike License 4.0
International (http://creativecommons.org/licenses/by-nc-sa/4.0/),
which permits unrestricted use, distribution, and reproduction in any medium,
provided the original work is properly attributed, not used for commercial
purposes, and, if transformed, the resulting work is redistributed under the
same or similar license to this one.
2017 Mao and Kinsley. This is an Open
Access article distributed under the terms of the Creative Commons‐Attribution‐Noncommercial‐Share Alike License 4.0
International (http://creativecommons.org/licenses/by-nc-sa/4.0/),
which permits unrestricted use, distribution, and reproduction in any medium,
provided the original work is properly attributed, not used for commercial
purposes, and, if transformed, the resulting work is redistributed under the
same or similar license to this one.
Abstract
Objective
– This
research focuses on First-Time-in-College (FTIC) student library usage during
the first academic year as number of visits (frequency) and length of stay
(duration) and how that might affect first-term grade point average (GPA) and
first-year retention using the generalized propensity score (GPS). We also want
to demonstrate that GPS is a proper tool that researchers in libraries can use
to make causal inferences about the effects of library usage on student
academic success outcomes in observation studies.
Methods
– The
sample for this study includes 6,380 FTIC students who matriculated in the fall
2014 and fall 2015 semesters at a large southeastern university. Students’
library usage (frequency and duration), background characteristics, and
academic records were collected. The Generalized Propensity Score method was
used to estimate the effects of frequency and duration of FTIC library visits.
This method minimizes self-selection bias and allows researchers to control for
demographic, pre-college, and collegiate
variables. Four dose-response functions were estimated for each treatment
(frequency and duration) and outcome variable (GPA and retention).
Results
– The
estimated dose-response function plots for first-term GPA and first-year
retention rate have similar shapes, which initially decrease to the minimum
values then gradually increase as the treatment level increases. Specifically,
the estimated average first-term GPA is minimized when the FTIC student only
visits the library three times or spends one hour in the library during his/her
first semester. The threshold for first-year retention occurs when students
visit the library 15 times or spend 21 hours in the library during their first
semester. After those thresholds, an increase in students’ library usage is
related to an increase in their academic success.
Conclusions
– The
generalized propensity score method gives the library researcher a
scientifically rigorous methodological means to make causal inferences in an
observational study (Imai & van Dyk, 2004). Using this methodological
approach demonstrates that increasing library usage is likely to increase FTIC
students’ first-term GPA and first-year retention rates past a certain
threshold of frequency and duration.
Introduction
The collegiate experience often includes a diversity of opportunities
and experiences to foster student development and engagement affecting the
retention and academic success of the first-time-in-college (FTIC) student.
According to Astin’s Input-Environment-Output (I-E-O) Model of Student Involvement,
student inputs—such as high school
grade point average (GPA), ACT scores, and gender—are often associated predictors of first-year
student success outputs (or outcomes), such as grades and retention (Strauss,
2014; Astin, 1997). The collegiate environment, including a student’s major,
enrolled credit hours, involvement in athletics, living in learning
communities, and employment is also an important influence on student outputs.
Another potential environmental factor that may affect student success outputs
is time spent in the library.
The research study presented in this article attempts to isolate the
treatment variables of number of library visits (frequency) and total hours of
stay (duration) during the first year of college while controlling for other
potential predictors of college success, such as student input and other
collegiate environmental variables, by measuring the effects of frequency and
duration of library visits on retention and GPA. Since randomizing a control
group of students who do not use the library and those who do is ethically
impossible, how do we measure FTIC students’ success and the effects of library
usage while also controlling for student inputs and other non-library
environmental impacts?
We decided to apply the generalized propensity score (GPS) method for a
number of reasons. Using GPS in addition to the I-E-O design gives a more
rigorous approach to measuring library impact on student academic success
because we attempt to control for as many inputs and other environmental
collegiate variables as possible. In addition, it allows us to “make causal
inferences from correlational data” and to “minimize the chances that our
inferences are wrong” (Astin & Antonio, 2012, p. 31). As Astin &
Antonio (2012) emphatically state, “Although we can never be sure that we have
controlled all such variables, the more we control, the greater confidence we
can have in our causal inferences” (p. 31). Furthermore, using the GPS method
reduces the effects of self-selection bias (Astin & Antonio, 2012, p. 31).
The bias may be caused because students who have certain characteristics, such
as higher ACT scores and higher high school GPA, may self-select to use the
library frequently and for long durations. This may cause an overestimation of the
treatment effect of library usage. GPS
also allows us to measure the effect of continuous library usage variables over
time by frequency and duration. Moreover, we can predict that with each
treatment or dose of library time, retention and GPA for FTIC students will
increase. If more library visits and duration of stay are related to increasing
retention rates and higher grades, we will have more confidence to say that as
library visits increase so do the student success variables of first-year
retention and GPA.
Literature Review
According
to Astin’s Input-Environment-Output (I-E-O) Model of Student Involvement (1970,
1990, 1993), both student inputs and the college environment influence student
outputs (arrows B and C on Figure 1). (Please note: The terms output and
outcomes will be used interchangeably throughout this paper as they relate to
Astin’s theory, even though outputs are typically defined differently than
outcomes.) At the same time, student inputs (arrow A on Figure 1) affect how
students experience the college environment.
According
to the model, input variables such as pre-college high school grades and
college entrance exam scores (e.g., SAT scores) collectively impact whether a
student succeeds
in college. Higher education research has been exploring the environmental and
engagement variables that contribute to student academic success or outputs.
These variables may includes student engagement, investment in “educationally
purposeful activities” (Kuh, 2001, p. 12), involvement in student
organizations, social interactions, and engagement with faculty (Braxton,
Hirschy, & McClendon, 2004; Kuh, Cruce, Shoup, Kinzie, & Gonyea, 2008;
Roksa & Whitley, 2017). “Without knowing how students spend their
time, it’s almost impossible to link student learning outcomes to the
educational activities and processes associated with them” (Kuh, 2001, p. 15).
Librarians
who research what factors the library contributes to student success would
benefit from applying Astin’s Model since it offers a practical, holistic
theoretical approach to looking at the interaction between student attributes
and their environment and can easily incorporate library activities as part of
the environmental variables. It acknowledges what academic librarians already
know—that “many other factors besides the library contribute to
students’ academic success . . .” (Jantii & Cox, 2012, p. 4). Even so,
libraries provide many services and resources that help to engage students in
“educationally purposeful activities” that contribute to student success.
“Students engage in a wider variety of interactions with their libraries and it
is important to examine the differences those interactions can have on student
outcomes” (Soria, Fransen, & Nackerud, 2013, p. 149).

Figure 1
Astin’s
Input-Environment-Output Model.
In 2003,
Kuh and Gonyea stated that “relatively little is known about what and how
students’ academic library experiences contribute to desired outcomes of
college . . .” (p. 258). Over 15 years later, Soria et al. (2017a, 2017b)
report a similar dearth of research in this area, though more and more research
is rapidly being published on this topic. Almost 50 years ago, Kramer and
Kramer (1968) looked at the retention rates of freshman who used the library
and found that borrowing library books was associated with retention. Mezick
(2007) found a significant positive association between library expenditures
and student persistence for all Carnegie Classifications and between retention
and the “number of library professional staff . . . at doctoral granting
institutions” (p. 564).
Although
other studies have looked at student outcomes and library use, it was not until
the Value of Academic Libraries’ initiative of the Association of College &
Research Libraries (ACRL) that a collective, concentrated effort was made to
create a body of research demonstrating academic library value and impact
related to student success measures (Oakleaf, 2010). Following the commencement
of the Value of Academic Libraries initiative, current library research
demonstrates connections between FTIC student library usage and its impact on
GPA and retention outcomes. Emmons & Wilkinson (2011) found that library
input variables (e.g., wages, library volumes, and expenditures) had an effect
on student retention. Using a linear regression model while controlling for
socioeconomic status, race, and ethnicity, they discovered that an increase in
the ratio of professional library staff to students had a positive effect on
both student retention (measured by students returning for their second year)
and six-year graduation rates. Interestingly, Stemmer and Mahan (2016) found
that the ways that freshman used the library (outputs) were associated with GPA
and retention. Using the library for academic purposes like checking out books
or using online resources were associated with GPA and retention, but using the
library computers for personal use and the late-night study rooms for cramming
sessions was negatively associated with success outcomes.
Nine recent
studies examined by the authors found that a combination of library space,
instruction, and resource usage by FTIC students was positively associated with
retention, GPA, or both (Kot & Jones, 2015; Soria et al., 2013, 2014,
2017a, 2017b; Haddow, 2013; Murray, Ireland, & Hackathorn, 2016; Stemmer
& Mahan, 2016; Stone & Ramsden, 2012). Note that of the studies
examined, most focused on library space and resource usage effects on student
outcomes which included workstation logins, study room usage, e-resources and
print books usage, interactions with library personnel, use of ILL and
reference, and other similar resources. Kot & Jones (2015), Soria et
al. (2017b), and Murray et al. (2016) also included library instruction in their list
of environmental variables. Some of the studies controlled for other input and
environmental variables that may impact student success (Kot & Jones, 2015;
Soria et al., 2013, 2014, 2017a, 2017b). Some used the propensity score
matching methodology (Kot & Jones, 2015; Soria et al. (2017b) and some
studies applied Astin’s I-E-O model as their conceptual framework (Kot &
Jones, 2015; Soria et al., 2014, 2017a, 2017b; Stemmer & Mahan, 2016).
Another
study, conducted by masters of economics students at Florida State University
using our local library turnstile data, found that students who had low GPAs
showed “larger academic gains from additional library usage than their high-GPA
library user counterparts” (Holcombe, Lukashevich, & Alvarez (2016, p. 14). Note that though
this study examined undergraduate student library usage and GPA, it was not
limited to the FTIC population. The use of the GPS methodology is unique
to this library study since we were predicting outcomes based on continuous
variables of library usage over time from actual turnstile data. It is
interesting to note that the two outcomes measured in this study, GPA and
retention, have been correlated: higher individual GPAs “may well be the single
best predictors of student persistence . . .” (Pascarella & Terenzini 2005,
p. 396). In addition, scholarship that focuses exclusively on the critical role
of library instruction and its effect on first-year retention and GPA is not
reviewed here.
Aims
This study aims to evaluate the effect of library usage (frequency of visits and duration of
stay) over the course of a semester on FTIC student academic success measured
in first-term GPA and first-year retention rate. In our study, student
outputs or dependent variables are first-term GPA and first-year retention
rate. The independent variables include the environmental variables of library
usage (library visit frequency and duration) while controlling for other
non-library related college environment variables. Other controlled variables
include student inputs, such as demographic characteristics and other
pre-college academic variables. By studying first-year students we by default
control for the effects “of later collegiate experiences that may also
influence students’ outcomes . . .” (Soria et al., 2017a, p. 10).
This is an
observational study where we could not randomly assign students to different
amounts of library visit treatment during their first year. As a result,
students have self-selected themselves into different levels of treatment
because of their different input variables, such as gender, class, major etc.
So we also tried to find a statistical method to minimize the self-selection
bias in our sample.
Specifically,
the research questions for this study are:
1)
Does library usage measured in
frequency (visits per semester) and duration (length of stay per semester)
impact student academic success in terms of first-term GPA and first-year
retention rate?
2)
Are these impacts still observed
after controlling for other input and environmental variables? and
3)
Does embracing generalized
propensity scoring give librarians more rigorous research results?
Methods
Data
The sample for this
study includes 6,380 FTIC students who
matriculated in the fall 2014 and fall 2015 semesters
at a large southeastern university. Here FTIC refers to an entering
freshman or a first-year student attending college for the first time at the
undergraduate level. This includes students who attended college for the first
time in the prior summer term and are also enrolled in the fall term. Also included
are students who entered with advanced standing (having earned college credits
before graduation from high school). For the purposes
of this paper, retention is measured for FTIC students by their “persistence
between the first and second year at college” (Kuh, et al., 2008, p. 555).
Data in the study comes
from two sources: the C-Cure System (card swipe system) and the Office of
Institutional Research. The campus has two major libraries and these were
chosen sites for the study because they have turnstiles that could provide
primary data for our study. Each library has six turnstiles, including two
entrances, two exits, and a handicap entrance and exit. Both libraries require
students to swipe student IDs at the turnstiles to enter or exit libraries. The
C-Cure System collects card-swipe data that includes student identification
information, time that students enter or exit the library, direction (in or
out), and which turnstile they use. By matching swipe-in and swipe-out records,
we extracted frequency and duration of individual library usage for each
semester.
At our request, the
Office of Institutional Research provided all other student background
characteristics and academic records for all FTIC students. By merging
card-swipe data and student information data, the final data set was ready for
analysis. This data was coded to keep student information anonymous. The output
(dependent) variables of interest were first-term GPA and first-year retention
rate.
The environment
(treatment) variables of interest were library usage measures, defined as
first-term library visit frequency and duration (measured in hours). Other
environment variables that we controlled for include major (college), class
(freshman, sophomore, junior, senior or non-degree), military status,
participation in athletics or sports, current load (credit hours enrolled in
the first term), matriculation year (2014 or 2015), housing status (whether
living on or off campus), and participation in the Center for Academic
Retention and Enhancement program (provides transition support for minority
students).
The input variables for
the study included students’ demographic characteristics and pre-college
academic variables. Demographic characteristics included the student’s gender,
race, citizenship, age at matriculation, parent income level, and education
levels of students’ mothers and fathers. Pre-college academic variables
included the student’s high school GPA, ACT scores, and transfer credits. Some
of students were admitted with SAT or ACT scores only. To compare those two
measures, we transferred SAT scores into corresponding ACT scores using an
SAT/ACT concordance/comparison chart. For those students who had both test
scores, only the ACT scores were used. Table A1 in the Appendix presents
summary statistics for all variables.
Generalized Propensity Score Method
To adjust for
self-selection bias and control for the inputs and other environmental
variables in a scientifically rigorous way, we use the GPS method developed by
Hirano and Imbens (2004). This method is a generalization of the binary
treatment propensity score matching method (Rosenbaum & Rubin, 1983) and is
used to make causal inference in the observational studies (Imai & Dyk,
2004).
In this study, the
treatment variables (library visit frequency and duration per student) are
continuous measurements that can take the value of all positive integers. So,
we decided to use the GPS method instead of the binary propensity score
matching method to estimate the effects of continuous treatments—that is, the
number of library visits and the number of hours spent in the library over time
on student grades and retention.
Following Hirano and Imbens
(2004), we have random samples of FTIC students indexed by ![]() . For each sample
. For each sample ![]() , there is a set of
potential outcomes,
, there is a set of
potential outcomes, ![]() (i.e. first-term GPA, first-year retention
rate) with a given level of treatment
(i.e. first-term GPA, first-year retention
rate) with a given level of treatment ![]() , referred to as the
unit-level dose-response function. In our study, treatment
, referred to as the
unit-level dose-response function. In our study, treatment ![]() is the first-term library visit frequency and
duration and
is the first-term library visit frequency and
duration and ![]() is an interval
is an interval ![]() . For each sample
. For each sample ![]() , we observed a
vector of covariates,
, we observed a
vector of covariates, ![]() , its actual
treatment received,
, its actual
treatment received, ![]() , and actual outcome
corresponding to the actual treatment received,
, and actual outcome
corresponding to the actual treatment received, ![]() . Our goal was to
estimate the average dose-response function:
. Our goal was to
estimate the average dose-response function: ![]() . Hereafter, we will
omit
. Hereafter, we will
omit ![]() to simplify the notation.
to simplify the notation.
The key assumption for the GPS method is weak unconfoundedness
introduced by Hirano and Imbens (2004):
![]() .
.
We assumed that the level of treatment received is independent of the
potential outcome given observed covariates. This assumption requires us to get
a rich set of covariates including all possible variables that may influence
selection into different levels of treatment.
Based on this assumption, we were able to estimate the GPS. If we write
the conditional density of the treatment given the covariates as ![]() , then the GPS is
defined as:
, then the GPS is
defined as:
![]() .
.
If the GPS is correctly estimated, then it has a balance property as the
binary propensity score:
![]() .
.
Hirano and Imbens
(2004) mentioned that this property does not require unconfoundedness. In combination
with weak unconfoundedness, it implies that the level of treatment received is
unconfounded given the GPS as well.
Given this result, GPS
can be used to remove bias caused by difference in covariates in the following
two steps. First, we estimated the conditional expectation of potential outcome
as a function of the treatment level and estimated GPS:
![]() .
.
Second, we estimated the dose-response function at each treatment level
by taking the average of this conditional expectation over the GPS evaluated at
that particular treatment level:
![]() .
.
Implementation
The first step is to estimate the GPS. Since our treatment variables
(frequency and duration) are counts and highly skewed with a large amount of
zero values, a negative binomial generalized linear model with log link
function is used to model the conditional distribution:
![]() .
.
Then the GPS is estimated via the following:
![]() .
.
There are many other ways to specify the distribution and estimate the
GPS. As long as the balance of covariates is achieved after adjusting for the
GPS, the model specification is not the key point here.
The second step is to specify the conditional expectation of potential outcome given the treatment level and
estimated GPS using OLS. In our study, a quadratic approximation including the
interaction term was used when the outcome variable is first-year GPA:
![]() .
.
When the outcome is first-year retention rate, we used a logistic
regression model to estimate the conditional expectation of potential outcome because retention is a binary
outcome with value 0 as not being retained and 1 as being retained:
![]() .
.
However, there is no direct causal interpretation of those estimated
coefficients (Hirano & Imbens, 2004).
The final step was to estimate the average dose-response function at
treatment levels of interest given the estimated parameters in the last step.
In the case of first-term GPA, the dose-response function was estimated as the
following:
![]() .
.
And in the case of first-year retention, the dose-response function is
estimated as the following:
![]() .
.
We also computed the 95% confidence bands for the dose-response function
based on 1,000 bootstrap replications, considering all estimation steps
including GPS and ![]() -parameters.
-parameters.
Common Support Condition and Balancing of Covariates
As in the standard propensity score matching method, we needed to check
the common support condition. We adapted the approach from Kluve, Schneider,
Uhlendorff, & Zhao (2012). First, we divided the sample into three groups
by the 30th and 70th quartiles of the treatment. For each
group, we evaluated the GPS for the whole sample at the group mean of the
treatment. Then we plotted the distribution of the evaluated GPS for that group
against the distribution of the evaluated GPS for the rest of the sample. The
overlap of those two distributions is the common support. We repeated the above
procedures for all three groups. Finally, we restricted our final sample to
individuals who are comparable across all three groups simultaneously. In other
words, we deleted individuals whose GPS fell out of any common support of the
three groups.
Besides assessing the common support condition, balancing of covariates
is also very important to the GPS method. We regressed each covariate on the
treatment with and without conditioning on the predicted level of treatment ![]() (Imai & van Dyk, 2004). If there was no correlation between treatment
and any covariate after conditioning on the predicted treatment, then we
concluded that the covariate balance is achieved after adjusting for the GPS.
(Imai & van Dyk, 2004). If there was no correlation between treatment
and any covariate after conditioning on the predicted treatment, then we
concluded that the covariate balance is achieved after adjusting for the GPS.
Results
First-Term GPA
All tables and figures regarding the process of implementing the GPS
method are included in the Appendix. As previously noted, Table A1 provides
summary statistics. Table A2 provides the estimated coefficients from the negative binomial
generalized linear models using the first-term GPA as the outcome variable. Both models showed
that age, participation in athletics, ACT scores, college attended, current
academic load, matriculation year, and race had influence on student library
usage.
We assessed the
common support condition using the method we described in the methodology
section. Figures A1 and A2 in the Appendix illustrate the distribution of the
evaluated GPS before and after deleting the non-overlap for the treatment
variables of frequency and duration, respectively. After imposition of common
support for the frequency treatment, we deleted only 0.4% of our original
sample. For the duration treatment, we deleted 0.3% of our original sample.
Then we checked the balancing properties of the GPS using the method
proposed by Imai & van Dyk (2004). Table A3 presents the coefficient and
its standard error for each covariate with and without conditioning on ![]() . Table A3 clearly
demonstrates that before we conditioned on
. Table A3 clearly
demonstrates that before we conditioned on ![]() multiple covariates were significant. After we
conditioned on
multiple covariates were significant. After we
conditioned on![]() , no significant covariate
was observed. For example, participation in athletics had a high positive
correlation with both treatments (frequency and duration). However, once we
conditioned on the predicted level of treatment, athletic participation was not
significant in either case. So, we concluded that the balancing properties of
the GPS were achieved in both treatment cases.
, no significant covariate
was observed. For example, participation in athletics had a high positive
correlation with both treatments (frequency and duration). However, once we
conditioned on the predicted level of treatment, athletic participation was not
significant in either case. So, we concluded that the balancing properties of
the GPS were achieved in both treatment cases.

Figure 2
The dose-response function of first-term library usage frequency vs.
first-term GPA.

Figure 3
The dose-response function of first-term library usage duration vs.
first-term GPA.
The final step of our study was to estimate the dose-response function.
We regressed the outcome: first-term GPA on the treatment variable and the GPS.
The estimated coefficients are listed in Table A4. As was mentioned before, the
estimated coefficients did not have any direct causal interpretation.
The dose-response function was estimated for each treatment level of
interest by averaging the estimated regression function over the GPS evaluated
at the desired treatment level. Figures 2 and 3 present the dose-response
function of first-term GPA for the treatment variables of frequency and
duration, respectively. The dotted lines were 95% confidence bands based on
1,000 bootstrap replications that accounted for all estimation steps.
Figures 2 and 3 show the dose-response functions for frequency and
duration have similar shapes. First-term GPA first decreased and reached its
minimum value, then gradually
increased when the library usage frequency and duration increased.
For frequency, first-term GPA was minimized at 3.19066 when the FTIC
student only visited the library three times in their first semester. Once the
student visited the library over three times, library usage had a continued
positive relationship with their first-term GPA.
Similarly, for duration, first-term GPA was minimized at 3.177407 when
the FTIC student only spent one hour in the library during their first
semester. When the student spent an hour or longer in the library there were
gains in first-term GPA. The longer the time spent in the library, the larger
the increase in first-term GPA.
First-Year Retention Rate
Analysis procedures for first-year retention rate were almost the same
as the procedures for first-term GPA, except that we included first-term
GPA as a covariate when the outcome variable was retention rate. We then used a
logistic regression model in order to estimate the conditional expectation of outcome.
In the Appendix, Table A5 presents the estimated coefficients from the
GPS estimation step. Figures A3 and A4
and Table A6 (see the Appendix) verified the common support condition and the
balancing properties. The estimated coefficients from the logistic regression
model are presented in Table A7.
The dose-response functions were finally estimated at each treatment
level of interest. Figures 4 and 5 present the dose-response function of
first-year retention rate for the treatment variables of frequency and
duration, respectively. The dotted lines are 95% confidence bands based on
1,000 bootstrap replications that accounted for all estimation steps.
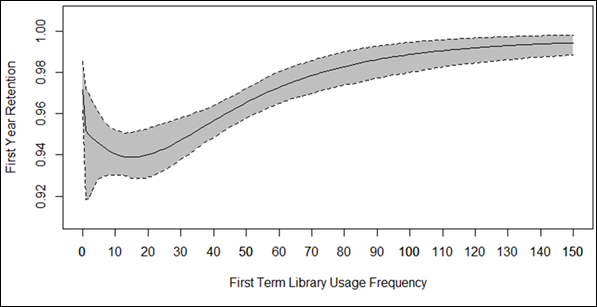
Figure 4
The dose-response function of first-term library usage frequency vs.
first-year retention.

Figure 5
The dose-response function of first-term library usage duration vs.
first-year retention.
Both dose-response functions have a shape similar to Figures 2 and 3.
Both plots indicate that first-year retention rate first declined to its
minimum value within the lower value of the treatment and then gradually
increased as the treatment increased.
For frequency, when students visited the library only fifteen times in
their first semester, they had the lowest first-term retention rate at 93.89%.
For duration, the minimum retention rate was achieved at 93.84% when FTIC
students spent only twenty-one hours in the library during their first
semester. After that, further increases in first-term library usage frequency
and duration both resulted in higher first-year retention rate.
The estimated dose-response function plots for first-term GPA and
first-year retention rate have similar shapes, which initially decrease to
minimum values and then gradually increase as the treatment levels increase. In
other words, there was a threshold of frequency and duration of library visits
where an increase of students’ library usage had a negative effect on their
first-term GPA and retention rates. Specifically, the estimated average first-term GPA was
minimized when FTIC students visited the library only three times or spent only
one hour in the library during their first semester. The
threshold for measurable increases in first-year retention occurred when
students visited the library fifteen times or spent twenty-one hours in the
library during their first semester.
As the estimated
dose-response functions reveal, increasing library usage was likely to
increase FTIC students’ first-term GPA and first-year retention rates past a
certain threshold of frequency and duration. When FTIC students visited more than three
times or spent more than two hours in the library during their first semester,
library usage positively affected students’ first-term GPAs. After FTIC
students crossed the threshold of visiting the library more than fifteen times
or spending more than twenty-one hours there in their first semester, students
with higher library usage had higher first-year retention rates.
Discussion
The small drop of both
first-term GPA and retention rate before reaching the thresholds for frequency
and duration may be explained in several possible ways. First, we did not
account for those FTIC students who may go to other libraries on campus other than
the two major libraries included in this study. For example, engineering majors
may not choose to come to the two on-campus libraries because their department
and library are located off-campus. Some students may only come to the
libraries at the beginning of the semester or during finals. Holcombe et al. (2016), using the same cohort and data set, found that
those students who come to the library only to cram during finals week do not
seem to benefit from low frequency, high duration library usage per semester.
The study has several
limitations. The definition of library usage used here (total frequency and duration
in one semester) may be too broad. We consider only when and how long the
students entered the building, ignoring what they might be doing while in the
building such as using other library
services, collections, and spaces (such use of study rooms) (Soria et al. 2017a; 2017b). Furthermore, we
cannot presume that students are studying when they visit the library. We can
only assume they are doing some form of “educationally purposeful activities”
that include using databases to conduct research and studying (Kuh, 2001, p.
12; Kuh & Gonyea, 2003). In one recent survey by Cengage, results showed
that student library users spend their time studying alone, using the databases
and reference materials, and meeting study groups (Strang, 2015). In a fall
2016 survey, the activities our students reported coming to the library for
were to 1) work on a paper, project, or homework; 2) study for an exam; 3)
print something; or 4) wait between classes (Dawson, 2016). Another limitation
of this study is that it is not possible to control or account for all possible
covariates that may influence the student success outcomes of GPA and
first-year retention rates. Especially difficult to measure are intangible,
intrinsic, and individual student inputs. For example, one study found that a
student’s “grit” or “mindset,” which is the
“willingness to work hard for an extended period in search of a long-term
goal,” was a key factor in college student success (Barton, 2015, para. 9).
Conclusion
Our results indicate
that increasing library usage contributes to higher FTIC students’ first-term
GPAs and first-year retention rates past a certain threshold of frequency and
duration. In addition, GPS is a valid methodology to use because it minimizes
self-selection bias and estimates the potential outcome, GPA and retention
rate, at every possible value of library usage (frequency and duration).
Using the GPS method, future
studies could build on the findings of this study by looking at library usage
and the relative impact on student four-to-six-year graduation rates, library
usage across different academic disciplines, and other populations of library
users, such as faculty and graduate students. Furthermore, future analyses
could triangulate these results by analyzing the effects of library e-resource
and equipment usage, instruction, and participation in library outreach and
engagement activities to gain a more comprehensive understanding of how the
academic library services, spaces, and resources collectively impact student
success.
References
Astin, A. W. (1970). The methodology of research on
college impact, part one. Sociology of Education, 43(3), 223–254.
https://dx.doi.org/10.2307/2112065
Astin, A. W. (1990). Assessment for excellence: The
philosophy and practice of assessment and evaluation in higher education.
New York: Maxwell Macmillan International.
Astin, A. W. (1993). What matters in college?: Four
critical years revisited (1st ed.). San Francisco: Jossey-Bass.
Astin, A. W. (1997). How “good” is your institution’s
retention rate? Research in Higher
Education, 38(6), pp. 647-658. https://dx.doi.org/10.1023/A:1024903702810
Astin, A. W., & Antonio,
A. L. (2012). Assessment for excellence: The philosophy and practice of
assessment and evaluation in higher education. Lanham, MD: Rowman &
Littlefield Publishers.
Barton, D. (2015, September 16). The most important
factor in a college student’s success [Blog post]. Retrieved from https://blogs.wsj.com/experts/2015/09/16/the-most-important-factor-in-a-college-students-success/
Braxton, J. M., Hirschy, A. S., & McClendon, S. A.
(2004). Understanding and reducing college student departure. ASHE-ERIC
higher education report, volume 30, issue 3. Indianapolis: Jossey-Bass, An
Imprint of Wiley.
Cox, B. L., & Jantti, M. (2012, July 17).
Discovering the impact of library use and student performance. EDUCAUSE
Review. Retrieved from http://er.educause.edu/articles/2012/7/discovering-the-impact-of-library-use-and-student-performance
Dawson, A. (2016). Strozier daytime visit feedback
fall 2016 results. Retrieved from https://docs.google.com/document/d/1y8RJdKgnVUvvwmS6dTNHwSOFkqM1IUonq2qvb-enRgo/edit?usp=drive_web&usp=embed_facebook
Donnelly, P. J. (2010). Examining
pre-college academic variables: Investigating future college success. Retrieved from ProQuest
Dissertations & Theses Global. (3398089).
Haddow, G. (2013). Academic library use and student
retention: A qualitative analysis. Library & Information Science
Research, 35(2), 127-136. https://dx.doi.org/10.1016/j.lisr.2012.12.002
Hirano, K., & Imbens, G. W. (2004). The propensity score with continuous treatments. In A.
Gelman & X. L. Meng (Eds.), Applied Bayesian modeling and causal
inference from incomplete-data perspectives (pp. 73–84). John Wiley &
Sons, Ltd.
Holcombe, C., Lukashevich, I., & Alvarez, J.
(2016, July 29). Measuring the effects of increased library use on GPA outcomes
of FSU undergraduates. Symposium on Applied Economics 2016: The Final Presentations for the M.S. in Applied Economics.
Florida State University. Retrieved from https://www.lib.fsu.edu/sites/default/files/sites/default/files/upload/executive_summary.pdf
Imai, K., & van Dyk, D. A. (2004). Causal inference with general treatment regimes. Journal
of the American Statistical Association, 99(467), 854–866.
https://dx.doi.org/10.1198/016214504000001187
Kot, F. C., & Jones, J. L. (2014). The impact of
library resource utilization on undergraduate students’ academic performance: A
propensity score matching design. College & Research Libraries, 76(5), 566-586. https://dx.doi.org/10.5860/crl.76.5.566
Kramer, L. A., & Kramer, M. B. (1968). The college library and the drop-out. College &
Research Libraries, 29(4), 310–312.
Kuh, G. D. (2001). Assessing what really matters to
student learning: Inside the national survey of student engagement. Change:
The Magazine of Higher Learning, 33(3), 10–17. https://dx.doi.org/10.1080/00091380109601795
Kuh, G. D., & Gonyea, R. M. (2003). The role of
the academic library in promoting student engagement in learning. College
& Research Libraries, 64(4), 256–282. https://dx.doi.org/10.5860/crl.64.4.256
Kuh, G. D., Cruce, T. M., Shoup, R., Kinzie, J., &
Gonyea, R. M. (2008). Unmasking the effects of student engagement on first-year
college grades and persistence. The Journal of Higher Education, 79(5),
540–563. https://doi.org/10.1080/00221546.2008.11772116
Kluve, J., Schneider, H., Uhlendorff, A., & Zhao, Z.
(2012). Evaluating continuous training programmes
by using the generalized propensity score. Journal of the Royal Statistical
Society: Series A (Statistics in Society), 175(2), 587–617. https://dx.doi.org/10.1111/j.1467-985X.2011.01000.x
Mezick, E. M. (2007). Return on investment: Libraries
and student retention. The Journal of Academic Librarianship, 33(5),
561–566. https://dx.doi.org/10.1016/j.acalib.2007.05.002
Murray, A., Ireland, A., & Hackathorn, J. (2016).
The value of academic libraries: Library services as a predictor of student
retention. College & Research Libraries, 77(5), 631–642. https://dx.doi.org/10.5860/crl.77.5.631
Oakleaf, M. (2010). The value of academic libraries: A comprehensive research review and
report. Chicago: Association of College and Research Libraries. http://www.ala.org/acrl/sites/ala.org.acrl/files/content/issues/value/val_report.pdf
Pascarella, E. T., & Terenzini, P. T. (1991).
How college affects students: Findings and insights from twenty years of
research. San Francisco: Jossey-Bass Publishers.
Roksa, J., & Whitley, S. E. (2017). Fostering
academic success of first-year students: Exploring the roles of motivation,
race, and faculty. Journal of College Student Development, 58(3),
333–348. https://dx.doi.org/10.1353/csd.2017.0026
Rosenbaum, P. R., & Rubin, D. B. (1983). The central role of the propensity score in
observational studies for causal effects. Biometrika, 70(1),
41–55. https://dx.doi.org/10.2307/2335942
Soria, K. M., Fransen, J., & Nackerud, S. (2013). Library use and undergraduate student outcomes: New
evidence for students’ retention and academic success. Portal: Libraries and
the Academy, 13(2), 147–164. https://dx.doi.org/10.1353/pla.2013.0010
Soria, K. M., Fransen, J., & Nackerud, S. (2014).
Stacks, serials, search engines, and students’ success: First-year
undergraduate students’ library use, academic achievement, and retention. The
Journal of Academic Librarianship, 40(1), 84–91. https://dx.doi.org/10.1016/j.acalib.2013.12.002
Soria, K. M., Fransen, J., & Nackerud, S. (2017a).
Beyond books: The extended academic benefits of library use for first-year
college students. College & Research Libraries, 78(1), 8–22. https://dx.doi.org/10.5860/crl.v78i1.16564
Soria, K. M., Fransen, J, & Nackerud, S. (2017b).
The impact of academic library resources on undergraduates’ degree completion. College
& Research Libraries, 78(6),
812-823. https://dx.doi.org/10.5860/crl.78.6.812
Stemmer, J. K., & Mahan, D. M.
(2016). Investigating the
relationship of library usage to student outcomes. College & Research Libraries, 77(3), 359-375. https://dx.doi.org/10.5860/crl.77.3.359
Stone, G., & Ramsden, B. (2013).
Library impact data project: Looking for the link between library usage and
student attainment. College and Research Libraries, 74(6),
546-559. https://dx.doi.org/10.5860/crl12-406
Strang, T. (2015, July 2). Top four reasons students
use their college library [Blog post]. Retrieved from https://blog.cengage.com/top-four-reasons-students-use-their-college-library
Appendix
Table A1
Summary Statistics
|
Variables |
Mean |
Standard
deviation |
|
|
Output
Variables |
GPA |
3.278 |
0.690 |
|
Retention |
0.957 |
0.204 |
|
|
Environment
(treatment) Variables |
Frequency |
35.066 |
39.705 |
|
Duration |
56.019 |
74.300 |
|
|
Other
Environment Variables |
Military |
0.026 |
0.160 |
|
Athlete |
0.018 |
0.134 |
|
|
Housing |
0.821 |
0.384 |
|
|
CARE |
0.000 |
0.022 |
|
|
Current Load |
12.869 |
1.842 |
|
|
Class |
|||
|
Freshman |
0.711 |
0.453 |
|
|
Sophomore |
0.253 |
0.435 |
|
|
Junior |
0.036 |
0.186 |
|
|
Senior |
0.001 |
0.025 |
|
|
Non-Degree |
0.000 |
0.013 |
|
|
College |
|||
|
Applied
Studies |
0.000 |
0.018 |
|
|
Arts & Sciences |
0.301 |
0.459 |
|
|
Business |
0.150 |
0.357 |
|
|
Communication & Information |
0.046 |
0.210 |
|
|
Criminology |
0.029 |
0.167 |
|
|
Education |
0.021 |
0.143 |
|
|
Engineering |
0.070 |
0.255 |
|
|
Film School |
0.005 |
0.071 |
|
|
Fine Arts |
0.006 |
0.075 |
|
|
Human Sciences |
0.072 |
0.259 |
|
|
Music |
0.027 |
0.163 |
|
|
Nursing |
0.025 |
0.157 |
|
|
Registrar |
0.000 |
0.013 |
|
|
Social Sciences |
0.071 |
0.257 |
|
|
Social Work |
0.006 |
0.078 |
|
|
Undergraduate Studies |
0.146 |
0.353 |
|
|
Visual Arts,
Theatre, & Dance |
0.024 |
0.153 |
|
|
Matriculation Year |
|||
|
2014 |
0.453 |
0.498 |
|
|
2015 |
0.547 |
0.498 |
|
|
Input
Variables |
Age |
20.749 |
0.776 |
|
US Citizen |
0.978 |
0.146 |
|
|
HS GPA |
4.045 |
0.340 |
|
|
ACT |
27.145 |
2.740 |
|
|
Transfer or
Exam Credit |
21.679 |
16.793 |
|
|
Race |
|||
|
White |
0.683 |
0.465 |
|
|
Hispanic/Latino |
0.177 |
0.382 |
|
|
Black/African
American |
0.046 |
0.210 |
|
|
Asian |
0.031 |
0.174 |
|
|
American
Indian/Alaska Native |
0.002 |
0.041 |
|
|
Native Hawaiian/Other Pacific Islands |
0.002 |
0.040 |
|
|
Two or More
Races |
0.041 |
0.199 |
|
|
Not Specified |
0.018 |
0.131 |
|
|
Gender |
|||
|
Female |
0.593 |
0.491 |
|
|
Male |
0.407 |
0.491 |
|
|
Father's Education Level |
|||
|
College |
0.057 |
0.231 |
|
|
High School |
0.028 |
0.165 |
|
|
Middle School |
0.001 |
0.028 |
|
|
Unknown |
0.914 |
0.280 |
|
|
Mother's
Education Level |
|||
|
College |
0.058 |
0.235 |
|
|
High School |
0.024 |
0.153 |
|
|
Middle School |
0.002 |
0.040 |
|
|
Unknown |
0.916 |
0.277 |
|
|
Parent Income Level |
|||
|
< $1000 |
0.008 |
0.091 |
|
|
$1000-$40000 |
0.018 |
0.132 |
|
|
$40000-$75000 |
0.017 |
0.130 |
|
|
$75000-$100000 |
0.013 |
0.114 |
|
|
$100000+ |
0.036 |
0.187 |
|
|
Unknown |
0.907 |
0.290 |
|
Table A2
Estimated Coefficients from the GPS Estimation
|
|
Treatment:
Frequency |
Treatment:
Duration |
|||
|
Covariates |
Estimate |
Std. Error |
Estimate |
Std. Error |
|
|
military |
-0.0713 |
0.1049 |
-0.0987 |
0.1201 |
|
|
athlete |
-0.5749a |
0.1277 |
-0.6429a |
0.1459 |
|
|
housing |
0.0723 |
0.0444 |
0.1100c |
0.0509 |
|
|
CARE |
0.2593 |
0.7719 |
-0.2987 |
0.8878 |
|
|
current load |
0.0319a |
0.0096 |
0.0239c |
0.0110 |
|
|
class.Freshman |
2.3445 |
1.5296 |
1.6594 |
1.6231 |
|
|
class.Sophomore |
2.3328 |
1.5314 |
1.6293 |
1.6253 |
|
|
class.Junior |
2.3246 |
1.5368 |
1.7034 |
1.6319 |
|
|
class.Senior |
2.5368 |
1.6819 |
1.5132 |
1.8105 |
|
|
college.Applied.Studies |
-2.1336c |
1.0327 |
-0.9900 |
1.1066 |
|
|
college.Arts
& Sciences |
0.2616c |
0.1132 |
0.5256a |
0.1298 |
|
|
college.Business |
0.0681 |
0.1180 |
0.3541b |
0.1352 |
|
|
college.Communication
& Information |
0.0556 |
0.1338 |
0.3242c |
0.1533 |
|
|
college.Criminology |
0.0034 |
0.1471 |
0.1712 |
0.1686 |
|
|
college.Education |
-0.1176 |
0.1593 |
-0.0022 |
0.1824 |
|
|
college.Engineering |
0.3619b |
0.1272 |
0.6368a |
0.1459 |
|
|
college.Film.School |
-0.0923 |
0.2603 |
-0.2208 |
0.2986 |
|
|
college.Fine.Arts |
-0.1341 |
0.2564 |
-0.1448 |
0.2934 |
|
|
college.Human.Sciences |
0.2856c |
0.1257 |
0.6087a |
0.1440 |
|
|
college.Music |
-0.2808d |
0.1488 |
-0.5593b |
0.1707 |
|
|
college.Nursing |
0.2225 |
0.1511 |
0.5199b |
0.1731 |
|
|
college.Social.Sciences |
0.2755c |
0.1260 |
0.5308a |
0.1444 |
|
|
college.Social.Work |
0.2448 |
0.2405 |
0.3673 |
0.2756 |
|
|
college.Undergraduate.Studies |
0.0885 |
0.1178 |
0.3144c |
0.1350 |
|
|
MatriculationYearTer.20149 |
-0.1387b |
0.0427 |
-0.1155c |
0.0489 |
|
|
age |
0.0755b |
0.0276 |
0.0652c |
0.0317 |
|
|
US citizen |
-0.1027 |
0.1189 |
-0.0344 |
0.1363 |
|
|
HS GPA |
0.0655 |
0.0591 |
0.0191 |
0.0677 |
|
|
ACT |
-0.0139c |
0.0070 |
-0.0236b |
0.0080 |
|
|
Transfer Or
Exam Credit |
-0.0009 |
0.0019 |
-0.0014 |
0.0022 |
|
|
Race.White |
-0.1113 |
0.1281 |
-0.0075 |
0.1468 |
|
|
Race.Hispanic.Latino |
-0.0377 |
0.1327 |
0.0865 |
0.1522 |
|
|
Race.Black.African.American |
0.0161 |
0.1490 |
0.0765 |
0.1709 |
|
|
Race.Asian |
0.2804d |
0.1585 |
0.3924c |
0.1817 |
|
|
Race.American.Indian.Alaska |
0.1095 |
0.4228 |
0.1406 |
0.4849 |
|
|
Race.Native.Hawaiian.Oth.Pa |
0.2246 |
0.4402 |
0.0388 |
0.5055 |
|
|
Race.Two.or.More.Races |
-0.0897 |
0.1509 |
0.0016 |
0.1730 |
|
|
Gender.Male |
0.1047b |
0.0368 |
-0.0265 |
0.0422 |
|
|
EducationFather.College |
-0.2234 |
0.2676 |
-0.3814 |
0.3063 |
|
|
EducationFather.High.School |
-0.1018 |
0.2706 |
-0.3427 |
0.3098 |
|
|
EducationFather.Middle.School |
-0.6790 |
0.5771 |
-1.3476c |
0.6611 |
|
|
EducationMother.College |
0.1792 |
0.2459 |
0.1591 |
0.2815 |
|
|
EducationMother.High.School |
0.0914 |
0.2560 |
0.0494 |
0.2930 |
|
|
EducationMother.Middle.School |
-0.0591 |
0.4932 |
-0.2111 |
0.5648 |
|
|
ParentIncome....1000 |
0.0774 |
0.2275 |
0.2417 |
0.2605 |
|
|
ParentIncome..1000..40000 |
-0.2691 |
0.2604 |
-0.1351 |
0.2981 |
|
|
ParentIncome..40000..75000 |
-0.0937 |
0.2729 |
0.0781 |
0.3124 |
|
|
ParentIncome..75000.100000 |
-0.3024 |
0.2875 |
-0.0555 |
0.3290 |
|
|
ParentIncome..100000 |
-0.2199 |
0.2579 |
-0.0599 |
0.2952 |
|
aSignificant at
the 0.1% level
bSignificant at
the 1% level
cSignificant at
the 5% level
dSignificant at
the 10% level
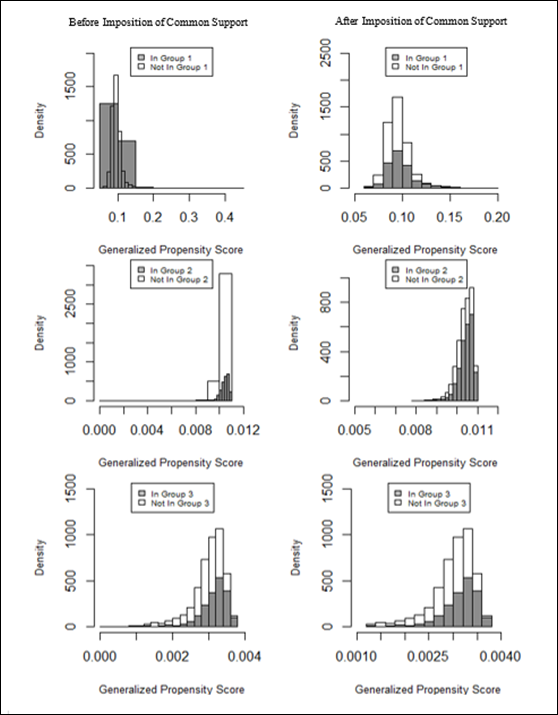
Figure A1
Common support condition for frequency.

Figure A2
Common support
condition for duration.
Table A3
Covariate Balance With and Without Conditioning on ![]()
|
Treatment:
Frequency |
Treatment:
Duration |
|||||||
|
|
Without
Condition |
Condition |
Without
Condition |
Condition |
||||
|
Covariates |
Est |
Std. Error |
Est |
Std. Error |
Est |
Std. Error |
Est |
Std. Error |
|
military |
-1.936 |
3.108 |
0.526 |
3.057 |
-2.772 |
5.784 |
1.440 |
5.688 |
|
athlete |
-14.716a |
3.801 |
-0.301 |
3.864 |
-25.067a |
6.985 |
-0.703 |
7.060 |
|
housing |
1.317 |
1.301 |
-0.655 |
1.285 |
4.120d |
2.422 |
-0.504 |
2.399 |
|
CARE |
11.519 |
22.951 |
-2.977 |
22.564 |
-17.749 |
42.721 |
-1.992 |
41.973 |
|
currentload |
1.118a |
0.270 |
0.075 |
0.275 |
0.892d |
0.503 |
0.028 |
0.498 |
|
class.Freshman |
-0.359 |
1.100 |
-0.267 |
1.080 |
1.943 |
2.046 |
-0.724 |
2.017 |
|
class.Sophomore |
0.657 |
1.147 |
0.267 |
1.127 |
-1.968 |
2.134 |
0.912 |
2.105 |
|
class.Junior |
-1.365 |
2.692 |
0.260 |
2.646 |
-0.424 |
5.000 |
-0.542 |
4.911 |
|
class.Senior |
-5.406 |
19.878 |
-7.218 |
19.525 |
-20.587 |
37.000 |
-7.299 |
36.352 |
|
college.Arts
& Sciences |
4.786a |
1.085 |
0.087 |
1.115 |
8.660a |
2.018 |
0.145 |
2.068 |
|
college.Business |
-3.644b |
1.394 |
-0.120 |
1.390 |
-4.658d |
2.594 |
-0.519 |
2.563 |
|
college.Communication
& Infor |
-4.302d |
2.369 |
0.145 |
2.346 |
-4.382 |
4.410 |
-0.331 |
4.340 |
|
college.Criminology |
-6.015c |
2.996 |
-0.233 |
2.969 |
-11.474c |
5.562 |
0.612 |
5.523 |
|
college.Education |
-9.548b |
3.481 |
0.706 |
3.489 |
-19.332b |
6.455 |
0.973 |
6.487 |
|
college.Engineering |
8.641a |
1.951 |
-0.073 |
2.010 |
11.458b |
3.637 |
-0.691 |
3.666 |
|
college.Film.School |
-6.655 |
7.043 |
-0.487 |
6.930 |
-25.044d |
13.107 |
-0.126 |
12.981 |
|
college.Fine.Arts |
-15.940c |
7.153 |
0.055 |
7.108 |
-33.430b |
12.358 |
-1.315 |
12.331 |
|
college.Human.Sciences |
3.163 |
1.926 |
-0.034 |
1.903 |
13.329a |
3.585 |
1.253 |
3.617 |
|
college.Music |
-11.205a |
3.087 |
0.574 |
3.137 |
-33.874a |
5.820 |
1.200 |
6.247 |
|
college.Nursing |
0.914 |
3.163 |
-0.293 |
3.108 |
6.410 |
5.887 |
-1.413 |
5.806 |
|
college.Social.Sciences |
3.658d |
1.939 |
0.037 |
1.920 |
5.109 |
3.606 |
-0.348 |
3.560 |
|
college.Social.Work |
-1.366 |
6.384 |
-0.835 |
6.270 |
-6.215 |
11.882 |
-0.654 |
11.676 |
|
college.Undergraduate.Studies |
-3.875b
|
1.410 |
0.001 |
1.409 |
-6.168c |
2.622 |
0.457 |
2.613 |
|
MatriculationYearTer.20149 |
-1.728d |
1.002 |
0.089 |
0.991 |
-2.460 |
1.863 |
-0.307 |
1.836 |
|
age |
1.165 d |
0.649 |
0.013 |
0.643 |
1.267 |
1.200 |
-0.483 |
1.184 |
|
UScitizen |
-6.396 d |
3.444 |
0.910 |
3.418 |
-9.033 |
6.389 |
-1.147 |
6.297 |
|
HSGPA |
1.525 |
1.468 |
-0.031 |
1.445 |
-1.398 |
2.734 |
-0.209 |
2.686 |
|
ACT |
-0.168 |
0.182 |
-0.045 |
0.179 |
-1.129a |
0.339 |
-0.029 |
0.341 |
|
Transfer Or
Exam Credit |
0.005 |
0.030 |
0.006 |
0.029 |
-0.054 |
0.055 |
0.016 |
0.054 |
|
Race.White |
-5.577a |
1.069 |
-0.653 |
1.107 |
-9.178a |
1.990 |
-0.937 |
2.038 |
|
Race.Hispanic.Latino |
2.554d |
1.305 |
0.497 |
1.289 |
5.730c |
2.427 |
0.340 |
2.412 |
|
Race.Black.African.American |
4.788c |
2.377 |
0.488 |
2.352 |
7.144 |
4.417 |
1.146 |
4.357 |
|
Race.Asian |
16.637a |
2.869 |
0.482 |
3.049 |
26.383a |
5.344 |
0.283 |
5.561 |
|
Race.American.Indian.Alaska |
8.863 |
11.993 |
0.214 |
11.794 |
7.120 |
22.325 |
-0.085 |
21.932 |
|
Race.Native.Hawaiian.Oth.Pa |
8.661 |
12.578 |
-2.597 |
12.377 |
-6.284 |
23.412 |
-3.421 |
22.996 |
|
Race.Two.or.More.Races |
0.594 |
2.503 |
0.275 |
2.459 |
0.310 |
4.651 |
0.560 |
4.568 |
|
Gender.M |
3.301b |
1.01 |
-0.371 |
1.027 |
-1.505 |
1.888 |
-0.548 |
1.856 |
|
EducationFather.College |
-9.825a |
2.176 |
-0.668 |
2.231 |
-16.136a |
4.041 |
-1.312 |
4.099 |
|
EducationFather.High.School |
-4.732 |
3.063 |
1.153 |
3.034 |
-11.430c |
5.653 |
1.782 |
5.622 |
|
EducationFather.Middle.School |
-18.915 |
19.877 |
-5.248 |
19.546 |
-31.344 |
36.999 |
3.270 |
36.412 |
|
EducationMother.College |
-8.686a |
2.148 |
-0.640 |
2.183 |
-14.549a |
3.989 |
-1.151 |
4.025 |
|
EducationMother.High.School |
-7.704c |
3.304 |
0.271 |
3.290 |
-14.884c |
6.090 |
0.268 |
6.068 |
|
EducationMother.Middle.Scho |
-7.497 |
13.257 |
1.780 |
13.036 |
-11.964 |
26.172 |
7.415 |
25.736 |
|
ParentIncome....1000 |
-0.193 |
5.534 |
-2.504 |
5.438 |
5.859 |
10.301 |
-0.247 |
10.125 |
|
ParentIncome..1000..40000 |
-8.768c |
3.821 |
-0.093 |
3.799 |
-14.877c |
7.113 |
1.502 |
7.072 |
|
ParentIncome..40000..75000 |
-4.059 |
3.822 |
0.459 |
3.766 |
-7.888 |
7.147 |
0.072 |
7.039 |
|
ParentIncome..75000.100000 |
-10.535 |
4.470c |
0.485 |
4.453 |
-17.606c |
8.220 |
-1.511 |
8.146 |
|
ParentIncome..100000. |
-9.337a |
2.719 |
-0.525 |
2.738 |
-16.642a |
5.028 |
-1.055 |
5.052 |
aSignificant at
the 0.1% level
bSignificant at
the 1% level
cSignificant at
the 5% level
dSignificant at
the 10% level
Table A4
Estimated Coefficients of Conditional Distribution
of GPA Given Treatment and GPS
|
Treatment:
Frequency |
Treatment:
Duration |
||||
|
Estimate |
Std. Error |
Estimate |
Std. Error |
||
|
Intercept |
3.0990a |
0.1311 |
Intercept |
3.2390a |
0.0880 |
|
Frequency |
0.0039a |
0.0010 |
Duration |
0.0008c |
0.0003 |
|
Frequency^2 |
0.0000b |
0.0000 |
Duration^2 |
0.0000 |
0.0000 |
|
GPS |
1.9740 |
3.2350 |
GPS |
-2.1390 |
1.7650 |
|
GPS^2 |
-7.1340 |
20.2600 |
GPS^2 |
15.7100d |
9.0180 |
|
Frequency*GPS |
0.1875 |
0.3512 |
Duration*GPS |
0.1173 |
0.3676 |
aSignificant at
the 0.1% level
bSignificant at
the 1% level
cSignificant at
the 5% level
dSignificant at
the 10% level
Table A5
Estimated Coefficients from the GPS Estimation
|
Treatment:
Frequency |
Treatment:
Duration |
|||
|
Covariates |
Estimate |
Std. Error |
Estimate |
Std. Error |
|
GPA |
0.2140a |
0.0283 |
0.2084a |
0.0324 |
|
military |
-0.0586 |
0.1045 |
-0.0911 |
0.1199 |
|
athlete |
-0.6102a |
0.1273 |
-0.6777a |
0.1457 |
|
housing |
0.0482 |
0.0442 |
0.0838 |
0.0507 |
|
CARE |
0.2962 |
0.7687 |
-0.2671
|
0.8852 |
|
current load |
0.0069 |
0.0099 |
-0.0008 |
0.0113 |
|
class.Freshman |
2.3856 |
1.5245 |
1.6851 |
1.6187 |
|
class.Sophomore |
2.3646 |
1.5263 |
1.6456 |
1.6209 |
|
class.Junior |
2.3548 |
1.5316 |
1.7060 |
1.6276 |
|
class.Senior |
2.7508 |
1.6760 |
1.6585 |
1.8056 |
|
college.Applied.Studies |
-2.1790c |
1.0298 |
-1.0332
|
1.1037 |
|
college.Arts
& Sciences |
0.3227b |
0.1131 |
0.5905a |
0.1298 |
|
college.Business |
0.1013 |
0.1176 |
0.3939b |
0.1350 |
|
college.Communication
& Information |
0.0601 |
0.1333 |
0.3383c |
0.1529 |
|
college.Criminology |
0.0301 |
0.1466 |
0.2083 |
0.1682 |
|
college.Education |
-0.1111 |
0.1586 |
0.0170 |
0.1819 |
|
college.Engineering |
0.4516a |
0.1274 |
0.7308a |
0.1463 |
|
college.Film.School |
-0.0267 |
0.2593 |
-0.1574 |
0.2978 |
|
college.Fine.Arts |
-0.2152
|
0.2556 |
-0.2062
|
0.2927 |
|
college.Human.Sciences |
0.3389b |
0.1254 |
0.6642a |
0.1439 |
|
college.Music |
-0.2335
|
0.1483 |
-0.4992b |
0.1703 |
|
college.Nursing |
0.2451 |
0.1506 |
0.5535b |
0.1727 |
|
college.Social.Sciences |
0.2956 |
0.1255 |
0.5550a |
0.1440 |
|
college.Social.Work |
0.3005 |
0.2394c |
0.4239 |
0.2748 |
|
college.Undergraduate.Studies |
0.1287 |
0.1175 |
0.3610b |
0.1348 |
|
MatriculationYearTer.20149 |
-0.1213 |
0.0425 |
-0.1020c |
0.0487 |
|
age |
0.0595c |
0.0276 |
0.0515 |
0.0316 |
|
US citizen |
-0.0978 |
0.1184 |
-0.0327 |
0.1359 |
|
HS GPA |
-0.0619
|
0.0616b |
-0.1012
|
0.0707 |
|
ACT |
-0.0163c |
0.0070 |
-0.0264a |
0.0080 |
|
Transfer Or
Exam Credit |
-0.0003
|
0.0019 |
-0.0007
|
0.0022 |
|
Race.White |
-0.1151 |
0.1275 |
-0.0031 |
0.1464 |
|
Race.Hispanic.Latino |
-0.0488
|
0.1322 |
0.0879d |
0.1517 |
|
Race.Black.African.American |
0.0074d |
0.1484 |
0.0770 |
0.1704 |
|
Race.Asian |
0.2748 |
0.1578 |
0.3960c |
0.1812 |
|
Race.American.Indian.Alaska |
0.1277 |
0.4212 |
0.1675 |
0.4837 |
|
Race.Native.Hawaiian.Oth.Pa |
0.2161 |
0.4384 |
0.0228 |
0.5042 |
|
Race.Two.or.More.Races |
-0.0783 |
0.1503 |
0.0170 |
0.1725 |
|
Gender.Male |
0.1198 |
0.0368 |
-0.0140
|
0.0422 |
|
EducationFather.College |
-0.2083 |
0.2665 |
-0.3705 |
0.3054 |
|
EducationFather.High.School |
-0.0887
|
0.2695 |
-0.3393
|
0.3089 |
|
EducationFather.Middle.School |
-0.5736 |
0.5743 |
-1.2376d |
0.6588 |
|
EducationMother.College |
0.1774 |
0.2449 |
0.1567 |
0.2807 |
|
EducationMother.High.School |
0.0653 |
0.2549 |
0.0233 |
0.2922 |
|
EducationMother.Middle.School |
-0.0353
|
0.4912 |
-0.1828
|
0.5631 |
|
ParentIncome....1000 |
0.1116 |
0.2267 |
0.2785 |
0.2598 |
|
ParentIncome..1000..40000 |
-0.2009
|
0.2596b |
-0.0745
|
0.2975 |
|
ParentIncome..40000..75000 |
-0.0625 |
0.2719 |
0.1074 |
0.3116 |
|
ParentIncome..75000.100000 |
-0.3075
|
0.2864 |
-0.0456
|
0.3281 |
|
ParentIncome..100000. |
-0.1718 |
0.2570 |
-0.0019 |
0.2945 |
aSignificant at
the 0.1% level
bSignificant at
the 1% level
cSignificant at
the 5% level
dSignificant at
the 10% level
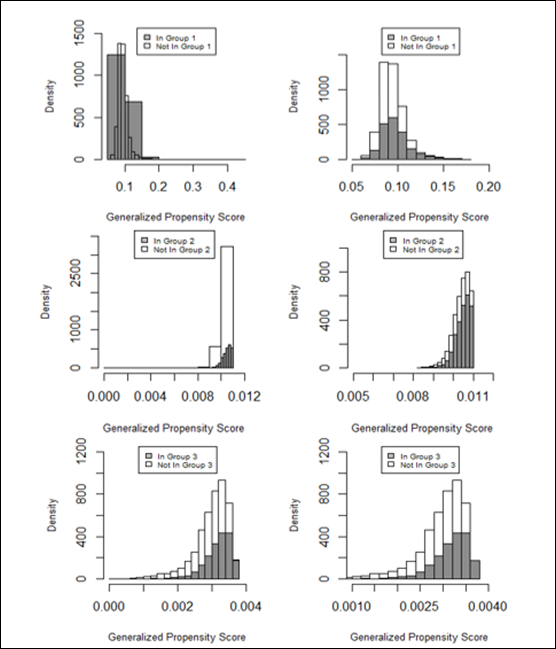
Figure A3
Common support condition for frequency.
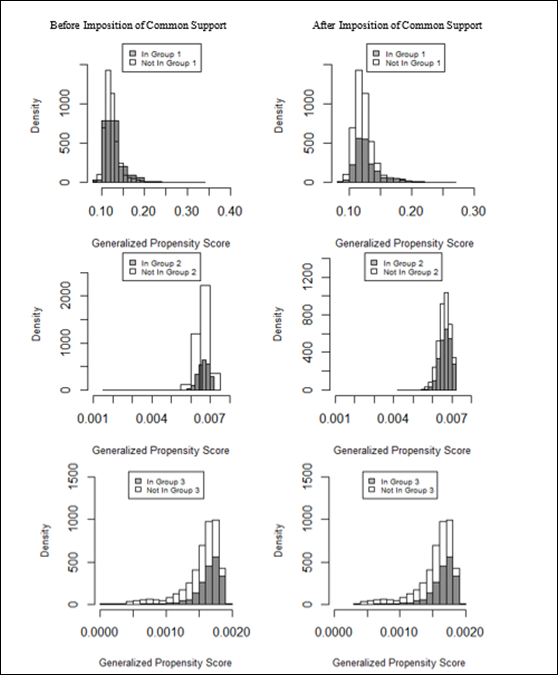
Figure A4
Common support
condition for duration.
Table A6
Covariate Balance With and Without Conditioning on ![]()
|
Treatment: Frequency |
Treatment: Duration |
|||||||||
|
Without Condition |
Condition |
Without Condition |
Condition |
|||||||
|
Covariates |
Est |
Std.
Error |
Est |
Std.
Error |
Est |
Std.
Error |
Est |
Std.
Error |
|
|
|
GPA |
5.674a |
0.727 |
0.327 |
0.781 |
7.768a |
1.350 |
0.429 |
1.395 |
|
|
|
military |
-1.898 |
3.102 |
0.923 |
3.026 |
-2.804 |
5.793 |
2.214 |
5.666 |
|
|
|
athlete |
-15.467a |
3.713 |
-0.152 |
3.721 |
-25.607a |
6.935 |
-0.445 |
6.940 |
|
|
|
housing |
1.262 |
1.299 |
-0.087 |
1.268 |
4.324d |
2.423 |
0.579 |
2.378 |
|
|
|
CARE |
11.556 |
22.913 |
-3.566 |
22.338 |
-17.780 |
42.785 |
-0.885 |
41.806 |
|
|
|
currentload |
1.053a |
0.275 |
0.284 |
0.271 |
0.887d |
0.506 |
0.443 |
0.495 |
|
|
|
class.Freshman |
-0.397 |
1.098 |
-0.143 |
1.069 |
1.966 |
2.050 |
-0.482 |
2.007 |
|
|
|
class.Sophomore |
0.649 |
1.144 |
0.075 |
1.115 |
-1.988 |
2.138 |
0.522 |
2.094 |
|
|
|
class.Junior |
-1.110 |
2.699 |
0.708 |
2.631 |
-0.456 |
5.008 |
0.236 |
4.892 |
|
|
|
class.Senior |
-5.369 |
19.845 |
-14.297 |
19.339 |
-20.618
|
37.056 |
-12.298
|
36.201 |
|
|
|
college.Arts...Sciences |
4.909a |
1.082 |
-0.303 |
1.096 |
8.608a |
2.022 |
-0.461 |
2.049 |
|
|
|
college.Business |
-3.680b |
1.391 |
0.252 |
1.373 |
-4.695d |
2.598 |
-0.191 |
2.552 |
|
|
|
college.Communication...Infor |
-4.263d |
2.365 |
0.465 |
2.319 |
-4.415 |
4.417 |
-0.438 |
4.321 |
|
|
|
college.Criminology |
-5.976c |
2.991 |
0.432 |
2.936 |
-11.501c |
5.570 |
1.372 |
5.493 |
|
|
|
college.Education |
-9.678b |
3.462 |
1.356 |
3.429 |
-19.364b |
6.464 |
1.681 |
6.436 |
|
|
|
college.Engineering |
8.373a |
1.952 |
-0.750 |
1.971 |
11.757b |
3.647 |
-0.627 |
3.637 |
|
|
|
college.Film.School |
-6.618 |
7.031 |
-0.666 |
6.858 |
-25.075d |
13.127 |
0.707 |
12.912 |
|
|
|
college.Fine.Arts |
-17.297b |
6.628 |
0.784 |
6.536 |
-33.462b |
12.376 |
0.447 |
12.255 |
|
|
|
college.Human.Sciences |
3.219d |
1.922 |
-0.502 |
1.884 |
12.929a |
3.587 |
0.253 |
3.585 |
|
|
|
college.Music |
-11.371a |
3.064 |
0.921 |
3.064 |
-33.435a |
5.918 |
2.781 |
6.196 |
|
|
|
college.Nursing |
0.952 |
3.158 |
0.182 |
3.077 |
6.378 |
5.896 |
-1.268 |
5.777 |
|
|
|
college.Social.Sciences |
3.795c |
1.934 |
-0.128 |
1.897 |
5.076 |
3.612 |
-0.439 |
3.543 |
|
|
|
college.Social.Work |
-1.329 |
6.373 |
-2.496 |
6.209 |
-6.246 |
11.900 |
-2.610 |
11.627 |
|
|
|
college.Undergraduate.Studies |
-3.782b |
1.409 |
0.352 |
1.392 |
-6.205c |
2.626 |
0.820 |
2.598 |
|
|
|
college.Visual.Arts..Theatre. |
-5.690d |
3.246 |
-0.013 |
3.178 |
-20.066a |
6.058 |
-0.168 |
6.035 |
|
|
|
MatriculationYearTer.20149 |
-1.807d |
0.999 |
0.134 |
0.979 |
-1.994 |
1.867 |
0.121 |
1.828 |
|
|
|
Age |
1.308c |
0.644 |
0.053 |
0.631 |
1.649 |
1.201 |
-0.155 |
1.178 |
|
|
|
UScitizen |
-6.704c |
3.414 |
2.121 |
3.361 |
-8.449 |
6.398 |
0.951 |
6.274 |
|
|
|
HSGPA |
1.396 |
1.465 |
-0.311 |
1.430 |
-1.224 |
2.737 |
-0.355 |
2.674 |
|
|
|
ACT |
-0.183 |
0.182 |
-0.015 |
0.177 |
-1.161a |
0.339 |
0.058 |
0.339 |
|
|
|
TransferOrExamCredit |
0.004 |
0.030 |
-0.002 |
0.029 |
-0.057 |
0.055 |
0.002 |
0.054 |
|
|
|
Race.White |
-5.593a |
1.067 |
-0.339 |
1.083 |
-9.155a |
1.994 |
-0.598 |
2.016 |
|
|
|
Race.Hispanic.Latino |
2.671c |
1.303 |
0.303 |
1.276 |
5.693c |
2.431 |
-0.392 |
2.402 |
|
|
|
Race.Black.African.American |
4.739c |
2.369 |
0.602 |
2.319 |
6.910 |
4.417 |
1.316 |
4.327 |
|
|
|
Race.Asian |
16.431a |
2.871 |
-0.979 |
2.975 |
27.114a |
5.392 |
0.059 |
5.520 |
|
|
|
Race.American.Indian.Alaska |
8.900 |
11.973 |
1.262 |
11.673 |
7.089 |
22.358 |
1.818 |
21.843 |
|
|
|
Race.Native.Hawaiian.Oth.Pa |
8.698 |
12.556 |
-3.485 |
12.251 |
-6.315 |
23.448 |
-2.985 |
22.905 |
|
|
|
Race.Two.or.More.Races |
0.508 |
2.494 |
0.468 |
2.430 |
0.277 |
4.658 |
1.287 |
4.550 |
|
|
|
Gender.M |
3.468a |
1.012 |
-0.257 |
1.008 |
-1.556 |
1.892 |
0.040 |
1.851 |
|
|
|
EducationFather.College |
-9.672a |
2.170 |
-0.011 |
2.185 |
-16.042a |
4.053 |
-0.649 |
4.066 |
|
|
|
EducationFather.High.School |
-5.033d |
3.032 |
1.256 |
2.975 |
-11.238c |
5.678 |
2.428 |
5.603 |
|
|
|
EducationFather.Middle.School |
-18.878
|
19.843 |
-5.654 |
19.347 |
-31.375
|
37.055 |
3.601 |
36.254 |
|
|
|
EducationMother.College |
-8.656a |
2.136 |
-0.218 |
2.136 |
-14.566a |
3.995 |
-0.715 |
3.990 |
|
|
|
EducationMother.High.School |
-7.534c |
3.299 |
0.959 |
3.248 |
-14.423c |
6.139 |
1.349 |
6.069 |
|
|
|
EducationMother.Middle.Scho |
-7.460 |
13.235 |
1.873 |
12.904 |
-11.995 |
26.211 |
7.913 |
25.629 |
|
|
|
ParentIncome....1000 |
0.682 |
5.473 |
-2.517 |
5.335 |
4.650 |
10.220 |
-2.945 |
9.992 |
|
|
|
ParentIncome..1000..40000 |
-8.851c |
3.815 |
0.328 |
3.752 |
-14.909c |
7.124 |
2.560 |
7.033 |
|
|
|
ParentIncome..40000..75000 |
-4.022 |
3.816 |
0.834 |
3.727 |
-7.920 |
7.157 |
0.953 |
7.011 |
|
|
|
ParentIncome..75000.100000 |
-10.584c |
4.435 |
1.780 |
4.375 |
-17.638c |
8.232 |
-0.373 |
8.106 |
|
|
|
ParentIncome..100000. |
-9.479a |
2.702 |
-0.412 |
2.682 |
-16.324b |
5.058 |
-1.122 |
5.023 |
|
|
aSignificant at
the 0.1% level
bSignificant at
the 1% level
cSignificant at
the 5% level
dSignificant at
the 10% level
Table A7
Estimated Coefficients of Conditional Distribution of GPA Given Treatment
and GPS
|
Treatment:
Frequency |
Treatment:
Duration |
||||
|
|
|
||||
|
Estimate |
Std. Error |
Estimate |
Std. Error |
||
|
Intercept |
5.2350a |
0.9633 |
Intercept |
3.0600a |
0.6626 |
|
Frequency |
0.0127 |
0.0083 |
Duration |
0.0148a |
0.0028 |
|
Frequency^2 |
0.0000 |
0.0000 |
Duration^2 |
0.0000b |
0.0000 |
|
GPS |
-53.1700c |
24.3100 |
GPS |
17.2900 |
12.1200 |
|
GPS^2 |
366.7000c |
161.7000 |
GPS^2 |
-123.1000c |
55.9100 |
|
Frequency*GPS |
-8.7860a |
2.6010 |
Duration*GPS |
-4.1490 |
2.9280 |
aSignificant at
the 0.1% level
bSignificant at
the 1% level
cSignificant at
the 5% level
dSignificant at
the 10% level