Introduction
In 2009, Loyola Marymount University
opened its Doheny Information Commons as part of the
new William H. Hannon Library. The
Hannon Library is open 24/5 with free wireless and a liberal food and drink
policy. The first floor of the library features a café, the circulation desk,
lockers with electrical outlets, four walk-up computers, library classrooms,
reference stacks, and an information commons with 80 computers, 3 enclosed
presentation practice rooms, and an Information Desk for reference and basic
technology and printing help. Throughout the second and third floors are over
30 enclosed group study rooms that can be reserved online. The second floor
features a branded service desk for IT support, device repair, and equipment
checkout, a popular reading collection, print periodicals stacks, carrels for
both media and individual study, and book stacks. The third floor is the
designated quiet floor and features exhibit space, Archives and Special
Collections, individual study carrels and group tables, a faculty commons and
faculty technology sandbox, a large multi-purpose room, and book stacks.
The Doheny
Information Commons space met Bailey & Tierney’s (2008) traditional
definition of an information commons by featuring 80 computers as “single
workstation(s) with access to traditional
library services and productivity resources in a high-technology-rich
environment” (p. 2). Furthermore,
the library intended it to cater to the millennial student, who needs space
conducive to social learning, collaboration, and group activities (Lippincott,
2012). The same year the new space opened, Ross Housewright
(2009) warned that academic libraries were “at risk of losing their functional
relevance and fading to primarily symbolic importance” if they failed to adapt
to the changing information environment (p. 254). Additionally, Housewright asserted that it is important to align with the
changing needs of students and faculty by “redeploy(ing)
resources flexibly” (p. 259). The mission of the new commons was to support
academic life at LMU, but how long might it be until it was no longer offering
optimal support?
In
2013, the library strategic plan called for post-occupancy planning of emerging
space utilization needs in the public areas of the library. This reflects
Lippincott’s (2012) advice that “it
is important to collect information on the actual needs of students and not
just on needs perceived by librarians” (p. 540). The question for any
institution that has set up a new space as an information or learning commons
is aptly summed up by librarians from Harrisburg University of Science and
Technology: “We need to explore ways of assessing the extent to which learning
commons services and resources help students succeed as self-directed learners”
(Adams & Young, 2010, p. 159). We designed the study described in this article
to address the question of whether an information commons, after six years, was
still optimally supporting students’ academic life in a rapidly changing
environment.
Literature
Review
Published
research on the design and use of library spaces, especially for the purposes
of assessment and planning (or re-planning), has appeared regularly in the
second decade of the 21st century. This research has been framed
often in the context of paradigm changes that appear with each generation of
new libraries, as set out by the frequently cited university librarian emeritus
at Yale, Scott Bennett (2008, 2009). The most recent shift is identified as
“learning-centered,” with spaces in new and renovated libraries dedicated as
either learning or information commons, and Bennett (2009) calls on his
profession “to launch a design practice centered on learning” (p. 194). An
entire library might become a university’s information commons (Hisle, 2005), or through new additions or renovation
libraries could now contain “a flexible, reconfigurable space that is sized to
a reasonable subpopulation of students and equipped with group learning spaces
as appropriate” (Beagle, Tierney, & Bailey, 2006, p. 9). Neither the name
nor the space came to have a consistent definition or execution, but on the
whole this situation has not impeded the beneficial results for libraries or
librarianship (Bonnand & Donahue, 2010).
Even
as Beagle and others were contributing the vision and summing up the new
library spaces, their colleagues in the field had begun the research into
library spaces and users that would soon create a substantial body of research
with a broad spectrum of methodologies. These ranged from quantitative,
intensive seat counts (Dotson & Garris, 2008) to
the purely creative setting of the design charrette (Oliveira, 2016; Washburn
& Bibb, 2011). Some early studies used a quantitative approach with direct
observation sweeps (Applegate, 2009; Dotson & Garris,
2008; Given & Leckie, 2003) and simple paper
questionnaires (Gardner & Eng, 2005). These two
modes of quantitative data collection look at what users do, on the one hand,
and try to get at what users want and expect, on the other. This mixture of
direct observation combined with questionnaires created a key set of studies
(Holder & Lange, 2014; İmamoğlu & Gürel, 2016; May & Swabey,
2015; McCrary, 2017).
However,
the need to acquire data about both of these important aspects of library
spaces has, on the whole, led to research that uses two or more modes of
collection and often more than one methodological approach. Ethnographic
techniques have been popular, either as the sole approach (Bedwell
& Banks, 2013), or as part of a mixed method toolkit, such as a combination
of video observation, the NSSE, and user surveys (Webb, Schaller, & Hunley, 2008). Even larger mixes of methods have brought
together the quantitative survey, focus groups, filmed interviews, and
student-made films (Cowan, 2012), or time-lapse photography, unobtrusive
observation, and random-sampled surveys (Asher, 2017). However, “ethnography is
a complicated and time-consuming research method” (Khoo,
Rozaklis, & Hall, 2012, p. 82).
The
majority of research in this literature review looked at the use of space or
the behaviour of users in library spaces generally, with
a minority dedicated to pre-occupancy assessment for design (23%), or
post-occupancy assessment (18%). Further, not all of the latter had as their
subject a designated commons or similar space. Some research focused solely on
measures or ideal attributes of library or commons space. Cha & Kim (2015)
used surveys of academic library users in the Netherlands, while the TEALS
standard was the product of another (Abbasi, Elkadi, Horn, & Owen, 2012). Only two longitudinal
studies exist (Fox & Doshi, 2017; Montgomery,
2014). We believe that our research makes a strong contribution to this
important post-occupancy category of library space assessments and data.
Another
gap that we identified is that of studies that provide detailed data on use of
the computers and devices that are the key components of the information
commons model. Even though the quantitative approach predominates in the
research under review (about 42%, with an additional 37% if mixed-method
research is added), and direct observation is frequently employed, only two
studies (5%) included observation of the screen itself: that is, what the users
were actually doing on their computers and devices while they were in the
library. To answer the question of what students “really do” in the library, Paretta & Catelano (2013)
used direct observation at two sites. These researchers did not look at space
use or other factors, but do provide highly detailed data on print vs.
computer, and academic activity vs. leisure activity. The one other study also
utilized direct observation, and set out to analyze the use of a particular
library space (not a commons), but didn’t provide any detail about the
frequency of academic vs. leisure use of technology (Faletar
Tanackovic, Lacović, & Gašo, 2014).
Is
there a developing evidence base of common findings among space studies? The
preponderance of users working on their own has been frequently found (Bryant,
Matthews, & Walton, 2009; Crook & Mitchell, 2012; Ferria
et al., 2017; Holder & Lange, 2014; Thomas, Van Horne, Jacobson, &
Anson, 2015). One ethnographic study highlighted single users “appropriating”
group tables by spreading out personal items (Bedwell
& Banks, 2013, p. 12). On the other hand, if group space is not provided,
it will be improvised (Hursh & Avenarius, 2013; Webb, Shaller,
& Hunley, 2008).
The
research is not clear about other elements of expectations for library spaces,
however. Students still value and prefer a quiet library, despite predictions
about upcoming generations, but what constitutes excess or distracting noise
appears to be contextual (Cowan, 2012; Crook & Mitchell, 2012; Faletar Tanackovic, Lacović, & Gašo, 2014; Khoo, Rozaklis, Hall, & Kusunoki,
2017; McCaffrey & Breen, 2016; Newcomer, Lindahl,
& Harriman, 2016; Regalado & Smale, 2015;
Suarez, 2007). Even very recent studies suggest that “students consider the
quiet communal spaces integral to their experience of the library” (Yoo-Lee, Lee, & Velez, 2013, p. 509).
Furniture
is another component of the information commons that some writers thought would
need to depart from traditional library practices (Hisle,
2005). This may not entirely be the case. More than a few studies indicate that
the ideal workspace may be “a big desk,” that is, rectangular, no-frills
tables, or the old-fashioned carrel (Hall & Kapa 2017). Arguably, “space in
which to spread themselves and their belongings out” (Washburn & Bibb,
2011) is the feature in question, rather than the furniture itself. Not all the
data agrees. Ferria et al. (2017) found booths popular,
and Webb, Schaller, & Hunley (2008) found 60% of
respondents split between wanting tables and a preference for soft seating.
Aims
In 2009, this new library had opened
with a “perfect” Information Commons space designed to support the millennial student.
After six years, our aim was to see if students were utilizing the Information
Commons in unexpected ways and deviating from the anticipated “millennial”
behavior for which we had built it. We designed our post-occupancy study to
answer the following research questions:
·
What areas of the Information
Commons do students really use or not use?
·
What furniture configurations are
preferred?
·
What mix of technology, resources,
and activities are students engaged with inside of the space?

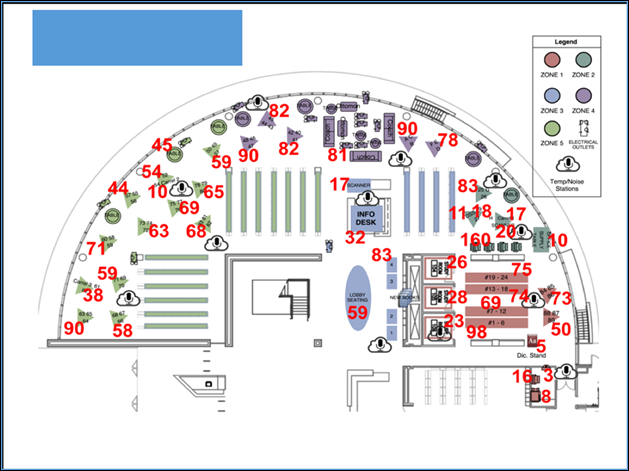
Figure 1
Observation zones of the Information Commons.
We found that 67 respondents (27%) in the survey said
they were eating or drinking, which we directly observed 695 times (33%). The
users’ concerns with eating and drinking while at work appeared in survey and
whiteboard poll responses, where 24 comments suggested improvements such as
snack vending machines, a water bottle refilling station, or a designated food
zone. There were eight users who said that there should be less trash and food.
Respondents
self-reported utilizing a library computer 169 times (68%) for email and 149
times (60%) for myLMUConnect, while only 119 people
(48%) reported using a library computer for productivity software and 102
people (41%) for library resources (see Figure 4). The only significant usage
captured through direct observation was productivity software, observed 885
times (42%). Users reported frequently multi-tasking with additional devices
while they used the library computers, including smart phones 126 times (51%),
headphones 99 times (40%), and laptops 94 times (38%) (See Figure 5). Direct
observation noted these devices, although less frequently. Both methods found
tablets very little used.

Figure 6
Average temperature and average noise level.
Environment
The
average temperature was between 72 and 75 degrees Fahrenheit (see Figure 6)
across all 5 zones, but there was variation. In zone 5, it got as low as 67
degrees, and in zone 2 as low as 67.5 degrees. There were nine respondents who
commented either in the patron survey or the whiteboard polls that the
temperature was too cold (see Appendix G). The average decibel level was
between 50 and 55, but there was also wide variation. In zone 3, observers
recorded up to 76.8 dBA. Zones two and three were the
noisiest because of their proximity to the printers and the lobby and
Information Desk. There were 32 students who commented that it was too loud and
that there should be a designated “no talking” and “no cell phones” area.
Remarkably, there were 161 reports of unattended belongings also observed, most
frequently after 9 p.m. We also observed several broken power outlets,
prompting users to plug into more distant outlets to compensate, creating a
trip hazard. Of the observations in zone
5, broken lights were observed 16 (13%) times, and 4 students commented it
needed to be brighter.
Discussion and Outcomes
Although the
planners and architects designed the Information Commons as a collaborative,
social learning space, the results of the study indicate that students want
quiet, privacy, and space to spread out, along with cleanliness. Since we only
observed 1412 (67%) students actually using a library computer (often they were
using their own devices while sitting at a computer workstation), we determined
that they could benefit from study space not tied to a desktop computer. We
opened up more study space in the Information Commons in the summer of 2016 by
emptying underutilized reference stacks and replacing them with over 30
additional seats (large rectangular tables and chairs). In the summer of 2017,
we installed floor-box power outlets to go along with this new seating.
We also made
a handful of small improvements based on the study, including the installation
of self-serve dispensers with wipes for cleaning keyboards and tabletops. We
worked with IT and Facilities to set up an inventory for outlets, Ethernet
ports, and light fixtures that could be checked regularly. Responding to
comments in our surveys, we made sure to supply new iMac mice, installed a new
water bottle filling station, and relocated one printer to the far side of the
Information Commons. Another upcoming change will be to install bag hooks
underneath the computer workstations that are close together to offer more
space.
Even
though our study established that a majority of our users preferred library
computer workstations with privacy and space to spread out, we still had a gap
in knowledge about other furniture preferences. As Bieraugel
& Neill (2017) point out in an article applying Bloom’s taxonomy to library
spaces and creativity, it is important to design learning spaces for different
intended behaviors (p. 37). They determined, for example, that quiet study
space and computer labs support reflection, but on the other hand communal
tables support networking (p.48).
There were 28 respondents who suggested napping pods, newer
furniture, more desk space, and more comfort during our study. We therefore
undertook a furniture survey done in spring 2017 to gather more information.
This follow-up research revealed that for tables and chairs without a library
computer, 103 respondents (54%) preferred 4 chairs facing each other because
this was conducive to studying or homework, collaboration, and offered space
for their belongings (see Table 1). A great majority, 148 (78%), preferred a
rectangular table shape. Therefore, we rearranged the new seating into
rectangular tables with four chairs facing each other.
The furniture survey asked about
preferences for doing additional specific activities. For working alone, 99
students (52%) preferred the S-Divider, while 74 (39%) preferred a carrel. Beyond
the obvious factor of privacy, those choosing the S-Divider mentioned comfort
and aesthetics as important factors, while those choosing a carrel mentioned a
good writing surface. When asked about their preference for collaborating, 89
(47%) chose an enclosed booth for privacy and its seating configuration, while
72 (38%) chose a high-back booth for its seating configuration and comfort.
This seating configuration is consistent with the preference for the table and
chair configuration as four chairs facing each other. For lounge furniture, 87
respondents (46%) preferred a high-back couch with coffee table, while 70 (37%)
preferred an armchair and coffee table. Comfort was an important factor behind
both choices, while those opting for the high-back couch also mentioned
aesthetics. We were able to put this recommendation to use in the spring of
2017 when we replaced the low-back couches in the first floor lobby area with
armchairs and coffee tables. We plan to make future strategic budget requests
for furniture based on these preferences.
To address
the general noise problem in the Information Commons, we consulted with Newson
Brown Acoustics, LLC. They suggested an electrical sound masking system to make
background noise or white noise. Other suggestions included sound baffles,
adding physical barriers between workstations, or designating certain areas for
quiet vs. social and putting up signage. Also, our follow-up furniture survey
found that 86 respondents (45%) preferred to take a phone call in a soundproof
phone booth because it offered privacy and quiet. These are similar to possible
solutions found in the literature: McCaffrey and Breen (2016) found evidence
that “interventions such as the development of a noise policy, zoning,
rearranging of furniture, removal of service points from reader spaces, and
structural improvements to reduce noise travel are worthwhile interventions for
libraries to consider when faced with noise problems” (p. 788).
Limitations
The direct
observation methodology had limitations. If users had multiple browsers open
during the direct observations, we only recorded what was in the open window on
their screen at that moment in time. It was also difficult to be discreet when
observing users; we recorded “can’t tell” for what purpose they were using a
library computer on 527 (25%) of the direct observations. Some students failed
to take the whiteboard polling methodology seriously and left facetious
answers. Another limitation was the lack of real measurement of users’ true
level of collaboration during a seating sweep since it provides only a snapshot
in time rather than an ethnography. A limitation to the follow-up furniture
survey came with it being online only, and therefore we recruited only those
using a computer or device. The final limitation was that all observation and
survey instruments were limited to the Information Commons space. We therefore
have data only from those who we found in that space, but no data from those
who, from choice or other circumstance, were not in that space. We don’t know
who chose not to be there, or who wanted to be there but couldn’t, and the
insights those groups of users might have provided.
Conclusions
This mixed
methods case study explored the usage, satisfaction, and preferences of users in the Hannon
Library Information Commons. Independent study
dominated the space usage. Students valued spaciousness, quiet, privacy, and a
clean environment. Students frequently multi-tasked with additional devices as
they simultaneously used a library computer, including cell phones, headphones,
and laptops. Also, unattended belongings were frequently observed along with
broken electrical outlets. The study paved the way for improvements and the
partial redesigning of the space. Even though our study confirmed some findings
from other studies, including a preference for working alone and the desire for
quiet, it is important for each library to conduct its own assessment because “one size does
not fit all academic libraries” and “designs will, and should be, different on
every campus” (Head, 2016, p. 26).
Acknowledgements
The authors wish to acknowledge contributions by the following
colleagues: LMU Library Reference & Instruction Department (Elisa Slater
Acosta, Jennifer Masunaga, Desirae Zingarelli-Sweet, Lindsey McLean, Nataly Blas, Kathryn Ryan,
Aisha Conner-Gaten), Burney Wong, Denise Blanchet,
Katherine Donaldson, Rachel Deras, Angie So, Javier
Garibay, 2015 LMU Library Assessment Committee, LMU Library Information Commons
student workers, LMU LAC Group overnight staff, and Laura Massa.
References
Abbasi, N., Elkadi, H.,
Horn, A., & Owen, S. (2012, October). TEALS (Tool for Evaluation of
Academic Library Spaces) project :
Evaluating physical library spaces. Presented at the Library Assessment
Conference: Building effective, sustainable, practical assessment,
Charlottesville, VA. Retrieved from http://dro.deakin.edu.au/view/DU:30048261
Adams, N. E., & Young, J. B. (2010). Users
learning from users: Building a learning commons from the ground up at a new
university. College & Undergraduate Libraries, 17(2–3),
149–159. https://doi.org/10.1080/10691316.2010.481607
Applegate, R. (2009). The library is for studying:
Student preferences for study space. Journal of Academic Librarianship, 35(4),
341–346. https://doi.org/10.1016/j.acalib.2009.04.004
Asher, A. D. (2017). Space use in the commons:
Evaluating a flexible library environment. Evidence Based Library &
Information Practice, 12(2), 68–89. https://doi.org/10.18438/B8M659
Bailey, D. R., & Tierney, B. G. (2008). Transforming
library service through information commons: case studies for the digital age.
Chicago: American Library Association.
Beagle, D. R., Tierney, B. G., & Bailey, D. R.
(2006). The information commons handbook. New York: Neal-Schuman
Publishers.
Bedwell, L., & Banks, C. (2013). Seeing through the eyes of students: Participant
observation in an academic library. Partnership: The Canadian Journal of
Library & Information Practice & Research, 8(1), 1-17. https://doi.org/10.21083/partnership.v8i1.2502
Bennett, S. (2008). The information or the learning
commons: which will we have? Journal of Academic Librarianship, 34(3),
183–185. https://doi.org/10.1016/j.acalib.2008.03.001
Bennett, S. (2009). Libraries and learning: a history
of paradigm change. portal: Libraries and
the Academy, 9(2), 181–197. https://doi.org/10.1353/pla.0.0049
Bieraugel, M., & Neil, S. (2017). Ascending Bloom’s
Pyramid: Fostering student creativity and innovation in academic library
spaces. College & Research Libraries, 78(1), 35-52. https://doi.org/10.5860/crl.78.1.35
Bonnand, S., & Donahue, T. (2010). What’s in a name? The
evolving library commons concept. College & Undergraduate Libraries,
17(2–3), 225–233. https://doi.org/10.1080/10691316.2010.487443
Bryant, J., Matthews, G., & Walton, G. (2009).
Academic libraries and social and learning space: A case study of Loughborough
University Library, UK. Journal of Librarianship and Information Science,
41(1), 7–18. https://doi.org/10.1177/0961000608099895
Cha, S. H., & Kim, T. W. (2015). What matters for students’ use of physical library
space? Journal of Academic Librarianship, 41(3), 274–279. https://doi.org/10.1016/j.acalib.2015.03.014
Cowan, S. M. (2012). Assessment 360: Mapping
undergraduates and the library at the University of Connecticut. Storrs,
CT: University of Connecticut Libraries. Retrieved from https://www.clir.org/pubs/resources/Assessment360.pdf
Crook, C., & Mitchell, G. (2012). Ambience in
social learning: student engagement with new designs for learning spaces. Cambridge
Journal of Education, 42(2), 121-139. https://doi.org/10.1080/0305764X.2012.676627
Dotson, D. S., & Garris,
J. B. (2008). Counting more than the gate: Developing
building use statistics to create better facilities for today’s academic
library users. Library Philosophy & Practice, Sep2008, 1–13.
Faletar Tanackovic, S., Lacović, D., & Gašo, G.
(2014). Student use of library physical spaces: Unobtrusive observation of
study spaces in an academic library. Libraries
in the Digital Age (LIDA) Proceedings, 13. Retrieved from http://ozk.unizd.hr/proceedings/index.php/lida/article/view/114/116
Ferria, A., Gallagher, B. T., Izenstark,
A., Larsen, P., LeMeur, K., McCarthy, C. A., & Mongeau, D. (2017). What are they doing anyway?: Library as place and student use of a university library.
Evidence Based Library and Information Practice, 12(1), 18–33. http://dx.doi.org/10.18438/B83D0T
Fox, R., & Doshi, A.
(2017). Longitudinal assessment of “user-driven” library commons spaces. Evidence
Based Library and Information Practice, 8(2), 85–95. http://dx.doi.org/10.18438/B8761C
Gardner, S., & Eng, S.
(2005). What students want: Generation Y and the changing function of the
academic library. portal: Libraries and the
Academy, 5(3), 405–420. https://doi.org/10.1353/pla.2005.0034
Given, L.
M., & Archibald, H. (2015). Visual traffic sweeps (VTS): A research method
for mapping user activities in the library space. Library and Information
Science Research, 37(2), 100-110. http://doi.org/10.1016/j.lisr.2015.02.005
Given, L. M., & Leckie,
G. J. (2003). “Sweeping” the library: Mapping the social activity space of the
public library. Library and Information Science Research, 25(4),
365–385. https://doi.org/10.1016/S0740-8188(03)00049-5
Hall, K., & Kapa, D. (2017). Silent and
independent: Student use of academic library study space. Partnership: The
Canadian Journal of Library and Information Practice and Research, 10(1),
1-38. https://doi.org/10.21083/partnership.v10i1.3338
Halling, T. D., & Carrigan, E.
(2012). Navigating user feedback channels to chart an evidence based course for
library redesign. Evidence Based Library and Information Practice, 7(1),
70–81. https://doi.org/10.18438/B81W35
Head, A. J. (2016). Planning and designing academic
library learning spaces: Expert perspectives of architects, librarians, and
library consultants. Seattle, Washington: The University of Washington
Information School.
Hewson, C.
(2006). Mixed Methods Research. In V. Jupp (Ed.), The
SAGE dictionary of social research methods London: Sage. http://doi.org/10.4135/9780857020116
Hisle, W. L. (2005). The changing role of the library in the academic
enterprise. Presented at the 12th ACRL National Conference.
Minneapolis, MN. Retrieved from http://www.ala.org/acrl/sites/ala.org.acrl/files/content/conferences/pdf/hisle05.pdf
Holder, S., & Lange, J. (2014). Looking and
listening: A mixed-methods study of space use and user satisfaction. Evidence
Based Library & Information Practice, 9(3), 4-27. https://doi.org/10.18438/B8303T
Housewright, R. (2009). Themes of change in corporate libraries:
Considerations for academic libraries. portal:
Libraries and the Academy, 9(2), 253–271. https://doi.org/10.1353/pla.0.0048
Hursh, D. W., & Avenarius, C. B. (2013). What
do patrons really do in music libraries? An ethnographic approach to improving
library services. Music Reference Services Quarterly, 16(2),
84-108. https://doi.org/10.1080/10588167.2013.787522
İmamoğlu, Ç., & Gürel, M. Ö. (2016). “Good fences make good neighbors”:
Territorial dividers increase user satisfaction and efficiency in library study
spaces. The Journal of Academic Librarianship, 42(1), 65–73. https://doi.org/10.1016/j.acalib.2015.10.009
Khoo, M., Rozaklis, L., & Hall, C. (2012). A survey of the use of ethnographic methods in the
study of libraries and library users. Library & Information Science
Research, 34(2), 82–91. https://doi.org/10.1016/j.lisr.2011.07.010
Khoo, M., Rozaklis, L., Hall, C., & Kusunoki,
D. (2017). “A really nice spot”: evaluating place, space, and technology in
academic libraries. College & Research Libraries, 77(1),
51-70. https://doi.org/10.5860/crl.77.1.51
Kitchenham, A. D. (2010). Mixed methods in
case study research. In A. J. Mills, G. Durepos, & E. Wiebe (Eds.), Encyclopedia of case
study research. Los Angeles, Calif.: Sage.
Lippincott, J. K. (2012). Information commons: Meeting
millennials’ needs. Journal of Library Administration, 50(1),
27–37. http://dx.doi.org/10.1080/01930826.2012.707950
May, F., & Swabey, A.
(2015). Using and experiencing the academic library: A multisite observational
study of space and place. College & Research Libraries, 76(6),
771-795. https://doi.org/10.5860/crl.76.6.771
McCaffrey, C., & Breen, M. (2016). Quiet in the
library: An evidence-based approach to improving the student experience. portal: Libraries and the Academy, 16(4),
775–791. https://doi.org/10.1353/pla.2016.0052
McCrary, Q. D. (2017). Small library research: Using
qualitative and user-oriented research to transform a traditional library into
an information commons. Evidence Based Library and Information Practice,
12(1), 34–49. http://dx.doi.org/10.18438/B8863F
Montgomery, S. E. (2014). Library space assessment:
User learning behaviors in the library. Journal of Academic Librarianship,
40(1), 70–75. https://doi.org/10.1016/j.acalib.2013.11.003
Newcomer, N. L., Lindahl, D., & Harriman, S. A.
(2016). Picture the music: Performing arts library
planning with photo elicitation. Music Reference Services Quarterly, 19(1),
18. https://doi.org/10.1080/10588167.2015.1130575
Oliveira, S. M. (2016). Space preference at James
White Library: What students really want. Journal
of Academic Librarianship 42(4), 355–367. https://doi.org/10.1016/j.acalib.2016.05.009
Paretta, L. T., & Catalano, A. (2013). What students really do in the library: An
observational study. Reference Librarian, 54(2),
157-167. https://doi.org/10.1080/02763877.2013.755033
Regalado, M., & Smale,
M. A. (2015). “I am more productive in the library because it’s quiet”:
Commuter students in the college library. College & Research Libraries,
76(7), 899. https://doi.org/10.5860/crl.76.7.899
Simons, H.
(2009). Case study research in practice. Los Angeles:
Sage.
Suarez,
D. (2007). What students do when they study in the
library: Using ethnographic methods to observe student behavior. Electronic
Journal of Academic & Special Librarianship, 8(3).
Thomas, B., Van Horne, S., Jacobson, W.,
& Anson, M. (2015). The design
and assessment of the Learning Commons at the University of Iowa. The
Journal of Academic Librarianship, 41(6), 804–813. https://doi.org/10.1016/j.acalib.2015.09.005
Washburn, A., & Bibb, S. C. (2011). Students
studying students: An assessment of using undergraduate student researchers in
an ethnographic study of library use. Library & Information Research,
35(109), 55–66.
Webb, K. M., Schaller, M. A., & Hunley, S. A. (2008).
Measuring library space use and
preferences: Charting a path toward increased engagement. portal:
Libraries and the Academy, 8(4), 407-422. http://doi.org/10.1353/pla.0.0014
Yoo-Lee, E., Lee, T. H., & Velez,
L. (2013). Planning library spaces and services for
Millennials: an evidence-based approach. Library Management, 34(6),
498-511. https://doi.org/10.1108/LM-08-2012-0049
Appendix A
Direct Observation Form
Individual Patron
Activity Drop Down Menus
What day of the
week is your shift?
o Monday
o Tuesday
o Wednesday
o Thursday
o Friday
o Saturday
o Sunday
What time of the
day is your shift?
o Morning (9a-noon)
o Afternoon (1-4p)
o Evening (5-8pm)
o Late Night (after
9pm)
You are going to
mark/record the activities of each person in your zone. Fill out one form for
each person. First, select your Zone. Then select the approximate area in the
zone for the location of the person you wish to record.
Are there
unattended belongings in the space (belongings, but no person present)?
o Yes
o No
What is the gender
of the person?
o Male
o Female
o Unknown
o N/A- group
presentation room
o Unattended
belongings present
For observations in
the Group Presentation rooms, complete one observation survey per room, NOT PER
PERSON. Which group presentation room technology is being used in the room?
Check all that apply.
o LCD
o Wall Talker
o Camera
o Laptop Attached to
Camera
Group Presentation
Room - Record the total number of People in the room:
______ # Females
______ # Males
What is the person
doing at the copier?
o Scanning
o Copying
o Printing
o Faxing
o None of the Above
or Can't Tell
Is office equipment
(hole punch, stapler, or paper cutter) being used?
o Yes
o No
Is DSS software
such as Jaws, Kurtzweil, or ZoomText being used?
o Yes
o No
Is the person using
the scanner?
o Yes
o No
Is the person using
the DSS magnifier?
o Yes
o No
What is the person
doing at printer(s)?
o Releasing a Print Job
o Waiting for a Print
Job
o Having Trouble with
a Print Job
o None of the Above
How long did the
person use the walk-up computer?
o Less than 1 Minute
o 1 -5 Minutes
o 5 -10 Minutes
o > 10 Minutes
Record the person's
level of collaboration with other people.
o No collaboration-
working alone
o Social interaction
(appears not related to schoolwork)
o Paired (working
with another person on schoolwork)
o Group (working with
2 or more others on schoolwork)
What percentage of
the available space is the person or group using?
______ % of space
What is the seating
arrangement of the pair?
o Beside each other
o Across from each
other
o Diagonal
o Other
____________________
Note the
subject('s) technology use, if any. Which of these devices are in use? Check
all that apply
o Library Computer
o Laptop
o Smart phone
o Headphones
o E-reader
o Tablet or Notebook
o None
o Other-specify
____________________
What was the
purpose of using this Library owned computer? If possible, please specify.
o Library Resource
(Catalog, Database, E-book) ____________________
o Recreational
(Games, non-school related, social media) ____________________
o Email
o Productivity
Software (Microsoft Office) ____________________
o Specialized
Software (such as Matlab, SPSS, Photoshop) ____________________
o myLMUConnect ____________________
o Other/Can't Tell
____________________
Record all the
Activities that you observe for this subject(s).
o Browsing for/using
Lib Book
o Eating or Drinking
o Interacting w/
Staff Member
o Printing
o Reading, Writing,
or Studying (Non Computer)
o Sitting on Floor /
Squatting
o Sitting on Library
Furniture
o Sleeping
o Standing
o Talking
o Using Earplugs
o Using Electrical
Outlet
o Using Ethernet
cable
o Waiting in Line
o Walking (in
transit)
o Other
____________________
Note any additional
observations about the person's activities/belongings/seating or the space
itself (e.g. use of extension cable, wearing a coat, frustration, confusion)
Appendix B
Environment Survey
What day of the
week is your shift?
o Monday
o Tuesday
o Wednesday
o Thursday
o Friday
o Saturday
o Sunday
What time of the
day is your shift?
o Morning (9a-noon)
o Afternoon (1-4pm)
o Evening (5-8pm)
o Late Night (after
9pm)
You will begin your
shift by recording details about the general environment of your zone. First,
select Your Zone.
o 1
o 2
o 3
o 4
o 5
Select the approximate
area in zone 1 for the location of where you are standing.
o Doorway of Copy
Machine Room
o GP 106
o In Between
Computers #89/ & #7
Select the
approximate area in zone 2 for the location of where you are standing.
o In Front of
Leonardo Printer
o Between Computer G
& Table
Select the
approximate area in zone 3 for the location of where you are standing.
o In front of Walk-Up
Computer #1
o Information Commons
Desk
Select the
approximate area in zone 4 for the location of where you are standing.
o Between Table &
Computer 45
o Between Couches
& Computer A
Select the
approximate area in zone 5 for the location of where you are standing.
o Between Computer 77
& Computer 80
o Between Computer 82
& Reference Stacks PN 1997-PQ 6010
o In Front of
Computer 67
Record the Temperature
Level in your Area (in degrees F).
______ degrees F
Record the Humidity
Range in your Area (%).
______ %
Record the Noise
Level in your Zone.
______ dBA
Is there any
"Out of Order" Equipment in your Zone?
o None
o Computers
o Printers
o Scanners
o Lights
o Photocopier
Is there any
Equipment or Furniture in your zone that is Messy or Unclean (e.g. spills,
excessive trash)?
o Yes
o No
Please describe
what was messy or unclean
Appendix C
Patron Survey
Please take a few minutes to fill out this brief
survey so we can improve the Information Commons space!
By completing this survey, you will have the
chance to enter a raffle drawing to win a $50 Amazon gift card (provided you
give us your email address).
Below is a consent form allowing us permission
to use your anonymous feedback. No information that
identifies you will be collected or released.
What activities are
you engaging in today on the Library's first floor? Select all that apply.
o Print
o Study
o Read
o Eat/Drink
o Write
o Get Help from a
Staff Member
o Photocopy
o Group Work
o Take a Nap
o Talk/Socialize
o Scan (scanner)
o Use a Reference
Book
o Other- please
specify ____________________
Which devices are
you using within the Library's first floor space today? Select all that apply.
Include both devices supplied by the Library and devices you bring with you.
o Library Computer
o Laptop
o Smart Phone
o Headphones
o E-Reader
o Tablet or Notebook
o None
o Other- please
specify ____________________
For what purpose(s)
are you using the Library Computers today? Select all that apply.
o Library Resources
(library catalog, research databases, e-books)
o Recreational
(games, social media)
o Email
o Productivity
Software (Microsoft Office)
o Specialized
Software (used in my Schoo/College, such as Matlab) ____________________
o myLMUConnect
o Other- please
specify ____________________
When you picked
your spot on the first floor of the Library today, which factors were most
important to you? Please choose the top FIVE factors from the list on the left
and drag & drop them into the “Top Five Factors” Box on the right in order
of importance (#1 = most important).
|
Top Five Factors
|
|
______ Spacious
(can spread out)
|
|
______ Quiet
|
|
______ Ambient or
Background Noise
|
|
______ Nice View
|
|
______ Privacy
|
|
______ Proximity
to Other Students
|
|
______ Bright
Lighting
|
|
______
Comfortable Seating
|
|
______ Access to
Power Outlets
|
|
______
Comfortable Temperature
|
|
______ Access to
a Library Computer
|
|
______ Aesthetics
(decor)
|
|
______ Talking is
Tolerated
|
|
______
Cleanliness
|
Describe your level
of collaboration with other people today on the first floor of the Library.
o No collaboration- I
am working alone
o Paired (working
with another person)
o Working with a
group of 2 or more
o Other- please
specify ____________________
What could be done
to make the “Information Commons” (first floor of the Library) a better space
for you?
What is your
gender?
o Male
o Female
What is your status
at LMU?
o Undergraduate
student
o Graduate student
o Faculty/staff
o Guest or Other
Is there anything
you would like to add?
Appendix D
Furniture Survey (images available at https://lmu.box.com/v/furniturestudy)
These questions only pertain to
the "Information Commons" space located on the First Floor of the
Hannon Library. This is the area you are currently sitting in. The space
includes over 80 iMac computers, printers, and the Information Desk. We need
your feedback so we can improve the space. Thanks for your input!
Pick Your Preferred
Spot to Use a Library Computer
o
Private
o
Open
Which option(s)
best explains why you chose this spot to use a library computer?
o
Privacy
o
Space for My Stuff
o
Noise Level
o
Open Space / Not Closed Off
o
Location (e.g. close to printer)
o
Collaboration
Pick Your Favorite
Table and Chair Configuration
o
4 Chairs Facing Each Other
o
1 Chair Against the Wall
o
1 Row Facing the Same Direction
o
2 Chairs Facing Each Other
o
2 Chairs Against the Wall
Which option(s)
best explains why you chose this table and chair configuration?
Conducive to Studying / Homework
o
Space for my Stuff
o
Collaboration
o
Open Space / Not Closed Off
o
Privacy
o
Quiet
Do you Prefer a
Rectangular or Round Table?
o Rectangular Table
o Round Table
Which option(s)
best explains why you chose this table?
o
Space for My Stuff
o
Comfort (e.g. easier on my legs)
o
Conducive to Studying / Homework
o
Collaboration
Pick Your Ideal
Private Space for Working Solo
o
S-Divider
o
Carrel
o
Space Pod
Which option(s)
best explains why you chose this spot as your ideal private space for working
alone?
o
Privacy / More Closed Off
o
Comfort
o
Writing Surface (e.g. table)
o
Aesthetics / Appearance
o
Compact (efficient use of space)
o
Space for My Stuff
o
Noise Level
o
Open Space / Less Closed Off
Pick Your Ideal
Private Space for Collaborating
Enclosed Booth
o
High-Back Booth
o
High- Back Couch
Which option(s)
best explains why you chose this spot as your ideal space for collaborating?
Seating Configuration (e.g. beside, across)
o
Comfort
o
Privacy / More Closed Off
o
Writing Surface (e.g. table)
o
Space for My Stuff
o
Noise Level
o
Open Space / Less Closed Off
Choose your
Favorite Lounge Furniture
o
High Back Couch with Coffee Table
o
Armchair and Coffee Table
o
Reverse-C Chair
o
Low Back Couch with Coffee Table
o
Barstool and Counter
Which option(s)
best explains why you chose this furniture for a lounge area?
Comfort
o
Aesthetics / Appearance
o
Conducive to Work / Study
o
Collaboration or Socializing
o
Seating Configuration (e.g. beside, across)
o
Space for My Stuff
o
Writing Surface (e.g. table)
o
Privacy
Where would you
prefer to take a phone call in the Information Commons?
Soundproof Phone Booth
o
Move to Another Area in the Library
o
Group Study Room
o
Computer Carrel
o
Open Study Area
Which option(s)
best explains why you chose this spot to take a phone call?
o
Privacy
o
Quiet
o
Open Space / Not Closed Off
o
Space for my Stuff
Appendix E
Heat Map of People
Observed in Each Area
Appendix F
Tableau Visualization of Activity in Each Zone

Appendix G
Top Comments from Patron Survey and Whiteboard Polls
|
Category
|
# Times
|
Details
|
|
Noise/Too Loud
|
32
|
Designate a “no talking” and “no cell phones” area
|
|
Furniture
|
28
|
Napping pods (9), newer
furniture, more desk space, more comfort
|
|
Library Desktop Computer Station
|
25
|
More computers, kick out people not using the computer,
cleaner, more specialized software (7), mice that work better (6)
|
|
Food & Drink
|
24
|
Snacks/vending machines, water
bottle refilling station, designated food zone
|
|
Miscellaneous Space Suggestions
|
15
|
Charging station, plants, 3D
printer, etc.
|
|
Temperature/Too Cold
|
9
|
Too cold
|
|
General Cleanliness
|
8
|
Less food and trash
|
|
Printers
|
7
|
Spread out to more locations,
improve functionality, pay without OneCard
|
|
Hours
|
5
|
Open 24/7
|
|
Lighting
|
4
|
Brighter
|


