Research Article
Effect of Undergraduate Research Output on Faculty
Scholarly Research Impact
Adriana Popescu
Interim Dean of Library
Services
Robert E. Kennedy Library
Cal Poly
San Luis Obispo, California,
United States of America
Email: popescu@calpoly.edu
Radu Popescu
Lecturer, Architectural
Engineering
College of Architecture and
Environmental Design
Cal Poly
San Luis Obispo, California,
United States of America
Email: rpopescu@calpoly.edu
Received: 04 July 2017 Accepted:
24 Oct. 2017
 2017 Popescu and Popescu.
This is an Open Access article distributed under the terms of the Creative
Commons‐Attribution‐Noncommercial‐Share Alike License 4.0
International (http://creativecommons.org/licenses/by-nc-sa/4.0/),
which permits unrestricted use, distribution, and reproduction in any medium,
provided the original work is properly attributed, not used for commercial
purposes, and, if transformed, the resulting work is redistributed under the
same or similar license to this one.
2017 Popescu and Popescu.
This is an Open Access article distributed under the terms of the Creative
Commons‐Attribution‐Noncommercial‐Share Alike License 4.0
International (http://creativecommons.org/licenses/by-nc-sa/4.0/),
which permits unrestricted use, distribution, and reproduction in any medium,
provided the original work is properly attributed, not used for commercial
purposes, and, if transformed, the resulting work is redistributed under the
same or similar license to this one.
Abstract
Objective – In the context of the ongoing discourse about the role
of Institutional Repositories (IRs), the objective of the study is to
investigate if there is any evidence of a relation between undergraduate
student activity in an IR and the impact of faculty research.
Methods – The data used for the study is representative of six
academic departments of the College of Science and Mathematics (CSM) at
California Polytechnic State University (Cal Poly). Digital Commons@Cal
Poly (DC) is the IR supported by the library. Regression analysis was used to
investigate the interdependence between faculty research impact (dependent
variable) and undergraduate student repository activity (independent variable).
For each department, faculty research impact was quantified as a measure of the
citation counts for all faculty publications indexed in Web of Science (WoS) between January 2008 and May 2017. Student repository
activity was quantified for each department in two ways: (1) total number of
student projects deposited in DC since 2008 (Sp) and
(2) total number of student project downloads from DC (Sd). The dependent variable was regressed against
each of the two elements of student repository activity (Sp
and Sd), and the resulting
statistics (sample correlation coefficients, coefficients of determination, and
linear regression coefficients) were calculated and checked for statistical
significance.
Results – The
statistical analysis showed that both components of student repository activity
are positively and significantly correlated with the impact of faculty research
quantified by a measure of the citation counts. It was also found that faculty
repository activity, although positively correlated with faculty research
impact, has no significant effect on the correlation between student repository
activity and faculty research impact.
Conclusion – The analysis considers two distinct groups of
publications: one group of student publications (senior projects) from six
academic departments, which are deposited in an open repository (DC), and one
group of publications (not necessarily represented in DC) of faculty affiliated
with the same six departments and whose citation impact is believed to be
affected by the first group. The statistical correlation between student
repository activity and faculty research impact can be seen as an indication
that an active, open IR centered on collecting, preserving, and making
discoverable student research output has a positive impact on faculty’s
research impact. More research that includes additional factors and uses a
larger data set is necessary to arrive at a definitive conclusion.
Introduction
Cal
Poly is a nationally ranked public university and part of the California State
University (CSU) System, the largest public university system in United States.
The school’s motto is “Learn by Doing,” which translates into a pedagogical
focus on project-based curriculum. Throughout their Cal Poly experience,
students actively engage in research, experimentation, studio work, and design,
and the outcomes of their class experience and learning are reflected in the
senior project submissions.
In
2008, the library launched Digital Commons@Cal Poly
(DC), which serves as the institutional repository (IR). DC is powered by bepress (https://www.bepress.com), which is used by over 500
educational institutions to preserve and showcase their scholarly output and
special collections. The mission of Cal Poly’s IR is to collect, preserve, and
make visible all institutional intellectual output, including pre-prints,
working papers, journal articles, senior projects, master's theses, conference
proceedings, presentations, images, and a wide variety of other content types.
Although the library’s DC is an open access (OA) repository and is available
for submission of student and faculty work, not all departments actively
deposit to DC. The library’s ongoing efforts to promote the benefits of
contributing scholarly and creative works to DC had mixed results, with some
colleges (and departments) being more active participants than others.
Recent
discussions about the purpose of IRs and a call to “disconnect them from the OA
agenda for journal articles” and reposition them “in the broader context of
managing and preserving institutional community assets” (Lynch, 2017, p. 127)
triggered the interest to investigate whether community assets (e.g., student
senior projects) preserved and exposed in IRs can have a positive influence on
the overall faculty research impact. Senior projects, electronic theses, and
dissertations represent a significant part of the institutional intellectual
output. By exposing this output in IRs, libraries not only fulfill their
mission to curate, archive, and preserve but by developing IRs centered on
student work, they also facilitate the advancement of the faculty research
agenda and profile.
Many
studies have investigated the effect of open access (OA) on the research impact
of publications. The general conclusion was that OA offers clear advantages
over paid access with respect to accessibility and therefore visibility of
published research and has a significant effect on the overall research impact
expressed as a function of citation count (Brody, Harnad,
& Carr, 2006; Gargouri
et al., 2010). The novelty of the present study is that it aims to investigate
using statistical methods whether an active, open IR centered on student work
has a positive impact on faculty’s research impact independent of faculty’s
participation in the IR. The study analyzes two distinct samples of
publications:
1.
A
group of faculty publications from the six CSM departments selected for the
study for which research impact is calculated based on Web of Science (WoS) citation data
2.
A
group of CSM student publications (senior projects) from the same six CSM
departments that are deposited in DC
The
first sample of publications consists of articles published between January
2008 and May 2017 by the faculty in the six departments of CSM at Cal Poly and
indexed by WoS. Only articles published under the Cal
Poly affiliation are included in the study. InCites (http://clarivate.com/?product=incites), a
customized, web-based research evaluation tool that uses WoS
data to generate institutional reports to showcase strengths and identify
potential areas for growth, was used to acquire values for Journal Expected
Citations (JEC) and Journal Normalized Citation Impact (JNCI) indicators.
The
second sample of publications originates from DC. Three major categories of
scholarly output are deposited in DC (among others): (1) faculty works (e.g.,
voluntarily deposited scholarly output), (2) undergraduate student senior
projects, and (3) master’s theses. Deposit and download metrics for the first
two categories were obtained from institutional activity reports for DC and
were used in the study.
The
goal was to identify a possible correlation between the scholarly impact of
faculty research and undergraduate student repository activity. The faculty
activity in DC is also included in the analysis to verify whether it affects
the direct correlation between faculty research impact and student repository
activity.
CSM
at Cal Poly has a strong record of faculty and undergraduate research, which is
also reflected in an active participation and submissions of student works to
DC. Six departments were selected for the study: Biological Sciences, Chemistry
& Biochemistry, Kinesiology, Mathematics, Physics, and Statistics. Two
departments have been omitted for the following reasons: (1) faculty in the Liberal
Studies Department have dual departmental affiliations (CSM and the College of
Liberal Arts), and it was not possible to isolate the research contributions of
the faculty specific to CSM; and (2) the School of Education does not offer
undergraduate programs. The six selected departments were randomly assigned
numbers, and the departments are identified in the study only by these numbers.
One
limitation of the study is the small sample of academic units (N = 6), which may affect credibility of
the conclusions on the grounds that some results could have been obtained by
chance. To overcome this issue, all results were thoroughly checked for
statistical significance.
Literature Review
Role of
Institutional Repositories
The report of
the Coalition for Networked Information (CNI) Executive Roundtable on
“Rethinking Institutional Repository Strategies” held during the Spring 2017 CNI meeting in Albuquerque, New Mexico,
highlighted the challenges faced by existing IRs (CNI, 2017). It is
increasingly difficult to justify why faculty should place materials in an IR
when other options, such as disciplinary repositories that meet funders open
access mandates are available, or when commercially run systems, such as
academia.edu or ResearchGate that offer networking
and analytics features, are available (CNI, 2017). Given perennial competing
funding priorities, academic libraries are faced with the task of demonstrating
value and return on investment for continuing to support and maintain IRs,
which have been implemented, developed, and maintained since the early 2000s at
significant costs and mostly supported by libraries. One way to demonstrate and
make the case for the viability of an IR is to demonstrate that the
undergraduate research output deposited in IR is reflected in the overall
faculty research impact.
Undergraduate
Research
The positive
benefits of exposing and encouraging undergraduate research experiences have
been studied and reported in the literature. Undergraduate research experiences
translate into personal and professional gains for students and are reflected
in elucidation of career paths and enhanced graduate school preparation
(Seymour, Hunter, Laursen & DeAntoni,
2004). Positive impact on student retention (Gregerman,
Lerner, von Hippel & Nagda, 1998) has also been
reported. A limited number of studies (Lei & Chuang, 2009) show that
faculty benefit indirectly because students who have gained publishing and
practical original research experience while working on faculty research
projects become contributors to scholarly publications. By generating
publishable results from undergraduate research projects, faculty may have
established a valuable future research collaboration
with these students. However, no studies have been identified that attempt to
demonstrate a direct influence of undergraduate research activity on faculty
research impact.
Research Impact
When
assessing research performance, it is important to take into account both the
volume and the quality of research output. Citations are widely recognized as a
proxy for quality. The citation impact quantifies the citation usage of
scholarly works. Eugene Garfield, the creator of Web of Science, states that
“citation frequency is a measure of research activity . . .” (Garfield, 1973),
and that frequency of citations is an “indicator of quality . . . of
productivity as well as impact” (Garfield, 1988). Moed
(2005) discusses in detail the relationship between intellectual influence or
research impact and citation impact. He shows that “even if one assumes that
citations measure intellectual influence . . . intellectual influence needs to
be valued in a wider cognitive framework” and that there are some factors that
affect in a different manner intellectual influence and citation impact (p.
223). There are possible biases and errors in the interpretation of citation
impact, and therefore, empirical analyses do not result in perfect
correlations. Moed (2005, p. 224) concludes, however,
that the fact that these correlations are positive provides an empirical
justification for relating citation impact to intellectual influence (or
research impact—as it is termed in this study). He further shows that analysis
bias may be reduced to a considerable extent when analyzing aggregates of
entities that have some aspects in common rather than analyzing individual
units (p. 225).
Citation
counts, or Times Cited (TC), were first used to evaluate importance of
scientific work by Gross and Gross (1927) and since then have remained the main
means to characterize research impact. While TC is a meaningful and accessible
way to reflect scholarly output and measure the impact of an individual
researcher, a group, or an institution, Garfield (1972) warned that TC is a
function of many other variables besides scientific impact. Bornmann
and Daniel (2008) list and discuss some of those factors: (1) time of
publication, with more citations to recent than to older publications; (2)
field of research, with the citation potential varying significantly from one
field to another; (3) journal frequency of publication and journal impact
factor; (4) article type (e.g., review, research, letter, note), language, and
length; (5) number of coauthors; and (6) accessibility (i.e., OA or paid
access).
To
alleviate the effect of some factors, one can look at how the citation count
(TC) compares with expected citation count for a field or discipline or for a
specific journal. The expected citation count is available for most of the
journals indexed in WoS as the Journal Expected
Citations (JEC) indicator (Clarivate Analytics,
2017). The ratio between TC and JEC, for example, becomes a qualitative measure
of the research impact that can be compared across various publications and
even various disciplines.
Data Used in
the Study
Independent Variables
Two
categories of DC repository activity were included in the study as described
below. The data were obtained from Cal Poly's DC institutional activity
reports.
1.
Undergraduate
student activity consisted of senior projects and was quantified for each
department through the project counts (Sp) and the
project download counts (Sd).
As of May 2017, DC contained 263 undergraduate student projects totaling about
276,000 downloads for the six CSM departments considered. These data were
normalized by the number of faculty (NF) in each department and are listed in
columns 2 and 3 of Table 1. These data represent the independent variables for
the correlation sought after in this study.
2.
Faculty
activity consisted of research articles deposited in DC and was quantified for
each department through the paper counts (Fp) and the
paper download counts (Fd).
This activity was included in the study to investigate if the correlation
between student activity in DC and faculty research impact is in fact a result
of the faculty repository activity in DC. These data were normalized by NF and
are listed in columns 4 and 5 of Table 1.
The
indicators of student repository activity (Sp and Sd) and faculty repository
activity (Fp and Fd) were
normalized by the department size expressed as number of faculty (NF). Given
that all departments discussed here belong to the same academic unit, and most
likely have comparable resources, the size of each department can be expressed
as a function of either NF or the number of students. As the number of students
in a department may vary significantly from one academic year to another, NF
was selected as a measure of the department size.
Some
of the CSM departments also offer graduate programs, and master’s theses are
usually deposited in DC. The effect of graduate student repository activity on
faculty research impact will be analyzed in a future phase of the study.
Dependent Variable
The
dependent variable in this study is a measure of the scientific impact of all faculty in each department quantified by a measure of the
citation count of their publications. As discussed in the literature review,
faculty research impact or performance (in short research impact) can be quantified by a measure of the citation
count from faculty publications. Raw citation counts are affected by other
factors besides research performance. The measure of citation count used here
aims to eliminate most of these factors. In this respect, InCites
provides the Journal Normalized Citation Impact (JNCI) indicator for each
publication. The JNCI is the total number of citations per paper (TC)
“normalized for journal, year and document type subject” (Clarivate
Analytics, 2017, p. 18). The normalizing factor is the Journal Expected
Citations (JEC) indicator defined as the “average number of citations to
articles of the same document type from the same journal in the same database
year” (Clarivate Analytics, 2017, p. 18).
Table
1
Data
Used in the Study
|
Department
no.
|
Repository
activity in DC
(all values
are divided by NF)
|
Faculty
research impact indicator (JNCIav)
|
|
Undergraduate
student projects
|
Faculty
papers
|
|
Project
count (Sp/NF)
|
Download
count (Sd/NF)
|
Paper count
(Fp/NF)
|
Download
count (Fd/NF)
|
|
1
|
4.46
|
3,863.0
|
14.91
|
5,033.0
|
2.012
|
|
2
|
2.67
|
5,038.7
|
3.05
|
996.9
|
1.269
|
|
3
|
0.20
|
155.2
|
1.57
|
762.3
|
0.765
|
|
4
|
0.22
|
272.8
|
3.56
|
930.1
|
0.882
|
|
5
|
1.10
|
522.6
|
16.17
|
8,698.7
|
1.145
|
|
6
|
1.36
|
1,286.6
|
11.55
|
9,209.5
|
1.374
|
In
reference to the list of factors affecting TC discussed in the literature review,
use of JEC as a normalizing factor eliminates the influence of the first three
factors in the list (time of publication, research field, and journal impact
factor). Given the relatively large groups of papers analyzed here, the
elements characterizing the other three factors can be considered to be roughly
similar for all departments. Based on these considerations, the JNCI indicator
is used to assess the scientific impact of each individual paper. Each
individual value of JNCI shows if the paper has been cited more than expected
(JNCI > 1) or less than expected (JNCI < 1).
The
research impact, denoted as JNCIav, is a
qualitative measure of the impact of the faculty publications, is defined for
an entire department, and is calculated here as the average of all JNCI values
for all papers indexed by WoS published by the
faculty in each department between January 2008 and May 2017 (a total of 871
articles for the six departments). Only active faculty as of
May 2017 (according to departmental directory listings) have been
considered in the study. InCites was used to extract
and process WoS data used to calculate the research
impact indicator.
A
series of issues exist when using this research impact indicator:
1.
For
some journals, the JEC value listed by InCites is
zero or is not available; therefore, JNCI cannot be calculated.
2.
If
the value of JEC is very small, one single citation would result in unusually
large values of JNCI that may bias the resulting average value for some
departments.
These
limitations were addressed as follows:
1.
The
papers where JEC is not available or zero were not included in the JNCIav indicator calculation. These papers
represent 14% of all papers considered in this study.
2.
The
papers with JEC lower than a given threshold were also eliminated from the
research impact calculation. The threshold selected was JEC = 0.1. An
additional 10% of all papers considered were eliminated due to this filter.
Thus,
the indicator used to characterize the research impact in each department is
the average of JNCI for all papers that have JEC ≥ 0.1. This indicator is
referred to as research impact and denoted by the symbol JNCIav.
The values of JNCIav for the six
departments considered are listed in the last column of Table 1.
Tests for
Normality
This
study used linear regression analysis between the independent variables
(various aspects of student repository activity) and the dependent variable
(faculty research impact indicator). Though there is no general requirement for
the input data in a regression analysis to be normally distributed, certain
statistical tests used in the next section require normality, especially for
small samples (Devore, 2000, p. 533). Therefore, the data used here is first
checked for normality and transformed if necessary to achieve normality.
The
test for normality is in general easily met for very small samples such as
those in this study. One way to qualitatively assess the goodness of fit with
the normal distribution is to visually compare the quantile-quantile plots (or
QQ-plots) of the sample versus theoretical quantiles from the normal
distribution. As the sample is closer to normal, the QQ-plot is closer to a
straight line. QQ-plots for the quantities used here are presented in Figure 1
and are used to estimate whether original sample data or logarithm of sample
data is closer to a normal distribution. Based on visual comparison, it appears
that logarithms of the values in Table 1 are closer to the normal distribution
for normalized student project downloads, Sd/NF, and
for research impact indicator, JNCIav. No
conclusion could be obtained from the plots regarding the normalized student
project counts, Sp/NF.
Statistical
quantitative assessments for goodness of fit are also available. The most
popular test for assessing normality of a sample is the Chi-square test, but
the sample size used here is too small to provide reliable results. Two other
tests are used that accept small sample sizes, namely Kolmogorov-Smirnov
(Massey, 1951) and Ryan-Joiner (Devore, 2000, p. 634). Based on these two statistical
tests, all data sets fit the normal distribution at the 5% level of
significance, but the log-value sets are closer to a normal distribution than
the original values for all sets listed in Table 1. Therefore, to obtain
samples closer to the normal distribution, logarithm of all values listed in
Table 1 (independent and dependent variables) are used in the regression
analyses. The statistical level of significance is briefly discussed in the
next section.
Analysis
and Results
Correlation Between Faculty Research Impact and Undergraduate Student
Activity in DC
Regression
Analyses
Regression
analysis explores the relationship between two or more variables related in a
nondeterministic fashion (Devore, 2000, p. 489). More specifically, a
regression analysis between two sets of measured quantities, the dependent
variable denoted by y and the
independent variable denoted by x,
explains how y changes as a function
of the changes in x, or, in other
words, it expresses y as a function
of x. This function,  = f(x),
is called regression function or regression model. Note that, for any value of x, the result of f(x) is not necessarily equal to the corresponding measured value of y but to a predicted value, . Linear
regression seeks to find a linear functional relationship between y and x. In simple linear regression, as described here, there is only
one independent variable. In multiple linear regression analysis, as described
later in the section titled Effect of Faculty Activity in DC on Research
Impact, the analysis includes more than one independent variable.
= f(x),
is called regression function or regression model. Note that, for any value of x, the result of f(x) is not necessarily equal to the corresponding measured value of y but to a predicted value, . Linear
regression seeks to find a linear functional relationship between y and x. In simple linear regression, as described here, there is only
one independent variable. In multiple linear regression analysis, as described
later in the section titled Effect of Faculty Activity in DC on Research
Impact, the analysis includes more than one independent variable.
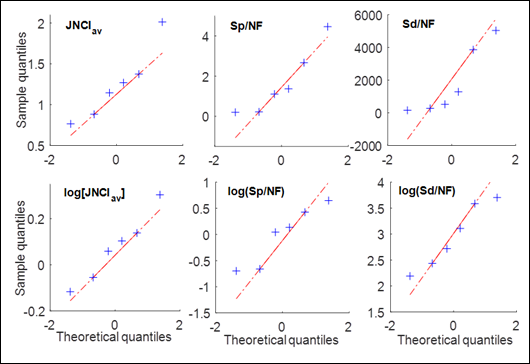
Figure
1
Quantile-quantile
plots for assessing normality of the data samples used in the study.
The
strength of the relation between y
and x is measured through a series of
quantities obtained from the regression analysis, such as the coefficient of
determination and the sample correlation coefficient. The coefficient of
determination, R2 (or R-squared), is defined as the proportion of
the variance in the dependent variable that can be explained by the linear
regression model (Devore, 2000, p. 506). In simple linear regression, R2 is equal to the square of
the sample correlation coefficient between the independent and the dependent
variables. This correlation coefficient, denoted here by R, is a measure of the strength of the linear association between
the two quantities. The functional relationship between the dependent and the
independent variables is expressed in simple linear regression as = a0 + a1x. The parameters a0 and a1
are the intercept and the slope of the regression line and are also a result of
the regression analysis.
The
regression function in Excel has been used to perform two linear regression
analyses: (1) between faculty research impact indicator, log(JNCIav), and the normalized student project
counts, log(Sp/NF), and (2) between log(JNCIav) and the normalized student project
downloads, log(Sd/NF). The results are shown in
Figure 2. The dependent variable in these analyses is the research impact
indicator, represented by a set of six observed values—the log of values shown
in the last column of Table 1. The independent variable in each regression
analysis, either log(Sp/NF)
or log(Sd/NF), is also represented by a set of six
observed values. Figure 2 shows scatter plots of the data along with the regression
line (predicted values) that is estimated using the least squares method. The
markers represent observed values, namely log of the values in Table 1. The
other results discussed previously (R2
and the regression line parameters) are also shown in Figure 2.
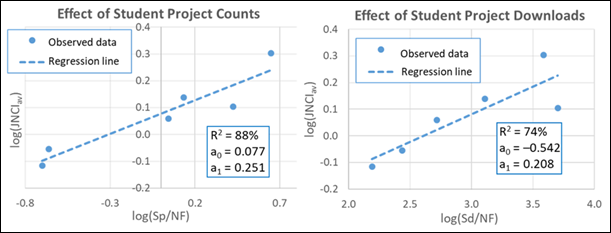
Figure
2
Results of regression analysis between
undergraduate student repository activity and research impact.
The
predictive linear equations are of the form = a0 + a1x, where = log( ) is the
predicted log-value of research impact and x
= log(Sp/NF) or x
= log(Sd/NF). These equations can be written as power
equations in terms of the original data from Table 1 as
) is the
predicted log-value of research impact and x
= log(Sp/NF) or x
= log(Sd/NF). These equations can be written as power
equations in terms of the original data from Table 1 as  = b0*vb1, where = and v
= Sp/NF or v = Sd/NF. With
the values of a0 and a1 shown in Figure 2, the predictive
equations become:
= b0*vb1, where = and v
= Sp/NF or v = Sd/NF. With
the values of a0 and a1 shown in Figure 2, the predictive
equations become:
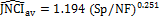 and
and 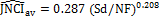
Discussion of
Regression Analysis Results
At
this juncture, two questions still need to be addressed: (1) how significant is the
linear dependence between research impact and student repository activity? and (2) how significant are the calculated
regression line parameters a0
and a1? This significance is investigated here by
means of statistical hypothesis testing that is used to check the validity of a
result at a certain level of significance, α. A commonly accepted significance level,
also selected here, is α = 5%. A simple interpretation of the level of
significance in statistical testing can be stated as follows: when accepting
the hypothesis that a certain quantity is statistically significant at the α = 5% level of significance there is still a 5% chance
that the hypothesis is false. (NOTE: For brevity, the ad-hoc definition of
significance level stated here is based on the alternate hypothesis, H1,
rather than on the null hypothesis, H0.) The significance of
regression analysis results was investigated using three statistical tests.
The
strength of the linear dependence between faculty research impact and student
repository activity was first verified through the p value of the observed relationship. This p value is an output of the regression function in Excel that
directly indicates the level of statistical significance of the relationship
between the dependent and independent variables (see Devore, 2000, p. 394 for
more details on p value). For the
level of significance selected, α = 5%, a calculated p value < 0.05 indicates that the observed relationship is
significant at least at the 5% level (i.e., there is less than 5% probability
that this relationship resulted by chance). The calculated p values for the two regression analyses are listed in Table 2.
The
strength of the linear dependence between research impact and student activity
was also assessed by comparing the calculated sample correlation coefficients,  , with the
minimum significant value of R at the
α level of significance:
, with the
minimum significant value of R at the
α level of significance:

where Z is the standardized normal random
variable and N = 6. For α = 5%,  . The test,
described in detail by Bendat and Piersol (2010, pp. 99-101), states that there
is evidence of statistical correlation at the α level of significance if the
absolute value of the sample correlation coefficient is
. The test,
described in detail by Bendat and Piersol (2010, pp. 99-101), states that there
is evidence of statistical correlation at the α level of significance if the
absolute value of the sample correlation coefficient is  . The
resulting sample correlation coefficients are compared with
. The
resulting sample correlation coefficients are compared with  in Table 2.
One
common type of statistical hypothesis testing uses t statistics (Devore, 2000, pp. 296-301). The t statistic of a certain result to be tested for significance is
compared with the critical value from t
distribution. The critical value depends on the number of degrees of freedom, n, and on the level of significance, α.
Critical values of t distribution are
tabulated in any statistics textbook. The critical t distribution value corresponding to the regression analyses
performed here, with n = 4 degrees of
freedom (n = N − 2 for simple linear regression, with N = 6, the sample size) and level of significance α = 5%, is tn(α)/2 = 2.776. If the absolute value
of the t statistic for a certain
parameter is larger than or equal to 2.776, the respective parameter is
considered statistically significant at the 5% level. The regression function
in Excel provides t statistic values
for the regression parameters, a0 and a1. These t statistics are compared in Table 2
with the critical value from t
distribution, t4,2.5% = 2.776.
From
comparing the values in Table 2, it is concluded that all parameters considered
here meet all statistical tests at the 5% level of significance. Therefore,
there is significant linear dependence between student repository activity and
faculty research impact, and the calculated linear regression coefficients can
be used with confidence in a predictive model.
Effect of Faculty Activity in DC on
Research Impact
As
inferred from several previous studies on the effect of OA on research impact
(Brody, Harnard, & Carr,
2006; Gargouri et al., 2010), faculty repository
activity (self-archiving of faculty papers and download counts) in DC is
expected to be correlated with faculty research impact. Even in the presence of
significant correlation between student repository activity in DC and faculty
research impact, a question arises: Could
this correlation be a result only of the two variables (student repository
activity and faculty research impact) each being strongly correlated to faculty
repository activity? If so, then faculty repository activity may be the
determining factor for research impact. Two variables being strongly correlated
to a third variable is known as severe
multicollinearity. The following analysis answers the question noted and
determines whether severe multicollinearity exists in this situation.
Table
2
Hypothesis
Testing of Regression Analysis Results at 5% Level of Significance
|
Statistics
from regression analysis
|
Regression
between log(JNCIav) and log(Sp/NF)
|
Regression
between log(JNCIav) and log(Sd/NF)
|
Critical
values
|
|
Strength
of linear relationship
|
p value
|
0.006
< 0.05
|
0.029
< 0.05
|
pmax = 0.05
|
|
Sample
correlation coefficient, R
|
0.937
> 0.812
|
0.859
> 0.812
|
|
|
Confidence
in regression parameters
|
t statistics
for a0
|
3.215
> 2.776
|
|–2.906|
> 2.776
|
t4,2.5% = 2.776
|
|
t statistics
for a1
|
5.346
> 2.776
|
3.351
> 2.776
|
Table
3
Sample
Correlation Coefficients Between Various Pairs of Data
Used in this Study
|
Data pairs
|
Sample
correlation coefficient
|
|
Student
project count, log(Sp/NF), and research impact,
log(JNCIav)
|
0.937
|
|
Faculty
paper counts in DC, log(Fp/NF), and research impact,
log(JNCIav)
|
0.741
|
|
Student
project count, log(Sp/NF), and Faculty paper count
in DC, log(Fp/NF)
|
0.632
|
|
Student
project downloads, log(Sd/NF), and research impact,
log(JNCIav)
|
0.859
|
|
Faculty
paper downloads in DC, log(Fd/NF), and research
impact, log(JNCIav)
|
0.625
|
|
Student
project downloads, log(Sd/NF), and Faculty paper
downloads, log(Fd/NF)
|
0.290
|
Sample
Correlation Coefficients
Significant
correlation indicates strong linear dependence. As discussed earlier and as
shown in Table 3, significant correlation exists between faculty research impact
and student activity in DC (both student project counts and student project
downloads) with values of the sample correlation coefficients R = 0.937 between log(JNCIav) and log(Sp/NF)
and R = 0.859 between log(JNCIav) and log(Sd/NF),
which are both larger than the critical value, .
To
investigate the effect of faculty repository activity in DC on research impact,
sample correlation coefficients between other pairs of data have been
calculated using the correlation function in Excel and are listed in Table 3.
The sample correlation coefficient between log(JNCIav) and log(Fp/NF)
is R = 0.741 and between log(JNCIav) and log(Fd/NF)
is R = 0.625. Both values are smaller
than , meaning that
they do not pass the statistical test discussed before. This indicates that the
correlation between faculty repository activity and research impact is not
statistically significant at the 5% level, and therefore the dependence is not
as strong as the one between research impact and student activity in DC.
The
sample correlation coefficients between the two types of independent variables
resulted as follows:
·
Between
log(Sp/NF) and log(Fp/NF): R = 0.632, which is smaller than the
corresponding correlation coefficients between each independent variable and
the dependent variable, or 0.937 and 0.741
·
Between
log(Sd/NF) and log(Fd/NF): R = 0.29, which is smaller than 0.859
and 0.625
Lower
correlation between the independent variables than between each independent
variable and the dependent variable (research impact) indicates that there is
no severe multicollinearity.
Table 4
Adjusted R2 Between
Research Impact Indicator and Repository Activity in DC
|
Regression analysis
|
AdjR2
|
Effect of adding factor
|
|
1. Between log(Sp/NF)
and log(JNCIav)
|
85%
|
86% − 44% = 42%
|
|
2. Between log(Fp/NF)
and log(JNCIav)
|
44%
|
86% − 85% = 1%
|
|
3. Between log(Sp/NF)
& log(Fp/NF), the independent variables, and
log(JNCIav), the dependent variable
|
86%
|
|
|
4. Between log(Sd/NF)
and log(JNCIav)
|
67%
|
82% − 24% = 58%
|
|
5. Between log(Fd/NF)
and log(JNCIav)
|
24%
|
82% − 67% = 15%
|
|
6. Between log(Sd/NF)
& log(Fd/NF), the independent variables, and
log(JNCIav), the dependent variable
|
82%
|
|
Adjusted
R2
The
adjusted R2 (AdjR2) is a modified version of R2 that is adjusted for the
number of independent variables in the model and is always lower than R2. AdjR2 is one of the results of the regression analysis in
Excel and is useful in multilinear regression analysis. The difference between
AdjR2 of a bilinear
regression analysis with independent variables x1 and x2
and the AdjR2 of a simple
linear regression using only x1
indicates by how much the regression model is improved by adding the variable x2.
The
resulting values of AdjR2
from the simple linear regression analyses discussed in the previous subsection
are included in the second column of Table 4 (analyses 1 and 4). Two additional
simple linear regression analyses were performed between the components of
faculty activity in DC (independent variables) and the research impact
(dependent variable). The resulting AdjR2
values are listed in Table 4 (analyses 2 and 5). Two bilinear regression
analyses were also performed, and the resulting AdjR2 is listed in Table 4:
·
log(Sp/NF) and log(Fp/NF) as
independent variables versus log(JNCIav);
see analysis 3
·
log(Sd/NF) and log(Fd/NF) as
independent variables versus log(JNCIav);
see analysis 6
Finally, the third column of Table 4
shows by how much each independent variable would improve a linear regression
model between another independent variable and the research impact. For example,
a linear model linking log(Fp/NF) and log(JNCIav) is improved by 42% (86% − 44%) by adding
log(Sp/NF) in the model, while a linear model linking
log(Sp/NF) and log(JNCIav)is
improved by only 1% (86% − 85%) by adding log(Fp/NF)
in the model. From these results, it is clear that the student paper downloads
(Sd) and student paper
counts (Sp) contribute more significantly to the
bilinear regression model for predicting research impact than the corresponding
quantities from faculty papers deposited in the DC.
It
is therefore safe to consider that, for the data analyzed here for the six CSM
departments, the impact of faculty research can be correlated with the student
research activity in DigitalCommons@Cal Poly with
little interference from the CSM faculty deposits in DC. Note that this
conclusion does not imply that the open availability of faculty works in DC has
little influence on the faculty research impact. In
this study, the correlation between faculty repository activity and research
impact resulted weaker than the correlation between student repository activity
and research impact This is probably due to the fact that faculty also
participate and deposit OA publications in other repositories (disciplinary or
commercial).
Conclusion
In
the context of the ongoing conversation surrounding the role of IRs, this study
investigates statistically if an IR focused on stewarding, preserving, and
disseminating materials created by the student community has a positive impact
on the visibility and performance of faculty scholarship, independent of
faculty’s participation in the IR. This is done by analyzing two distinct
samples of publications:
1.
A
group of faculty publications from six CSM academic departments for which
research impact is calculated based on WoS citation
data
2.
A
group of CSM student publications (senior projects) from the same six CSM
departments that are in DC
The
main conclusion of the statistical analysis is that student repository
activity, quantified through undergraduate senior student projects deposited in
an open IR and the download counts of these projects, is significantly
correlated with the research impact of faculty publications, expressed as a
measure of the citation counts. The authors postulate two factors that may
contribute to this strong dependence.
The
first factor is that undergraduate student senior projects follow (and
sometimes anticipate) the topics of faculty research. Having student work
deposited in an open IR, where it is easily discovered and accessed may
constitute an effective conduit for promoting faculty research.
The
second factor is rooted in the causality between student research quality and
faculty research quality. For the departments analyzed, the results may
indicate that the student research quality, quantified through download counts,
reflects the quality of faculty research. It can be argued that the number of
project downloads may not reflect quality of scholarly output on the same level
as citations; however, downloads are still considered a significant quality
indicator (Haustein, 2014). Haustein’s
study surveyed bibliometricians to assess their
opinions on the potential of alternative metrics (altmetrics).
While the bibliometrics experts surveyed expressed
mixed opinions on the value of altmetrics, 72% still
valued download counts as a valuable source of impact data. Moreover, student
project citations are not easily tracked; therefore, no other indicator was
available for this study to infer student research quality besides IR
downloads. Faculty repository activity in DC, while also positively correlated
with the faculty research impact, had no significant effect on the correlation
between student repository activity and faculty research impact.
To
maintain some uniformity in the data, the study was performed on a coherent
group of departments from the same college (CSM). This resulted in a relatively
small sample of data (N = 6), which
may be regarded as a limitation of the study. To overcome this issue, all
results were thoroughly checked for statistical significance.
Though
no definitive conclusion can be drawn based on the analysis of only six
academic departments, the present study can be viewed as a first step in a
broader research process that can be extended to investigate, among other
factors, the effect of master’s theses IR exposure, direct correlation between
individual faculty research impact and student advisees’ IR activity, and
differences in scholarly communication practices across disciplines.
References
Bendat,
J. S. & Piersol, A. G. (2010). Random data, analysis and measurement procedures. (4th
ed.). Hoboken, NJ: Wiley.
Bornmann,
L. & Daniel, H. D. (2008). What do citation counts measure? A review of studies on citing behavior. Journal of
Documentation, 64(1), 45-80. http://dx.doi.org/10.1108/00220410810844150
Brody,
T., Harnad, S. & Carr,
L. (2006).
Earlier web usage statistics as predictors of later citation
impact. Journal of the American Association for Information Science
and Technology (JASIST), 57(8),
1060-1072. http://dx.doi.org/10.1002/asi.20373
Clarivate Analytics
(2017). InCites indicators handbook. Retrieved from http://researchanalytics.thomsonreuters.com/m/pdfs/indicators-handbook.pdf
CNI
(2017).
Rethinking institutional repository strategies: Executive
roundtable report, May 2017. Retrieved from http://www.cni.org/go/rethinking-irs-cni-er-s17
Devore, J.L.
(2000). Probability and statistics for engineering and the sciences (5th
ed.). Pacific Grove, CA: Duxbury.
Garfield, E.
(1972). Citation analysis as a tool in journal evaluation.
Science, 178, 471-479.
Retrieved from http://www.garfield.library.upenn.edu/essays/V1p527y1962-73.pdf
Garfield, E.
(1973). Citation frequency as a measure of research activity
and performance. Essays of an Information Scientist, 1, 406-408. Retrieved from http://www.garfield.library.upenn.edu/essays/V1p406y1962-73.pdf
Garfield, E.
(1988). Can researchers bank on citation analysis? Essays of an
Information Scientist, 11,
354-356. Retrieved from
http://www.garfield.library.upenn.edu/essays/v11p354y1988.pdf
Gargouri, Y., Hajjem, C., Larivière, V., Gingras, Y., Carr, L., Brody, T.
& Harnad, S. (2010). Self-selected or mandated,
open access increases citation impact for higher quality research. PLoS ONE,
5(10): e13636. https://doi.org/10.1371/journal.pone.0013636
Gregerman,
S. E., Lerner, S. J., von Hippel, W. & Nagda, B.
A. (1998).
Undergraduate student faculty research partnerships affect student retention. The
Review of Higher Education, 22(1), 55-72. http://dx.doi.org/10.1353/rhe.1998.0016
Gross, P. L.
K. & Gross, E. M. (1927). College libraries and chemical
education. Science, 66, 385-389. Retrieved from http://www.garfield.library.upenn.edu/papers/grossandgross_science1927.pdf
Haustein,
S., Peters, I., Bar-Ilan, J., Priem,
J., Shema, H., & Terliesner, J. (2014). Coverage and adoption of altmetrics
sources in the bibliometric community. Scientometrics, 1-19. http://dx.doi.org/10.1007/s11192-013-1221-3
Lei,
S. A. & Chuang, N. (2009). Undergraduate research assistantship:
A comparison of benefits and costs from faculty and students' perspectives. Education, 130(2), 232-240.
Lynch, C.
(2017). Updating the agenda for academic libraries and
scholarly communications. College & Research Libraries, 78(2):126-130. http://dx.doi.org/10.5860/crl.78.2.16577
Massey, F. J.
(1951). The Kolmogorov-Smirnov test for goodness of fit.
Journal of the American Statistical Association, 46(253), 68-78. http://dx.doi.org/10.1080/01621459.1951.10500769
Moed, H.F. (2005).
Citation analysis in research evaluation.
Dordrecht: Springer Netherlands.
Seymour,
E., Hunter, A-B., Laursen, S. L. & DeAntoni, T. (2004). Establishing the benefits of
research experiences for undergraduates in the sciences: First findings from a
three-year study. Science Education,
88(4), 493-534. http://dx.doi.org/10.1002/sce.10131
Appendix
Notations
|
Symbol
|
Description
|
|
α
|
Level
of significance
|
|
a0
|
Intercept
of the regression line
|
|
a1
|
Slope
of the regression line
|
|
AdjR2
|
Adjusted
R2
|
|
CNI
|
Coalition
for Networked Information
|
|
CSM
|
College
of Science and Mathematics at Cal Poly
|
|
Fd
|
Number
of faculty papers downloads in DC
|
|
Fp
|
Number
of faculty papers deposited in DC
|
|
IR
|
Institutional
Repository
|
|
ISI
|
Institute
for Scientific Information
|
|
JEC
|
Journal
Expected Citations
|
|
JNCI
|
Journal
Normalized Citation Impact
|
|
JNCIav
|
Average
of JNCI for all faculty publications in one department
|
|
n
|
Number
of degrees of freedom
|
|
N
|
Sample
size
|
|
NF
|
Number
of faculty in a department
|
|
OA
|
Open
access publication
|
|
QQ-plot
|
Quantile-quantile
plot
|
|
R
|
Sample
correlation coefficient
|
|
R2
|
Coefficient
of determination
|
|
Sd
|
Number
of undergraduate student project downloads from DC
|
|
Sp
|
Number
of undergraduate student projects deposited in DC
|
|
TC
|
Times
cited (or citation count for a given paper)
|
|
WoS
|
Web
of Science
|
|
x, x1, x2
|
Independent
variable
|
|
y
|
Dependent
variable
|
|
|
Predicted
dependent variable
|
|
Z
|
Standardized
normal random variable
|