Evidence in Practice
Transparency and Tiers: Restructuring a
Publisher Deal with a Modified Decision Matrix
Denise Pan
Associate Dean, Collections and Content
University Libraries
University of Washington
Seattle, Washington, United States of America
Email: dpan@uw.edu
Gabrielle Wiersma
Head, Collection Development
University Libraries
University of Colorado Boulder
Boulder, Colorado, United States of America
Email: gabrielle.wiersma@colorado.edu
Received: 16 June 2016 Accepted:
19 July 2016
![]() 2017 Pan
and Wiersma. This is an Open Access article distributed under the terms of the
Creative Commons‐Attribution‐Noncommercial‐Share Alike License 4.0
International (http://creativecommons.org/licenses/by-nc-sa/4.0/),
which permits unrestricted use, distribution, and reproduction in any medium,
provided the original work is properly attributed, not used for commercial
purposes, and, if transformed, the resulting work is redistributed under the
same or similar license to this one.
2017 Pan
and Wiersma. This is an Open Access article distributed under the terms of the
Creative Commons‐Attribution‐Noncommercial‐Share Alike License 4.0
International (http://creativecommons.org/licenses/by-nc-sa/4.0/),
which permits unrestricted use, distribution, and reproduction in any medium,
provided the original work is properly attributed, not used for commercial
purposes, and, if transformed, the resulting work is redistributed under the
same or similar license to this one.
Setting
The
University of Colorado (CU) System consists of five separately administered
libraries, located at four campuses and at three institutions (Boulder, Denver,
and Colorado Springs). Each campus has grown substantially over time, and the
budgets for library materials have not kept pace with increased demand for
resources or the cost of serials inflation. The CU libraries are members of
several consortial groups that negotiate competitive pricing and facilitate
cooperative purchasing. CU Deans and Directors convened the CU Libraries
Electronic
Resources
Team (CLERT), a representative group of librarians with acquisitions and
collection development responsibilities, and charged them to negotiate
consistent access, at the best possible system-wide pricing, for common needs.
In addition to CLERT, most of the CU libraries also participate in the Colorado
Alliance of Research Libraries (Alliance), a regional consortium of thirteen
academic and research libraries. Like many consortia, participating member
institutions benefit from sharing resources through cooperative purchasing and
lending. The Alliance has successfully negotiated several license agreements
for member libraries including major databases and journal packages.
Problem
The
costs to participate in most consortial deals are typically based on publisher
pricing and are generally lower than list price or the cost for a single
library to participate on its own. One particular big deal journal package was
called into question when eleven Alliance member libraries participated in the
purchase; however, the four CU libraries paid for nearly half of the costs. The
CU libraries questioned why they were paying such a large proportion and
whether CLERT could negotiate a better deal for the CU System.
The
historical cost distribution for this particular package was based on print
journal expenditures. Overtime the burden of publisher increases were
experienced disproportionately for the CU system who subscribed to nearly half
of the titles in print when the package was converted to an online package. Most Alliance libraries shared a longstanding
belief that CU Boulder possessed the greatest capacity for absorbing high
inflation costs for serials because it had one of the largest materials
budgets. Initially, this understanding possessed some truth, and CU Boulder
traditionally subsidized the costs of shared resources by paying a larger
amount.
However, CU Boulder
experienced three rounds of budget cuts resulting in serials cancellations
after the initial deal was negotiated and absorbing inflation became
increasingly difficult. Other Alliance libraries
felt similar economic pressures and could not absorb increased subscription
costs either. The deal was in jeopardy of breaking apart. An Alliance task
force was convened to find out what needed to be negotiated in the new contract
and to recommend a more sustainable cost distribution.
Evidence
To demonstrate that
the original distribution needed to be reevaluated, the task force gathered
qualitative and quantitative data from participating libraries. Specifically,
their first survey focused on two themes: 1) satisfaction with the current deal
and 2) priorities for the new contract. The second survey included questions
regarding each library’s budget and willingness to renew. (Both surveys are
available in the appendix.)
For a meeting with
representatives from participating libraries, the authors of this article
prepared a presentation to establish shared understanding, facilitate
discussion, and gather feedback for negotiation with the publisher. Talking
points included explanation of the history of the deal, overview of license
agreement terms, and highlights from the survey. By anonymizing the libraries
and their data presented in tables 1 through 4, this case study retains focus
on methodology.
Table 1 includes
qualitative survey data from each library about their total materials budget,
the approximate percentage of their materials budgets that is dedicated to
serials or ongoing costs, and the percentage of the entire materials budget and
serials budget that is spent on this journal package. This illustrated the significant impact of the costs
of this journal package for each library in the consortium.
Table 2
shows two different methods of calculating the collective benefit or cost
avoidance from participating in the journal package. Both results demonstrate
that libraries are saving money by participating in this package, but savings
varies by institution. Even though the costs of the journal package are
supposed be distributed based on historical spending, Table 3 illustrates how
cost distributions are no longer aligned with the number of subscribed titles
at each library. For example, Library K has 26.61% of the subscribed titles but
pays for 33% of the costs for the package.
Knowing
that a cost distribution based solely on subscription costs produced
inequitable results, the task force calculated costs using other variables that
are commonly used to determine pricing for academic journals, such as Full Time
Enrollment (FTE) and usage statistics. Table 4 includes data about FTE and
usage at each library to calculate costs based on either of those variables
compared to the current distribution. This yielded similar results for Library
K, which would pay less than their initial contribution if costs were based on
FTE or usage. However, this analysis also revealed that using either FTE or
usage alone could drastically impact a few of the libraries in the deal. For
example, Library F has a very large FTE but relatively low usage, while Library
G is just the opposite situation with a relatively small FTE but substantial
usage.
Table 1
Impact on
Materials and Serials Budgets
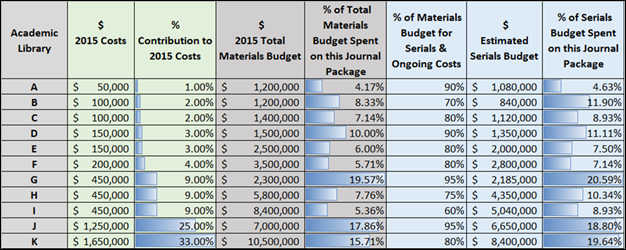
Table 2
Cost Avoidance
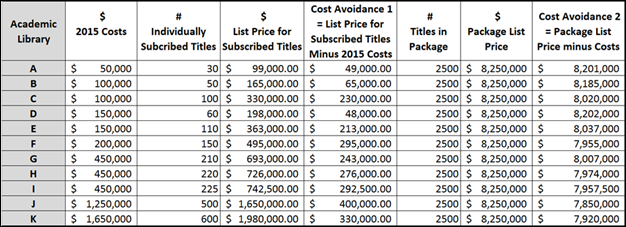
Table 3
Cost
Comparison
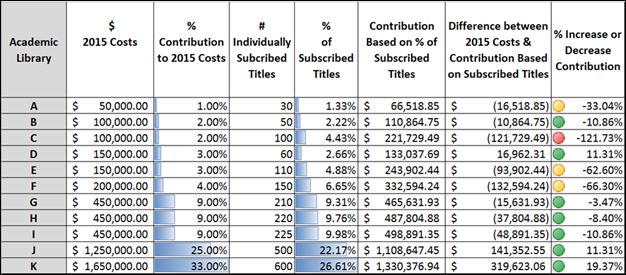
Table 4
Other
Factors for Determining Costs

Using
conditional formatting features available in Microsoft Excel, the authors
demonstrated disparities between libraries both numerically and visually.
Overlaying data bars to represent the proportion of cost that each library
bears quickly illustrated discrepancies. Adding red, yellow, and green icons to
variables, such as cost per use, indicated the relative performance of the
journal package at each library (e.g., green indicated low cost per use and red
indicated high cost per use). Color-coded icons were also used to highlight the
differences between the costs for each model.
The
analysis confirmed that the original distribution gave some libraries
significantly more benefits or less costs than others. It also demonstrated
that relying on a single factor to determine cost would result in similarly
inequitable results. Sharing the results with all of the participating
libraries produced mutual understanding regarding the collective
unsustainability of the package and created the impetus to redefine the
allocation model.
Implementation
In
business management literature, a classical decision matrix has “options on one
axis and criteria on the other.” See an example in Table 5. When used as an
evaluation, the decision matrix can help leaders make better strategic
decisions by extending the “decision frame beyond the obvious options and
criteria” (Enders, König, and Barsoux, 2016, p. 63).
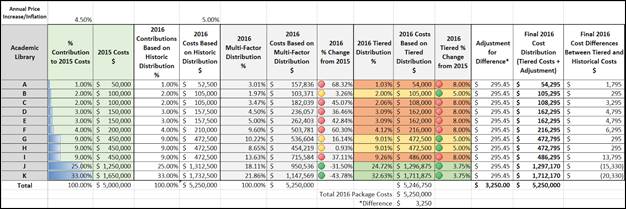
The
authors proposed and the task force agreed to redistribute costs among academic
libraries based on multiple criteria including FTE, usage, and materials
budget. In their modified matrix the decision criteria are presented on one
axis and academic libraries on the other. They determined a percentage of the
total (or weight) for each criteria and used the library’s data to calculate a
percentage of the total for each criteria. The costs are distributed by these
percentages, and the sum determines a library’s share of the total. Once they
identified comparison variables for a weighted decision matrix, they calculated
what a library should pay (Table 6). To ensure that all libraries
remained in the package, they tiered cost distributions into three levels of more
gradual price increases based on what libraries could reasonably pay
(Table 7).
Table 5
Classic
Decision Matrix
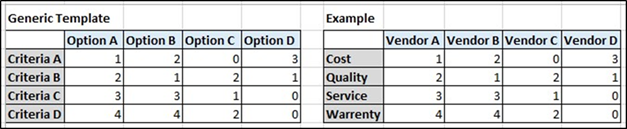
Table 6
Multi-Factor
Cost Distribution Using a Modified Decision Matrix
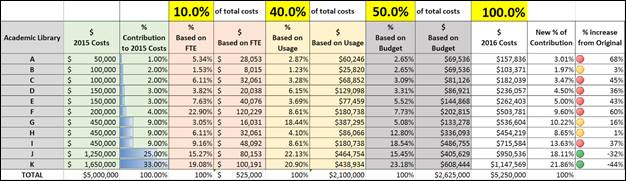
Table 7
Tiered
Cost Distribution
Outcome
Presenting
the evidence in a modified decision matrix expanded the framework for decision
making. This process encourages visualization of options, criteria, and
trade-offs, which can help leaders clarify thinking, engage colleagues, and
promote buy-in from the larger organization (Enders, König, and Barsoux, 2016, p.
68). In the Colorado case study, the modified decision matrix encouraged
libraries to recognize that the historical cost distribution model was no
longer accurate and over time had resulted in some libraries paying a
disproportionately high portion of cost. The Alliance libraries agreed to a new
cost distribution model, and the consortia signed a multi-year journal package
with the publisher. For the CU System, the new cost distribution resulted in
cost savings for Boulder but increases for Auraria and Colorado Springs.
However, the tiered approach kept the costs affordable for all of the CU
libraries, and the net result made the shared purchase viable for the near
future.
Reflection
Consortia
activities are most beneficial when costs and benefits are understood and
shared among all member libraries. The process of surveying participating
libraries, reviewing criteria and variables, and developing cost distributions
should be conducted on a routine basis. The Alliance plans to update the
variables in the decision matrix on a regular basis so that the costs will be
transparent and reflect changes in FTE, usage, or budget for each library.
Conclusion
To ensure better decision making and timely implementation, strategic
business leaders utilize evaluation tools, such as a decision matrices, to
explore options, make choices, and communicate decisions to stakeholders. In
this case study, the authors developed a modified decision matrix with multiple
weighted criteria to redistribute the costs of a purchase that is shared among
consortia of academic libraries. This methodology could be applied to other
scenarios when complex problems require systematic consideration of multiple
criteria and various stakeholders.
References
Colorado Alliance of Research
Libraries. (2016). About. Retrieved 19 March 2017 from https://www.coalliance.org/about
Enders, A., König, A., & Barsoux, J. (2016). Stop jumping to solutions! MIT
Sloan Management Review, 57(4), 63-70. Retrieved from http://sloanreview.mit.edu/article/stop-jumping-to-solutions/
Appendix
Survey Questions
Please note the name of the publisher of the big deal journal package
has been removed from the survey. Minor edits have been made to the surveys for
clarity because it appears here in a different format from the original.
Renewal
Survey, Part 1
Section 1
Please provide feedback about the existing package and license agreement.
1.
Which Alliance library do you represent?
2.
How satisfied are you with the existing journal package?
On a scale between 1
(Dissatisfied) and 5 (Very Satisfied) check one.
3.
How do the following factors impact your satisfaction with the existing
package?
Check one type of impact per
factor: Negatively impact | No impact | Positively impact
a.
Amount of content
b.
Faculty feedback
c.
Student feedback
d.
Librarian feedback
e.
Usability of the platform
f.
Access issues
g.
Usage statistics
h.
License terms
i.
Cost
j.
Are there any other factors that impact your satisfaction that were not
included above?
4.
How likely are you to renew if a new contract was negotiated with the
same or similar terms?
On a scale between 1 (Very
Unlikely) and 5 (Definitely) check one for each scenario.
a.
3 year deal; set at set percent increase
b.
price based on historical title list and transfer titles
c.
access to unsubscribed titles for an additional cost
Section 2
Please provide feedback to help the Alliance negotiate the 2015-2020 contract.
5.
What are some of your priorities for a new contract?
Check one priority level per contract term: Not a Priority | Low Priority |
Medium Priority | High Priority
a.
Reduce our costs
b.
Cap annual increases
c.
Increase amount of content
d.
Create a new title list
e.
Break up the Big Deal and subscribe to individual titles
f.
Create uniform access across Alliance libraries
g.
Secure perpetual rights/post-cancellation access
h.
Add license terms for ADA compliance
6.
How do the following factors influence your decision to participate in
the Alliance package?
Check one level of importance per
factor: Not important | Somewhat important | Very important
a.
Current budget
b.
Projected/expected annual budget increases
c.
Impact of cancellation on ILL
d.
Impact of cancellation on collection size
7.
What factors should be considered to determine our costs for the new
Alliance package? The following factors have traditionally been used to
determine prices for other journal packages or databases. Check all that apply
to your library.
a.
FTE
b.
Carnegie Classification
c.
Number of faculty (total or within certain departments)
d.
Usage
e.
Historical spend for titles
f.
List Price
g.
Other: Please provide details.
8.
Are there other factors to determine price that were not included above?
9.
Would you be interested in exploring different acquisition models for
this content during the negotiations? Check one level of interest per
acquisition model: Not interested | Somewhat interested | Very interested
a.
Evidence-based model
b.
Token-based model
c.
Pay-per-view model
d.
Database subscription model (no title lists, no perpetual access)
e.
One-time purchase model
f.
Other model, to be determined
10.
Are there other acquisition models that should be explored but were not
mentioned above?
11.
Are you interested in adding/integrating other publisher products into
this renewal?
Check one level of interest per product: Not interested | Somewhat interested |
Very interested
a.
Product A
b.
Product B
c.
Product C
12.
Are there other publisher products that should be considered during this
negotiation?
13.
Do you have questions for the publisher?
14.
Do you have any comments or questions for the negotiating team?
Renewal
Survey, Part 2
1.
Which Alliance library do you represent?
2.
What is your FY2014-15 budgeted appropriation for library materials
(excluding gifts, grants, external funding)?
3.
What percent of your library materials budget is typically allocated to
serials/ongoing costs?
a.
30-40%
b.
40-50%
c.
50-60%
d.
60-70%
e.
70-80%
f.
80-90%
g.
90-100%
h.
Other: Please provide details.
4.
If we negotiated another 3-year deal with capped annual increases, at
what percentage increase would you renew? Check all that apply
a.
Below 3.0%
b.
3.5%
c.
4.0%
d.
4.5%
e.
5.0%
f.
Other: Please provide details.