Research Article
Connecting Music and Place: Exploring Library
Collection Data Using Geo-visualizations
Carolyn Doi
Music & Education
Librarian
University Library
University of Saskatchewan
Saskatoon, Saskatchewan,
Canada
Email: carolyn.doi@usask.ca
Received: 23 Jan. 2017 Accepted:
26 Mar. 2017
 2017 Doi. This is an Open Access article
distributed under the terms of the Creative Commons‐Attribution‐Noncommercial‐Share Alike License 4.0
International (http://creativecommons.org/licenses/by-nc-sa/4.0/), which
permits unrestricted use, distribution, and reproduction in any medium,
provided the original work is properly attributed, not used for commercial
purposes, and, if transformed, the resulting work is redistributed under the
same or similar license to this one.
2017 Doi. This is an Open Access article
distributed under the terms of the Creative Commons‐Attribution‐Noncommercial‐Share Alike License 4.0
International (http://creativecommons.org/licenses/by-nc-sa/4.0/), which
permits unrestricted use, distribution, and reproduction in any medium,
provided the original work is properly attributed, not used for commercial
purposes, and, if transformed, the resulting work is redistributed under the
same or similar license to this one.
Abstract
Objectives – This project had two stated objectives: 1)
to compare the location and concentration of Saskatchewan-based large
ensembles (bands, orchestras, choirs) within the province, with the intention
to draw conclusions about the history of community-based musical activity
within the province; and 2) to enable location-based browsing of
Saskatchewan music materials through an interactive search interface.
Methods – Data was harvested from MARC metadata found in
the library catalogue for a special collection of Saskatchewan music at the
University of Saskatchewan. Microsoft Excel and OpenRefine were used to screen,
clean, and enhance the dataset. Data was imported into ArcGIS software, where
it was plotted using a geo-visualization showing location and concentrations of
musical activity by large ensembles within the province. The geo-visualization
also allows users to filter results based on the ensemble type (band,
orchestra, or choir).
Results – The geo-visualization shows that albums from
large community ensembles appear across the province, in cities and towns of
all sizes. The ensembles are concentrated in the southern portion of the
province and there is a correlation between population density and ensemble
location. Choral ensembles are more prevalent than bands and orchestras, and
appear more widely across the province, whereas bands and orchestras are
concentrated around larger centres.
Conclusions – Library catalogue data contains unique information
for research based on special collections, though additional cleaning is
needed. Using geospatial visualizations to navigate collections allows for more
intuitive searching by location, and allow users to compare facets. While not
appropriate for all kinds of searching, maps are useful for browsing and for
location-based searches. Information is displayed in a visual way that allows
users to explore and connect with other platforms for more information.
Introduction
Local music collections
are a type of library collection composed of music or musical materials that
are representative of an identified place or location. Previous approaches for
searching library or archival holdings of local
music in online environments has primarily involved use of public access
catalogues, finding aids, or digital asset management systems. These approaches
to searching are useful for text-based queries, but may hinder understanding of
the connection to place, which is the unique and defining aspect of local
music. This paper illustrates the potential for analysis of local music
materials using a geo-visualization tool based on a case study of large
ensemble sound recordings from a local music collection at the University of
Saskatchewan. Results are presented and analyzed using a map developed on the
ArcGIS platform. This approach uses identification by ensemble location and
categorization by ensemble type, plotted using clusters and points on a
topographic map.
The dataset used for
this research was built from library catalogue records of sound recordings in
the Saskatchewan Music Collection (SMC), a historical local music collection at
the University Library, University of Saskatchewan. The collection aims to
preserve the musical heritage of the province through collection of local music
materials, containing representative items from the early 1900s to the current
day. Items meet collection criteria when they are considered local by
demonstrating a connection to an artist, composer, music label, or topic
relating to places within the Canadian province of Saskatchewan.
This is a growing
collection that, as of January 2017, contains 3202 items, the majority (90.9%)
of which are sound recordings. These items are physically held in the Education
& Music Library at the University of Saskatchewan, and are fully catalogued
and findable in the Library catalogue under the series title “Saskatchewan
Music Collection.” Approximately a third of the SMC has been digitized and is
available online through Sask History Online (SHO), an initiative that aims to
bring together digital collections from galleries, archives, museums, and
libraries within the province (http://saskhistoryonline.ca/). SHO is built on the Islandora platform, an
open-source software framework for digital asset management (https://islandora.ca/).
Project Background
An overview of the
origins of this project will help to contextualize the analysis presented in
this paper. The music represented in the
Saskatchewan Music Collection is not limited by format or genre, aiming to
preserve and make available music pertaining to all aspects of the province’s
history. One of the defining features of this musical history is a prevalence
of music from community-based large ensembles, which have often been
established by and connected to community organizations such as schools,
service clubs, churches, or arts organizations.
During an exhibit of SMC
materials at the University Library in early 2015, it was the albums of
community bands, orchestras, and choirs connected with rural Saskatchewan towns
and cities that especially engaged visitors. The album covers provided a unique
gateway into stories and memories connected with the musical activities of
these places. This experience prompted me to consider how the digitized albums
from the SMC might be presented in a similar way, where one might have the
opportunity to learn more about the connection between the music and geography
of the province.
In the spring of 2016,
the Engineering and GIS Librarian (Kristin Lee) and I (Carolyn Doi) launched a
project to develop a geo-visualization using the local music collection data.
The goals of this project were to create a dataset from the SMC catalogue data,
and to present this dataset online for public use in a geo-visualization tool.
I managed the musicological and music collection management aspects of the
project, while Lee oversaw the aspects related to data management and map
development. Staff in the Education & Music Library, Library Systems &
IT, and the collections unit also offered additional support for the data
collection, cleaning, and implementation of the map.
This paper shows the
process for collecting the data, cleaning the data, and building the
geo-visualization. This is followed by a presentation of findings based on the
data analysis, conducted in late 2016.
Literature Review
History of Music in
Saskatchewan
Saskatchewan is a
prairie province located at the geographic centre of Canada. Settled in 1774
and then created in 1905, the musical life within the province has been defined
in many ways by geography, climate, settlement, and industrial history. Its
musical origins are tied to a diversity of contributors including: “military
and police bands, church choirs, immigrant teachers, enthusiastic residents,
and . . . many travelling groups of instrumentalists and singers who came by
rail across the continent from the earliest days of settlement” (Swales,
2006b).
Literature on the
history of artistic development of the province is sparse, often found
primarily in encyclopedias, general histories of Canadian music, or in more
anecdotal sources such as newspapers and reports. An early account of this
history by Robert Solem, as summarized by Lewis, recounts the quick development
in the early years of the province as especially vibrant:
. . . a period of rapid growth accompanied by a spirit of musical
optimism. By 1912 the city of Saskatoon, for example, could boast of four good
bands, two good orchestras, a Conservatory of Music, and a Philharmonic
Society. This society was established by a large and energetic group of music
teachers (1973, p. 6).
The history of bands,
orchestras, and choirs in the province has been documented intermittently,
primarily through narrative summaries. Despite this, there is evidence that the
province was flourishing with artistic activity.
Orchestras
Although fewer in number
than other types of ensembles, Saskatchewan has maintained two notable
orchestras since the early 1900s. The Regina Symphony Orchestra (RSO) was
founded in 1908 and is known as one of Canada's oldest symphony orchestras.
Originally known as the Regina Orchestral Society, its first concert was given
on December 3, 1908, under the direction of its founder, L. Frank Laubach
(Wall, 2006). Meanwhile, in 1927, 40 amateur members came together to form an
early iteration of the Saskatoon Symphony Orchestra (SSO). The only symphony in
the northern part of the province, the SSO is one of the only ensembles in the
region that performs major symphonic repertoire on a regular basis (Conway,
2006). The presence of these ensembles is significant since they act to
encourage the overall health of the musical community. As “magnets for
orchestral performers,” who by extension “enrich the musical life of the
community as soloists, as players in . . . other musical groups . . . and as
music teachers” (Conway, 2012a).
Bands
Wasiak’s paper “School
Bands in Saskatchewan, Canada: A History”
outlines the history of school band development in the province, including
an overview of curricular development, repertoire, historical impacts,
challenges, and teaching methods. He states that the implementation of band
programs in the schools occurred “comparatively late” in the province and it
was not until the 1950s that bands “gained a foothold in the province's
schools” (2000, p. 113). Development was influenced both by “British bands,
[which] were the prototypes for the first military, civilian, and (later)
community bands in the province” and by “widespread and profound” American
influences, which included teaching methods, repertoire, and expertise (p.
125).
Choirs and Choir Music
The development of the
Saskatchewan Arts Board, choral societies, and arts festivals were influential
in the development and support for the many community choirs, which were
prominent in local churches, schools, and communities (Swales, 2006b). Church,
school, and community choirs were at the core of the Saskatchewan music
festivals in the early 1900s and were known for their large numbers of
participants. “Many church choirs exceeded fifty members, and in the 1950s the
Bishop’s School for Choristers in the Diocese of Qu’Appelle had over 100 boys
annually each summer” (Swales, 2006a). In the paper “What about Choral Art
Music from the Prairies?,” Morgan
identifies five features of choral music from the prairies including: 1) the
Christian church, 2) prairie landscapes, 3) secondary and post-secondary
education, 4) the arrival of new immigrants, and 5) Aboriginal culture (n.d, p.
3). These themes, Morgan states, have had a profound influence on the history
of choral music (and by extension, other musical genres) from the prairies,
which is made up of a “rich artistic community that is well endowed with
musicians who create and develop choral art” (p. 19).
Geo-visualizations and
Digital Libraries
Within the realm of
computer science, there has been extensive literature on the topic of
geo-visualizations as they relate to digital libraries. One of the earliest and
most widely cited pieces of literature introducing the concept of data
visualization comes from Ahlberg and Shneiderman’s chapter titled “Visual
Information Seeking: Tight Coupling of Dynamic Query Filters with Starfield
Displays” from 1993, which discusses the new concepts of
“visual information seeking” applications and methods. The authors pose several
principles unique to visual search such as: “dynamic query filters [that] are
rapidly adjusted with sliders, buttons, etc.,” “starfield display . . . result
sets [that] are continuously available and support viewing of hundreds or
thousands of items,” and “tight coupling . . . query components [that] are
interrelated in ways that preserve display invariants and support progressive
refinement” (pp. 313-14). These principles set the foundation for many of the
visualization case studies being implemented today.
The literature on using
geo-visualizations to understand music collections has focused on personal
libraries (Leitich & Topf, 2007; Torrens, Hertzog, & Arcos, 2004) or
commercial applications (Pampalk, Rauber, & Merkl, 2002). The literature on
data visualizations for use in cultural heritage institutions has been less
saturated, though it is growing in recent years. Much of this research comes in
the form of case studies that focus on how visualizations can: assist
librarians in collection assessment activities (Kilb & Jansen, 2016;
Lowery, 2011), facilitate user understandings of print library collections
(Finch & Flenner, 2016), or improve access to digital collections (Deal,
2014; Shiri, 2008; Hoek & Mayr, 2014).
Music collections have
often presented challenges for libraries and archives when it comes to
information retrieval and organization. Typically, music collections are
represented with textual metadata and searchable using text queries, though
these are not ideal for browsing and serendipitous searching. As Deal identifies,
“browsing features, if they are offered, are often limited to a list of
metadata vocabulary terms or a search that displays the entire contents of a
collection, one page of 10-20 items at a time” (2014, p. 15). Additionally,
finding a way to manage non-textual information such as sound files or images
has posed challenges in the library systems environment. Speaking specifically
on the topic of ethnomusicological collections, Magas and Proutskova identify
both metadata and content management as challenging areas in the design of
music collection information retrieval, especially in relation to the audio
content (2013, p. 152).
Benefits are found when
visualizations are used to engage with spatial representations of data. It is
this interaction that has an “important role in sense-making activities
involving space. It allows users to restructure and modify a space's content
according to their perceptual and cognitive needs. For example, interaction
with the geographic space may support understanding of differences among
various types of locations and their associations with collections.” (Buchel
& Sedig, 2014, para. 3). While literature on geo-visualizations of music
collections in academic settings is limited, there are many examples of projects
within academic, commercial, and public domains that serve as examples of the
potential for such work. Notable examples include maps representing locations
of music library collections (González Ribot, 2015; Ward, 2015), maps
documenting musical events in time such as the Travelling through Time with Sounds project (Europeana, n.d.), and
maps created to link users with items from a music collection, such as the Smithsonian Folkways Holiday Music Map
(2013).
Aims
This project had two
identified aims:
1)
to understand the
number, location, and concentration of community-based large ensembles in
Saskatchewan and
2)
to enable location-based
searching and browsing of the Saskatchewan Music Collection.
These aims support a
longer-term goal to increase the visibility of the Saskatchewan Music
Collection and to increase visibility of Saskatchewan music by making it more
accessible to the public and scholarly community.
Methods
Data Collection and Screening
MARC catalogue records
from the Saskatchewan Music Collection were used as the basis for analysis in
this project. The catalogue data was exported in a .csv file format and
initially contained records for all items from the SMC (3202 items). Screening
criteria were established to narrow the dataset. Items were included if they
met the following screening conditions:
1)
Sound recordings in any
format.
2)
Recordings by large
ensembles that were in an identifiable place (city or town) in Saskatchewan.
Large ensembles were defined as musical groups that self-identified as choirs
(including children’s choirs, church choirs, and community choirs), bands
(including concert bands, wind bands, and pipe bands), or orchestras (symphony
orchestras, string orchestras, and fiddle orchestras).
Items were excluded if
they met the following criteria:
1)
Sound recordings
containing reductions of choir, band, or orchestra music but not performed by a
large grouping of musicians (e.g., a quartet playing string orchestra parts).
2)
Ensembles that were not
associated with a place within the province. For example, a group might be
based in another province, but have recorded the music in Saskatchewan.
3)
Items that had not been
digitized and uploaded to the Islandora digital asset repository system at the
University of Saskatchewan.
The screening was
conducted by applying filters using the “find” feature in Microsoft Excel for
bands, orchestras, choirs, and related subject terms. No date filters were
applied, as all eras were of interest. After the screening process, 119 results
remained.
Data Cleaning
The dataset was cleaned
first using Microsoft Excel and then using OpenRefine software. When the data
was first received, each record contained 113 fields. The empty fields were removed
(many were empty MARC fields) as were any fields determined to be irrelevant to
this project (e.g., the MARC field 90 containing the library call number). MARC
field numbers were then translated to natural language headings. At this point
in the process, a field containing the ensemble location was added. In some
cases, this information was found in the dataset, album cover, or liner notes,
but when the information was not clearly indicated, additional research was
done to identify the location of the ensemble.
In the second phase of
cleaning, the dataset was imported into OpenRefine, an open source application
that can be used for data cleanup processes (http://openrefine.org/). Most of this stage of cleaning involved
adding new fields and standardizing the language within the records. Standard
OpenRefine commands such as “find and replace,” “slice,” “chomp,” and “trim”
were employed to standardize language and organize data. Information on how to
apply these commands in OpenRefine was aided by use of the OpenRefine GitHub
wiki page (Wicentowski, 2015). Records were enhanced by adding new fields and a
unique identifier for each record. The ensemble categories (choir, band, or
orchestra) were added, and in cases where an album included more than one type
of ensemble, multiple categories were applied. Three types of URLs were added
to each record: a link to the item record in the University Library catalogue,
a link to the digital album in the Islandora repository, and a link to the
location of the cover image of the album located on the Islandora server.
Existing information in
the records also needed to be standardized, because of variations in the
catalogue language practices. The information in the 300 field (description)
was used to add a new format field in the record added to indicate the type of
sound recording (formats included 33⅓ rpm, 45 rpm, 78 rpm, and compact disc).
The information found in the 260 field (publication) was extracted to identify
a place of publication. Place names needed to be standardized, as variations in
cataloguing practices have resulted in the same types of information being
represented in multiple ways. For example, the name “Saskatchewan” appears in a
variety of ways, including “SK,” “Sask,” and “Saskatchewan.” Using OpenRefine
facet filters and reconciling category function was useful in grouping
variations of the same word for editing. Using the “cluster” feature allows the
user to group information that might be related and the “merge” option provides
an easy way to reconcile some of the values.
Table 1
Comparison of
Terminology Allowed in RDA 3.4.1.3 Extent (“300 $a,” Yale University)
|
RDA 3.3.1.3
|
Alternative: Common
Usage
|
AACR2
|
|
audio disc
|
CD or compact disc
|
sound disc
|
|
audiocassette
|
cassette or cassette
tape
|
sound cassette
|
|
audio cartridge
|
MiniDisc
|
sound disc cartridge
|
Subject headings found
in the 650 field were cleaned using the OpenRefine “slice” function to remove
unnecessary characters, words, and duplication. For example, “|aChoruses with
band|zSaskatchewan|aBand music|zSaskatchewan” was updated to “Choruses with
band; Band music” in the final dataset. In this case, the word “Saskatchewan”
was removed because it is assumed all items in the dataset are from
Saskatchewan. Semi-colons were added instead of pipes, in order to clean the
appearance of this information in the public-facing map.
Based on the location of
the ensemble, latitude and longitude fields were added to the dataset. This was
done using the Google Geocoding API, a service that converts addresses into
geographic coordinates that can then be used to place markers on a map (Google
Developers, 2017). Instructions for how to translate addresses to latitude and
longitude data were located in the OpenRefine GitHub wiki (Moscovitz, 2015).
The finalized dataset was published through the University of Alberta DataVerse
project (Doi & Lee, 2017b).
Challenges
Using library catalogue
metadata to build the dataset had both advantages and disadvantages. Even
though using tools such as OpenRefine simplified the process, it still took
considerable time and several members of staff to clean and finalize the
dataset. Since the MARC catalogue records had been created by a variety of
means, including outsourced copy cataloguing and internal original cataloguing,
the initial dataset was inconsistent. This was particularly apparent in the way
that musical formats are described in the MARC records. This information is
usually found in the 300 field for physical description, though standards for
the type of information to include in this field varies from AACR2
(Anglo-American Cataloguing Rules, 2nd edition) to RDA (Resource Description
and Access). These may include extent, duration, sound characteristics,
dimensions, content type, media type, and carrier type (Yale University
Library, n.d.a). This information is not always included consistently, and when
it is, variant forms of spelling or terminology may be used. RDA 3.4.1.3 allows
use of either an authorized term from the list at 3.3.1.3, or, as an
alternative, a term in common usage (see Table 1).
The original MARC record
includes a place of publication, but this information was not always
consistently formatted. In some cases, this is because publication information
on sound recordings has not been regulated in the same way as monographs; in
other cases this is because some sound recordings were produced independently
by the artist, resulting in inconsistent formatting on the albums.
While these challenges
with the catalogue data slowed our processes, it was by reducing the size of
the dataset that the project remained manageable. The same work might be more
challenging with a larger or more diverse set of records.
Data Visualization
The dataset was exported
into .csv file format and imported into ArcGIS, a mapping and analytics
platform that provides “contextual tools for mapping and spatial reasoning . .
. to explore data and share location-based insights” (ESRI, n.d.). ArcGIS was
chosen in part because there is internal support for the platform at the
University of Saskatchewan, and more importantly because it provided a stable
platform on which to present the data to meet the research aims for this
project. For this project, we implemented two instances of ArcGIS: a privately
managed project where data can be imported and visualization aspects can be
managed, and a public facing map developed using the Web App Building provided
by ArcGIS (Doi & Lee, 2017b).
The records in the
dataset are plotted on the map per ensemble location. This is defined as the
place(s) where the ensemble was or is primarily located or with which it is
associated. In some instances, an ensemble is associated with more than one
location and appears more than once on the map. The map contains several
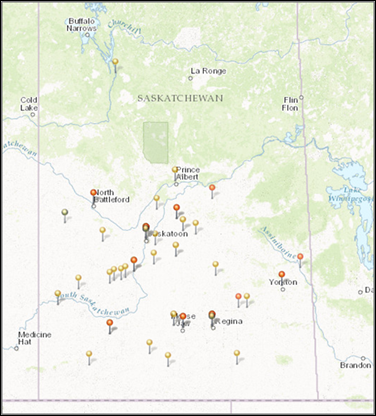
layers, which can be switched on or off by the user. All ensembles can be
displayed on the map using the “all ensembles – location points” layer, which
pinpoints the locations (see Figure 1).
Using the “all ensembles
– location clusters” layer displays the same information using a heat map,
where concentration of ensembles is defined by variations in the colour (see
Figure 2).
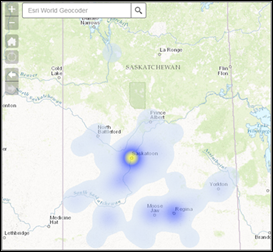
Figure
2
All ensembles – location
clusters layer enabled.
Information about the
ensembles can also be displayed by ensemble type, by switching the orchestra,
choir, or band layers, which displays the representation of each using coloured
pins (see Figure 3).
More detailed
information about each album can be displayed by clicking on specific locations
to reveal an information box or by opening an attribute table below the map.
The displayed fields include album title, ensemble name, ensemble location,
format, publication location, publication date, latitude and longitude
coordinates, a URL linking to the catalogue record, a URL linking to the
digitized album, and an image of the front cover. If more than one ensemble
exists at the same coordinate, this is indicated in the upper portion of the
information box. A search box is present in the mapping interface, which allows
users to search by location (e.g., Saskatoon, Prince Albert, or others) or
place (e.g., University of Saskatchewan, Kinsmen Hall, or others).

Figure
3
Choirs
layer enabled and information box.
Results
Concentrations of
Musical Activity
Comparison of data from
the ArcGIS World Population Estimate map and the SMC heat map reveals a direct
correlation between the number of albums produced and the size of a town or
city (ESRI, 2016). The area measurement tool was used to determine the reach
and concentration of the plotted musical recordings, showing that almost all
the recordings are in the southern half of the province. This accounts for approximately
202,063 square kilometers (34.35%) of the total 588,239.21 square kilometers
occupied by the province (Statistics Canada, 2015).
These findings also show
clusters around larger centres in the province, such as Saskatoon and Regina,
demonstrating a connection between city size and number of ensembles (see Table
2).
Enabling layers within
the ArcGIS map shows the location of ensembles filtered by ensemble type. These
findings show that choirs make up the largest percentage of ensemble recordings
within the province, representing 77.31% of the total albums. Bands make up the
second largest percentage, representing 21.85%, and orchestras make up the
lowest, representing 0.07%. In some of these cases, an album might contain
music from more than one ensemble type, explaining the higher total number of
ensemble representations overall than the total number of albums included in
the dataset. When comparing the number of ensemble types to the location data,
findings show that more concentrated centres such as Regina and Saskatoon are
likely to contain all three ensemble types, while the choirs are more likely to
appear in rural locations (see Figure 4).
Table
2
Saskatchewan
Populations Compared with Number of Albums per Location
|
City name
|
City size (2011 census) (Statistics Canada,
“Saskatchewan Population Report”)
|
Number of albums per location
|
|
Saskatoon
|
222,189
|
41
|
|
Regina
|
193,100
|
18
|
|
Moose Jaw
|
33,274
|
5
|
|
Outlook
|
2,204
|
9
|
|
Swift Current
|
15,503
|
5
|
Figure
4
Concentration
of large ensembles by genre: orchestras, bands, and choirs.
When ensemble types are
compared alongside ensemble names using the table feature in ArcGIS, we can see
trends between ensemble location and the responsible community organization.
While orchestras are more likely to be associated with a city or university
(e.g., University of Saskatchewan Wind Orchestra and Saskatoon Junior Symphony
Orchestra), bands were more often associated with a school, community
organization, or military affiliate (e.g., Aden Bowman Collegiate Band, Melfort
Kinsmen Band, and Royal Canadian Air Force Wing Auxiliary Band,). Finally,
choirs were associated with a wider variety of organizations, including
schools, churches, universities, and community organizations (e.g., College
Park School Choirs and Rosthern Mennonite School Choir). The correlation
between population size, available services or community organizations, and
appearance of musical ensembles demonstrates a strong link between community
development and musical activity within the province.
Search Interface
Comparison of the three
interfaces where the SMC materials are now available for searching shows both
the benefits and drawbacks of searching within the mapping tool. Most notably,
the map allows for non-text based interaction with the collection, while text
searching remains more effective in either the catalogue or Islandora, except
in the case of searching by ensemble location (see Table 3).
Discussion
The findings of this
paper provide an as-yet unseen picture into the history of large ensembles
within Saskatchewan. While the existing narrative histories provide more
anecdotal perspectives on the musical activities, the visualization allows us
to see the big picture of development and its reach within the province.
Ties to Local History
The ability to track the
development of these three large ensemble groups within the province offers
insight into the similarities and differences between them. The establishment
of orchestras and bands typically relies on access to a variety of resources
including specific instruments, instruction, rehearsal space, and musicians,
which may have limited their overall numbers within the province. Bands and
orchestras may have needed community funding or financial support from
community organizations, which could have limited their numbers in comparison
to community choirs. Meanwhile, choirs were well established in the tradition
of church and school activities, and would have required fewer resources. As
churches and schools had a well- developed and pervasive network within both
urban and rural locations in the province, the development of community choirs
throughout the province was inevitable.
Musical activity within
the province was one indicator of development, which can be tied to many
others. Comparing the data of musical recordings to other data related to
community development or local history would provide a more complete picture of
the establishment of such community organizations and individuals within them.
Church records, local histories, or provincial archives might have additional
information on the formation and activity of musical ensembles.
While musical recordings
are just one type of evidence of musical development and activity, it is
nonetheless an important consideration of how music was produced, consumed and
distributed. Access to the album covers and liner notes often provides insight
into the activities of the ensembles, including rehearsal schedules, tour dates
and locations, individual members, and supporting members of the community. It
is these connections to community and place that make these materials such an
insightful window into local history.
Testing a Proof of
Concept
The geo-visualization
was initially developed as a proof of concept. This varied slightly from the
final design presented in this paper, as it used all the SMC items found in the
Islandora platform (over 1000) plotted per publication location. The data analysis
and visualization were realized using CARTO, a software that provides GIS and
web mapping tools for display in a web browser (https://carto.com/). The proof of concept was presented during the
Mountain Plains Chapter Meeting of the Music Library Association (Bogdan &
Doi, 2016), and feedback was gathered on the initial design.
Table 3
Comparison of Search
Interfaces: Library Catalogue, Islandora Digital Repository, and ArcGIS Map
|
Criteria
|
Catalogue
|
Islandora
|
ArcGIS Map
|
|
Text searching
|
Author,
title, subject, keyword, call number
|
Keyword
|
Location
|
|
Visual representation and searching
|
No
|
No
|
Yes
|
|
Portion of the collection
|
Complete
collection, 3000+ albums
|
Digitized
items, 1000 albums
|
Digitized
albums by large ensembles, 119 albums
|
|
Digital object included
|
No
|
Yes – images
and sound files
|
Yes – cover
image
|
|
Information in record
|
Standard MARC
fields:
001, 003,
005, 007, 008, 028, 040, 090, 245, 260, 300, 500, 505, 590, 650, 700, 710,
740, 830, 850, 902
|
Selected MODS
fields: artist, title, item type, table of contents, subjects, bib number, publisher,
place of publication, item description
|
Selected MARC
and added fields: album title, ensemble name, ensemble location, format,
publication location, publication date, decade, latitude, longitude, link to
catalogue record, link to Islandora record.
|
|
Link to other representations of the collection
|
No
|
No
|
Yes – links
to both catalogue and Islandora
|
The feedback revealed
that the geo-visualization had provided an effective overview of the collection
while also compelling users to explore selected albums. However, using the
place of publication as the primary location for the recordings presented a challenge
for users. While in some cases this geographic information was relevant to the
artist or recording (e.g., the album was published in the same city as where
the artist resided), in many others, the location of the music label was
tangentially related, and provided only supplementary information as to how
place relates to the artist or music. Based on this feedback, the dataset was
reconceived from June to August, 2016. These changes ultimately led to the
decision to further limit the inclusion criteria of the dataset, and to
incorporate information about the location of each ensemble.
Challenges
Using catalogue data as
a dataset was challenging because historical cataloguing practices have led to
inconsistencies due to changes in practice, variations in acceptable language,
and human error. This inconsistency was not unique to this collection, and
using library collection data will always require cleaning before use.
In this case, the music
materials themselves also presented additional challenges. Historical sound
recordings offer inconsistent information on basic elements of the publication,
and this inconsistency is amplified when many of the albums are
independently-published as in this case. Examples of this include missing
publication information, or variations in spellings of titles or artists. While
catalogue records are designed to accommodate for variations in spelling or
missing information, these variations are more challenging when trying to
achieve consistency in the dataset.
Limitations
As the process for
adding data to the map is not automated, it does not incorporate newly added
digital items from the SMC. As such, the map represents the collection at a
moment in time, and significant staff time would be needed to add new content.
The dataset used for
this project does not fully represent the recorded history of musical ensembles
in Saskatchewan. There are more known items located in the SMC that were
excluded because they have not yet been digitized. To achieve a more complete
representation of the musical recording history, workflows for adding new
content will need to be established.
Future Work
There are many
possibilities for expanding the work initiated in this research, including
expanding the dataset or adding additional types of information. There is also
potential to realize other aspects of the dataset within the visualization,
including the correlation between date and location.
While the data currently
included is drawn from the SMC, there are many other collections with materials
related to the history of music and large ensembles in Saskatchewan. Special
collections holdings at the University of Saskatchewan or items in the
Saskatchewan History Online project would provide a good starting place for
locating related materials. Such materials might extend the depth and breadth
of the story of this history and would also make good candidates for inclusion
in the project. Saskatchewan’s citizens have produced more than 2000 local
history books, which discuss the histories, lives, and activities of the town
or city, chronicling the “rise (and in some cases, the decline and demise) of
communities, families, churches, and businesses large and small across the
province.” (Massie, 2006). Linking the information in these sources might serve
to build more detailed narratives about the musical histories presented.
While the work to curate
the dataset for this project was done by staff at the university, there may be
opportunities to draw on local knowledge to enhance the data. Since there are
many aspects of local history that are missing from more traditional
information sources, implementing a system for collecting music histories from
the public might be a worthwhile option for developing the map further. By
implementing a crowdsourcing information gathering model, this project would
further serve to engage the public, to use the knowledge of the community, and
to add value to the data (Holley, 2010).
This project focusses on
mapping large ensemble items from the Saskatchewan Music Collection, but there
is potential to extend the mapping template beyond this collection. While not
all collections will be ideally represented in a geo-spatial environment, there
are certainly others to consider that might provide insight when seen through a
geographic lens.
Conclusions
This research presents a
picture of the history of musical life in the province of Saskatchewan and its
connection to historical social and economic development. Findings show that
there is a correlation between the population density of the province and the
prevalence of large ensembles within communities. It provides evidence that
these ensembles are often linked to community organizations and establishments
such as schools, churches, service organizations, and arts organizations. As
the province continues to develop we will certainly continue to see these
connections between music and place continue to grow and change.
Geo-spatial
visualizations have potential as a tool to draw new research conclusions about
the contents of library collections. Researchers who are considering using
catalogue data will find that it is a rich source of untapped data, which has
potential for exploring local histories.
Using an online mapping
tool such as ArcGIS provides an alternative way to explore special collections,
using parameters that are not accessible in interfaces such as the library
catalogue or digital content repositories. These tools demonstrate potential to
attract and engage a wide audience to explore library special collections and
audiovisual materials.
Acknowledgements
Aspects of this work
were originally presented at the 2016 Mountain Plains chapter meeting of the
Music Library Association in Greeley, CO and later at the Centre for Evidence
Based Library and Information Practice Symposium in Saskatoon, SK in 2016. My
thanks to K. Lee who collaborated with me on the implementation of this
project. Thank you to my colleagues at the University of Saskatchewan: C.
Sjoberg for her assistance with cleaning and enhancing the dataset and J.
McLean who offered helpful feedback on OpenRefine and cleaning library
catalogue data.
References
Ahlberg, C., & Shneiderman, B. (1993).
Visual information seeking: Tight coupling of dynamic query filters with
starfield displays. In S. K. Card, J. D. Mackinlay, & B. Shneiderman
(Eds.), Readings in information
visualization: Using vision to think. (pp. 244–250). San Francisco, CA:
Academic Press.
Bogdan, K. & Doi, C. (2016, May). Music in space and time: Using data
visualization to understand a local music collection. Paper presented at
the Mountain Plains chapter meeting of the Music Library Association in
Greeley, CO.
Buchel, O. & Sedig, K. (2011). Extending
map-based visualizations to support visual tasks: The role of ontological
properties. Knowledge Organization, 38(3),
204-229.
Buchel, O., & Sedig, K. (2014). Making sense
of document collections with map-based visualisations: The role of interaction
with representations. Information
Research, 19(3), 29-55. Retrieved
from http://www.informationr.net/ir/19-3/paper631.html#.WDxnufkrK00
Conway, K. (2006). Saskatoon Symphony Orchestra.
In The Encyclopedia of Saskatchewan.
Retrieved from http://esask.uregina.ca/entry/saskatoon_symphony_orchestra.html
Crampton, J. W. (2002). Interactivity types in
geographic visualization. Cartography and
Geographic Information Science, 29(2),
85-98. http://dx.doi.org/10.1559/152304002782053314
Deal, L. (2014). Visualizing digital
collections. Technical Services Quarterly, 32(1), 14-34. http://dx.doi.org/10.1080/07317131.2015.972871
Department of Music. (2015). About ensembles. In
University of Saskatchewan, College of
Arts & Science. Retrieved from http://artsandscience.usask.ca/music/ensembles/
Doi, C. (2015). Local music collections:
Strategies for digital access, presentation, and preservation—A case study. New Review of Academic Librarianship, 21(2), 256-263. http://dx.doi.org/10.1080/13614533.2015.1022663
Doi, C. and Lee, K. (2017a). Choirs, bands, and orchestras of
Saskatchewan v1. Retrieved from https://spatialsk.maps.arcgis.com/apps/webappviewer/index.html?id=de483307f29641a2b7682c3f09d517b8
Doi, C. and Lee, K. (2017b). Saskatchewan music
large ensembles. In University of Alberta
Libraries. http://dx.doi.org/10.7939/DVN/10974
ESRI. (2016). World population estimates.
Retrieved from: http://arcg.is/2jF68Ql
ESRI. (n.d.). About ArcGIS. Retrieved from http://www.esri.com/arcgis/about-arcgis
Europeana. (n.d.). Travelling through time with sounds. Retrieved from http://www.europeana.eu/portal/en/collections/music/travelling-through-time-with-sounds.html
Finch, J. L., & Flenner, A. R. (2016). Using
data visualization to examine an academic library collection. College and Research Libraries, 77(6), 765-778. http://dx.doi.org/10.5860/crl.77.6.765
González Ribot, M. J. (2015, June). Map of Spanish musical heritage.
Presented during the IAML/IMS annual meeting, Music
Research in the Digital Age, 21-26. June 2015, Juilliard School, New York, NY.
Retrieved from http://www.iaml.info/sites/default/files/pdf/map_of_spanish_musical_heritage_gonzalez_ribot_iaml_2015.pdf
Google Developers. (2017). Geocoding API: Getting started. Retrieved from https://developers.google.com/maps/documentation/geocoding/start?csw=1
Hilliges, O., Holzer, P., Klüber, R., and Butz,
A. (2006). AudioRadar: A metaphorical visualization for the navigation of large
music collections. In A. Butz, B. Fisher, A. Krüger, & P. Olivier (Eds). Smart Graphics, SG 2006. Lecture Notes in Computer Science, vol. 4073.
(pp. 82-92). http://dx.doi.org/10.1007/11795018_8
Hoek, W. van, & Mayr, P. (2014). Assessing
visualization techniques for the search process in digital libraries. In S. A.
Keller, R. Schneider, & B. Volk (Eds.), Wissensorganisation
und-repräsentation mit digitalen Technologien. (pp. 63–85). Berlin: De
Gruyter Saur. Retrieved from http://nbn-resolving.de/urn:nbn:de:0168-ssoar-463733
Holley, R. (2010). Crowdsourcing: How and why
should libraries do it? D-Lib Magazine, 16(3/4). http://dx.doi.org/10.1045/march2010-holley
Islandora
(n.d.). About. Retrieved
from https://islandora.ca/about
Kilb, M., & Jansen,
M. (2016). Visualizing collections data: Why pie charts aren't always the
answer. Serials Review, 42(3),
192-200. http://dx.doi.org/10.1080/00987913.2016.1207479
Krygier, J. B. (1994). Sound and geographic
visualization. In A. M. MacEachren and D. R. F. Taylor (Eds). Visualization in modern cartography. (pp.
149-166). New York, NY: Elsevier. http://dx.doi.org/10.1016/B978-0-08-042415-6.50015-6
Leitich, S., & Topf, M. (2007). Globe of music: Music library visualization
using Geosom. Retrieved from http://ismir2007.ismir.net/proceedings/ISMIR2007_p167_leitich.pdf
Lewis, M. (1973). Music in Saskatchewan. CAML Review, 2(1), 6-7. http://caml.journals.yorku.ca/index.php/caml/article/view/4148/3347
Lowery, R. (2011). A visualization tool for
atlas collection assessment. Journal of
Map & Geography Libraries, 7(2),
138-153. http://dx.doi.org/10.1080/15420353.2011.566837
Magas, M. & P. Proutskova. (2013). A
Location-Tracking Interface for Ethnomusicological Collections. Journal of New Music Research, 42(2), 151-160. http://dx.doi.org/10.1080/09298215.2013.821999
Massie, M. (2006). Local history. In The Encyclopedia of Saskatchewan. Retrieved
from http://esask.uregina.ca/entry/local_history.html
Morgan, M. (n.d.). What about choral art music
from the Prairies?: An introduction to Canadian Prairie composers and their
compositions for SATB choir. Retrieved
from https://drive.google.com/file/d/0B1nJvB97aPfgLWtHemw1elI3M3M/view?usp=sharing
Moscovitz, M. (2015). OpenRefine: GeoCoding.
Retrieved from https://github.com/OpenRefine/OpenRefine/wiki/Geocoding
Pampalk, E., Rauber, A., & Merkl, D. (2002).
Content-based organization and visualization of music archives. In MULTIMEDIA ’02: Proceedings of the tenth ACM
international conference on Multimedia. (pp. 570-579). New York, NY: ACM
Press. http://dx.doi.org/10.1145/641007.641121
Sask
History Online. (n.d.). About the
project. Retrieved from http://saskhistoryonline.ca/about
Saskatchewan Bureau of Statistics. (2012). Saskatchewan population report: 2011 Census
of Canada. Retrieved from http://www.stats.gov.sk.ca/stats/population/censuspop2011.pdf
Shiri, A. (2008). Metadata-enhanced visual
interfaces to digital libraries. Journal
of Information Science, 34(6), 763-775. https://doi.org/10.1177/0165551507087711
Schumiatcher, M. & Luko, A. R. (2016).
Saskatchewan Arts Board. In The Canadian
encyclopedia. Retrieved from http://www.thecanadianencyclopedia.ca/en/article/saskatchewan-arts-board-emc/
Smithsonian
Folkways holiday music map.
(2013). Retrieved from http://arcg.is/2jHgrke
Statistics Canada. (2015). Focus on geography series, 2011 census. Retrieved from http://www12.statcan.gc.ca/census-recensement/2011/as-sa/fogs-spg/Facts-pr-eng.cfm?Lang=eng&GC=47
Swales, R. (2006a). Choirs. In The Encyclopedia of Saskatchewan.
Retrieved from http://esask.uregina.ca/entry/choirs.html
Swales, R. (2006b). Music. In The Encyclopedia of Saskatchewan.
Retrieved from http://esask.uregina.ca/entry/music.html
Symes, C. (2004). Setting the record straight: A material history of classical recording.
Middletown, CT: Wesleyan University Press.
Torrens, M., Hertzog, P., and Arcos, J. L.
(2004, Oct.). Visualizing and exploring personal music libraries. Paper
presented at the 5th International Conference on Music Information Retrieval,
Barcelona, Spain, 10-14 October 2004. Retrieved from http://www.ee.columbia.edu/~dpwe/ismir2004/CRFILES/paper214.pdf
Wall, K. (2006). Regina Symphony Orchestra. In The Encyclopedia of Saskatchewan.
Retrieved from http://esask.uregina.ca/entry/regina_symphony_orchestra.html
Ward, J. (2015). An Interactive Map of Musical Institutions in Belgium. Retrieved
from http://www.iaml.info/news/interactive-map-musical-institutions-belgium
Ward, N. (2009). Saskatchewan (province). In The Canadian Encyclopedia. Retrieved
from http://www.thecanadianencyclopedia.ca/en/article/saskatchewan/
Wasiak, E. B. (2000). School bands in
Saskatchewan, Canada: A history. Journal
of Historical Research in Music Education, 21(2), 112-131. Retrieved from http://www.jstor.org/stable/40215213
Wicentowski, J. (2015). GREL functions.
Retrieved from https://github.com/OpenRefine/OpenRefine/wiki/GREL-Functions
Yale University Library. (n.d.a). RDA
descriptive examples (1). Retrieved from http://web.library.yale.edu/cataloging/sound-recordings/music-popular/examples
Yale University Library. (n.d.b). 300 $a (Sound
recordings, RDA). Retrieved from http://web.library.yale.edu/cataloging/sound-recordings/non-music-checklist/300