Research Article
E-Preferred Approval Books at the University of
Manitoba: A Comparison of Print and Ebook Usage
Jan C Horner
Senior Scholar, Collections Management
University of Manitoba Libraries
Winnipeg, Manitoba, Canada
Email: j.horner@umanitoba.ca
Received: 23 Aug. 2016 Accepted: 13 Feb. 2017
![]() 2017 Horner. This is an Open Access article
distributed under the terms of the Creative Commons‐Attribution‐Noncommercial‐Share Alike License 4.0
International (http://creativecommons.org/licenses/by-nc-sa/4.0/),
which permits unrestricted use, distribution, and reproduction in any medium,
provided the original work is properly attributed, not used for commercial
purposes, and, if transformed, the resulting work is redistributed under the
same or similar license to this one.
2017 Horner. This is an Open Access article
distributed under the terms of the Creative Commons‐Attribution‐Noncommercial‐Share Alike License 4.0
International (http://creativecommons.org/licenses/by-nc-sa/4.0/),
which permits unrestricted use, distribution, and reproduction in any medium,
provided the original work is properly attributed, not used for commercial
purposes, and, if transformed, the resulting work is redistributed under the
same or similar license to this one.
Abstract
Objective – To compare the usage of print and ebooks received on University of
Manitoba’s e-preferred YBP approval plan as well as to examine cost per use for
the approval print books and ebooks.
Methods – Usage data was compiled for books received on approval in 2012/2013 to
December 31, 2014. Counter reports were used to determine use and non-use of
ebooks, while vendor reports from EBL and ebrary were used for the cost per use
analysis. Print usage information was drawn from SIRSI and then ALMA when UML
switched systems at the beginning of 2014.
Results – Ebooks received more use than p-books overall, but when examined by
subject discipline, significant differences could not be found for the “STM”
and “Other” categories. With ebooks, university press books tended to be used
more than those from other publishers, but the same result was not found for
print books. Ebrary ebooks tended to be used more often than EBL, EBSCO, and
Wiley ebooks, and single-licence books tended to be somewhat more used than
multi-user ones. Cost-per-use data was much lower for print books, though the
comparison did not look at staffing costs for each medium.
Conclusions – This study finds that of approval books matching the same profile,
ebooks are used more, but print books receive more substantial use. Both
formats are needed in a library’s collection. Future comparisons of cost per
use should take into account hidden labour costs associated with each medium.
Usage studies provide evidence for librarians refining approval plan profiles
and for budget managers considering changes to monographic acquisition methods
and allocations.
Introduction
Libraries
are changing the way they acquire monographs. Demand-driven and publisher
front-list acquisition options are competing with traditional methods of firm
ordering and approval plan delivery.1 Approval plans are intended to
save staff time and can operate despite staff absences or changes. But
libraries are looking more critically at approval plans since purchasing a
publisher’s front list or using demand-driven acquisition can also save staff
time.
This study
looks at the performance of the YBP e-preferred approval plan at the University
of Manitoba Libraries (UML). UML is an ARL and CARL member with an enrollment
of approximately 30,000 and faculties of Agricultural & Food Sciences,
Architecture, Arts, Engineering, Health Sciences, Law, Management, Music, and
Sciences. It is the major research library for the province.
UML is
facing budget challenges similar to those at other ARL libraries where
monograph budget funds have decreased on average 4% over the last three years
reported. UML’s monograph budget has decreased 8.5%.2 During the
same period the financial commitment to demand-driven ebook acquisitions has
remained steady and UML has purchased the Springer ebook collection and
subscribed to other ebook collections (e.g. EBSCO, Knovel). Budget challenges
were thus a strong motive to review the performance of UML’s approval plan.
Literature Review
This study
is quantitative; therefore, qualitative studies of ebook versus print use,
although of interest and value, were not included in the review.
Ebook v
Print Comparisons
Most
quantitative studies of ebook and print monograph usage have examined the same
titles in both formats. In addition,
most of the early studies (e.g., Littman & Connaway, 2004) looked at
Netlibrary titles as a basis of comparison with print. After 16 months of use
the Littman & Connaway study at Duke University found 40% of the ebook
versions had been used and 36% of the print (p. 259).
Kimball, Ives,
and Jackson, in their study (2009), identified 4,288 Netlibrary books in the
sciences that were also available in print. Although the ebooks were used more
times per book, 24% of the ebooks were accessed while 23% of the print versions
circulated (p. 23-24).
More
recently Levine-Clark & Brown (2013) compared the use of Duke University
Press titles online and in print published between 2009 and 2012. A greater
number of print titles had been acquired before the ebook version, but there
were 1,150 titles held in both formats. Of those titles, 54% of the print
circulated and 39% of the ebooks had been used, leading the authors to conclude
that when both formats were available, users preferred the print (slide 25).
Goodwin (2014) looked at the 2011 collection from Duke University Press, 285
ebooks and 275 print (10 matching print titles had not been received by the
study start). Usage was counted to October 2013 (two years, five months) and
resulted in 73% of the ebooks being used and only 29% of the print, although
only 12% of the ebooks received “substantive use.”
A Kent
State study (Downey et al., 2014) did not compare the same titles in print and
ebook. Rather it looked at the performance of 20,000 of the most recently
acquired print books (up to January 2012) added between July 2009 and January
1, 2012 in relation to 20,018 discovery records which were loaded in their
catalogue for a patron-driven acquisition (PDA) project that ran January to
December 2012 using ebrary ebooks. By the end of 2012, 8% of the books in the
PDA discovery pool had been used (p. 148) with only 2% triggering a purchase
(p. 154), but a relatively high number (62.5 %) (p. 149) of the purchased print
books had circulated.
Ebook Usage
Levine-Clark
(2014), working with major ebook vendors EBL and ebrary, examined data for
about 625,000 ebooks across roughly 800 academic libraries. This study could
not be used to predict rates of use in a single library, since the titles had a
massive pool of potential readers. It found that usage of Social Science ebooks
was higher than that for Humanities and Science, Technology & Medicine
(STM) titles in terms of percentage of titles used and average amount of use
(slides 31-36). Patrons spent more time in Humanities ebooks per online session
than for ebooks in the other disciplines. STM ebooks involved more downloading.
EBL and Ebrary titles were examined separately. In general Humanities ebooks
were used more than STM titles on ebrary, and STM titles were used more than
Humanities ones on EBL (slides 31-32).
Comparisons
of Ebook Types of Acquisition
Many
authors have published reports on patron-driven or demand-driven acquisition
(PDA, DDA) programs at academic libraries. However, because PDAs/DDAs count
usage of never purchased titles as well, they are not relevant to the present
study of titles acquired by approval in print and electronic format.
Carrico et
al. (2015, pp. 106-107) compared the usage of ebooks acquired in large
publisher packages with those that were firm-ordered by librarians. In terms of
the packages, 50% were used compared to 52% of the firm-ordered titles. This
figure was somewhat skewed by the use of the medical titles in which 63% of the
package titles and 84% of the firm-ordered titles were used. For the
Humanities/Social Sciences, package titles and firm orders were used 47% and
45% respectively. For Science & Technology package titles and firm orders
were used 49% and 57% respectively.
Print Usage
and Substantive Use of Ebooks
A number of
studies have shown that the percentage of print collections that circulate is
low. Rose-Wiles (2013) examined the circulation for 2005 to 2009 of the entire
collection of 443,577 print books at Seton Hall University and found 21.5% had
circulated (p. 137). However, only 17.7% had been published in the 2000s. She
examined the subset of science books published since 2000 and found 34.5%
circulated 2005 to 2009 (p. 141). A
Cornell University study (2010, p. 2) looked at the circulation of its collection
published between 1990 and 2010 (1.6 million titles) and found that 45% had
circulated.
A 2009
study (Alan et al.) looked at the usage of print titles acquired through
approval plans, examining books received at University of Illinois at
Urbana-Champaign (UIUC) and Pennsylvania State University (Penn State) July
2004 to June 2005 where usage was gathered from July 2004 to March 2007. It
found that 69% of Penn State’s and 60% of UIUC’s approval books had circulated
at least once (p. 70). It was suggested that the higher percentage of use at Penn
State was based on the larger user population, 98,000 versus 45,000 at UIUC. No
breakdown of use/non-use was provided by subject.
Most
studies and guidelines (NISO, 2014, p.34) have exercised caution in drawing
conclusions about the higher number of uses/transactions/sessions of ebooks in
comparison with print usage. Many libraries do not capture in-house use of
their print collections, and some ebook accesses may be equivalent to the act
of taking a book off the shelf, glancing through it, and then replacing it.
Some
authors have looked at measures of substantive ebook use as a means of
comparison with print circulation. Rose-Wiles used viewing of 10+ pages in an
ebook as equivalent to a print check-out (p. 146). Goodwin used viewing 11+
pages as a measure of substantive use (p. 103). Ahmad & Brogan (2012, p.
198) in their case study of EBL ebooks usage, set the standard of more than 9
minutes spent in a book as an indication of reading, since the EBL platform
uses that time to differentiate reading from browsing. In their study 29.12% of
transactions were spent in reading under this definition and 70.88% in
browsing.
None of the
studies mentioned downloading as an equivalent to print check-outs. However,
download could provide a more equivalent measure of comparison to the print
check-out. Some effort is required to download the book. Though shorter than
most print loan periods, a patron can use the ebook offline for one to three
days. With both ebook downloads and print check-outs, there is no way of
knowing how much a book is used while ‘out’ or in ‘offline’ mode.
Aims
This study
assumes that a comparison of print book (p-book) and ebook usage is possible,
especially when substantive use of ebooks is compared with print checkouts.
Given that
the YBP approval plan will deliver a greater proportion of ebooks over time,
this analysis attempts to answer these questions:
- Are approval ebooks being used
at an equal or higher rate than print approval books?
- Is the usage or non-usage of
approval ebooks and print books affected by their broad subject
discipline? Is the usage/non-usage the same or different for the two
media?
- Are university press books
used more than non-university press books, and is usage the same for print
and ebook?
- Did the vendor or type of
license affect the usage of ebooks?
- What is the cost-per-use of an
approval ebook and the cost-per checkout for a print approval book?
Method
Most
comparisons of the performance of p-books and ebooks have been done comparing
the same titles in both formats. Unless an analysis looks at the same titles
purchased at the same time in the two formats, it is challenging to compare
performance over a similar time period. Differing time periods for access may
have affected the results of earlier studies (Levine-Clark & Brown, 2013,
slide 3; Downey et al., 2014, p.145).
Although
the titles are different in the UML comparison of approval books, approval
books, no matter what format, are purchased over the same time period, match
the same subject profile, and come from a similar set of publishers with
similar publication dates. There is a wide variety of ebook platforms on the
market, but the UML ebooks come on four platforms prescribed by the approval
profiles: EBL, ebrary, EBSCO, and Wiley.
In
2012/2013, all subject profiles within the YBP approval plan were converted to
e-preferred with the exception of pharmacy. The e-preferred mode meant that if
an ebook were published within eight weeks of the print version, an ebook would
be received by UML. In 2012/13, 35% of
the approval receipts were ebooks. Usage of the approval books received in
2012/13 was counted to December 31, 2014, so both p- and ebooks were available
for use between 20 and 32 months.
Table 1
Overall
Comparisons of Print- and Ebook Usage
|
|
No. of titles |
No. used |
% used |
|
Print Books |
5,237 |
2,003 |
38% |
|
Ebooks |
1,855 |
872 |
47% |
|
P-Value
two-sided |
proportion
of usage different between p- & ebooks |
0.0011 |
|
|
P-Value
one-sided |
proportion of usage greater for
ebooks |
0.00056 |
|
|
Note: P = <
0.05 |
|
|
|
Source of
data
Lists of
ebooks and p-books received on approval were generated from SIRSI’s Director’s
Station. Some call number and publisher data was retrieved from YBP’s GOBI
database.
While the
Counter Book Report 2 was only available from ebrary, only the Counter Book
Report 1 was produced for EBSCO, Wiley, and EBL ebooks. The Counter Book Report
2 records the number of uses of a section or sections of a book by month and
title, whereas the Counter Book Report 1 counts only the uses of a title by
month, without considering the use of chapters within it. The Counter 2 Book
Report will therefore yield higher uses per title since it counts every section
or chapter of a single title as a separate use, whether they were viewed in
separate sessions or not. Because of this discrepancy, this study does not
attempt to measure rates of use based on Counter reports, only use and non-use.
More detailed information about use was obtained from vendor reports for EBL
and ebrary ebooks for cost per use analysis; EBSCO and Wiley did not provide
detailed information for their ebooks so were not included. Cost per use was
calculated per book and then averaged, rather than the collection cost being
divided by overall use as in other studies (Bucknell, 2010, p. 133; Bucknell,
2012, p. 53).
For
p-books, circulation data was derived from SIRSI to the end of 2013, and then
when UML changed systems, from ALMA for 2014. UML does not have consistent data
on in-house use of its print collections. Therefore usage of print books was
based simply on number of check-outs.
2012/2013
approval results
In this
fiscal year UML received 5,237 p-books and 1,855 ebooks on approval. Of those,
38% of the p-books (2,003) circulated and 47% of the ebooks (872) were used. A
Pearson’s chi-square test for comparing two proportions showed that there was
sufficient statistical evidence to conclude the usage of print and ebooks was
different and that ebook use was greater than print.
A further
analysis was done by broad subject discipline based on the following LC call
number ranges, using the same subject breakdown as Levine-Clark (2014, slide
30).
·
Arts &
Humanities: B-BD,
BH-BX,
C-F,
M-P
·
Social Sciences: BF,
H-L, U-V
·
Science, Technology
& Medicine
(STM): Q-T
Use of
ebooks by broad discipline
This
analysis indicates that usage of ebooks in the broad disciplines is remarkably
similar.
Table 2
Ebook Usage
by Broad Subject Discipline
|
|
No. ebooks |
No. used |
% used |
Proportion of total ebooks |
Proportion of total uses |
|
Arts & Humanities |
635 |
300 |
47% |
34.2% |
34.4% |
|
Social Sciences |
669 |
306 |
46% |
36% |
35% |
|
Science, Technology &
Medicine (STM) |
494 |
236 |
48% |
26.6% |
27.2% |
|
Other |
57 |
30 |
53% |
3.1% |
3.4% |
|
Total |
1,855 |
872 |
47% |
|
|
Use of
p-books by broad discipline
UML
received many more “Arts & Humanities” print books through the approval
plan, but their usage was lower, compared to the size of the collection, while
use of “STM” print books appeared to be higher relative to the size of its
collection.
The results
of the chi-square tests (Table 4 below) provided sufficient statistical
evidence to find that usage of print and ebooks was different and higher for
ebooks in the “Arts & Humanities” and “Social Sciences” categories.
However, there was not statistical evidence to claim the same for the “STM” and
“Other” categories.
Table 3
Print Book Usage
by Broad Subject Discipline
|
|
No. p-books |
No. used |
% used |
Proportion of total p-books |
Proportion of total uses |
|
Arts & Humanities |
2,263 |
807 |
36% |
43% |
40% |
|
Social Sciences |
1,740 |
657 |
38% |
33% |
33% |
|
Science, Technology &
Medicine (STM) |
1,063 |
469 |
44% |
21% |
24% |
|
Other |
171 |
70 |
41% |
3% |
3% |
|
Total |
5,237 |
2003 |
38% |
|
|
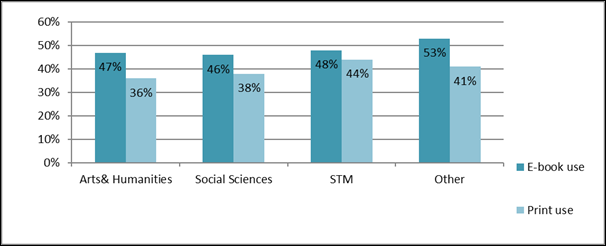
Figure 1
Comparison
of print and ebook usage by broad subject.
Table 4
P- and Ebook
Usage Comparison Chi-square Test
|
Subject |
Proportion of Usage Ebook |
Proportion of Usage P-book |
P-Value two-sided |
P-Value one-sided |
Decision |
|
Arts & Humanities |
0.472 |
0.357 |
<0.0001 |
<0.0001 |
Significant difference |
|
Social Sciences |
0.457 |
0.379 |
0.0004 |
0.0002 |
Significant
difference |
|
STM |
0.478 |
0.439 |
0.1474 |
0.07372 |
Insufficient stat. evidence |
|
Other |
0.526 |
0.41 |
0.1262 |
0.06309 |
Insufficient
stat. evidence |
|
Note: P = <
0.05 |
|||||
Ebooks use
by type of publisher
For ebooks,
usage of books published by university presses was higher, especially
considering use relative to the collection size.
Table 5
Ebook Usage
by Type of Publisher
|
|
No. of ebooks |
No. used |
% used |
Proportion of total ebooks |
Proportion of total uses |
|
University presses |
878 |
449 |
51% |
47% |
51% |
|
Other publishers |
977 |
423 |
43% |
53% |
49% |
|
Total |
1,855 |
872 |
47% |
|
|
|
P-Value
two-sided |
|
|
0.0007 |
Proportion used is different
between university presses & other publishers |
|
|
P-Value one-sided |
|
|
0.0004 |
Proportion
used is greater for university presses than other publishers |
|
|
Note: P = <
0.05 |
|
|
|
|
|
P-books use
by type of publisher
In
comparison with ebooks, usage of print books from university presses did not
appear different from that of print books from trade or other publishers.
Proportionally UML received more university press books (47%) as ebooks while
university press books accounted for only 39% of the print titles received.
Table 6
Print Book Usage
by Type of Publisher
|
|
No. of p-books |
No. used |
% used |
Proportion of total p-books |
Proportion of total uses |
|
University presses |
2,055 |
788 |
38% |
39% |
39% |
|
Other publishers |
3,182 |
1,215 |
38% |
61% |
61% |
|
Total |
5,237 |
2,003 |
38% |
|
|
|
P-Value
two-sided |
|
|
0.4205 |
Proportion used is not
significantly different between publisher type |
|
|
P-Value
one-sided |
|
|
0.2103 |
Proportion
used is not significantly greater |
|
|
Note: P = <
0.05 |
|
|
|
|
|
Ebooks use
by vendor platform
The
analysis by vendor platform suggested that ebrary was the preferred platform.
Table 7
Ebook Usage
by Vendor Platform
|
|
No. of ebooks |
No. used |
% used |
Proportion of total ebooks |
Proportion of total uses |
|
EBL |
867 |
371 |
43% |
47% |
43% |
|
ebrary |
820 |
434 |
53% |
44% |
50% |
|
EBSCO |
77 |
28 |
36% |
4% |
3% |
|
Wiley |
91 |
39 |
43% |
5% |
4% |
|
Total |
1,855 |
872 |
47% |
|
|
|
P-Value
two-sided |
|
|
<0.0001 |
Proportion of usage differs
significantly among vendors |
|
|
Note: P = <
0.05 |
|
|
|
|
|
Table 8
Ebook Usage
by Type of License
|
|
No. of
ebooks |
No. used |
% used |
Proportion
of total ebooks |
Proportion
of total uses |
|
Single
user (ebrary) |
483 |
250 |
52% |
26% |
29% |
|
1
user (EBSCO) |
77 |
28 |
36% |
5% |
4% |
|
Non-linear
lending (EBL) |
863 |
368 |
43% |
46% |
52% |
|
Multi-user
(EBL) |
4 |
3 |
75% |
.02% |
.03% |
|
Multi-user
(Wiley) |
91 |
39 |
43% |
5% |
4% |
|
Multi-user
(ebrary) |
337 |
184 |
55% |
18% |
21% |
|
Total |
1,855 |
872 |
47% |
|
|
|
P-Value
two-sided |
|
|
<0.0001 |
Proportion of usage differs significantly
among the different vendor licenses |
|
|
Note: P =
< 0.05 |
|
|
|
|
|

Figure 2
Comparison
of usage of single user and multi-user licences.
Ebooks use
by license
Ebrary
ebooks seemed to receive higher usage independent of license type.
When
results were separated into single-user and multi-user licenses, single-user
licensed books were used somewhat more.
Substantive
use of EBL and ebrary ebooks
Both EBL
and ebrary provided detailed reports on usage, allowing a better comparison
between p-books and ebooks. The two providers accounted for 91% of the ebooks
received on approval in 2012/2013. Wiley and EBSCO ebooks were excluded from
cost and cost-per-use calculations. For the purpose of this study, substantive
use was determined to have occurred either when a title had been downloaded at
least once, or when 11+ pages had been viewed or read. The level of substantive
use of ebooks (32%) is lower than the overall mean usage (38%) of approval
print books based on check-outs.
Table 9
Substantive
Use of EBL and Ebrary Ebooks
|
|
No. ebooks |
No. used |
No. of sessions/ transactions |
Mean session per book |
Mode session per book |
No. of ebooks down- loaded |
No. of ebooks with substantive
use |
% ebooks with substantive use |
|
EBL |
868 |
371 |
1,519 |
4 |
2 |
149 |
309 |
35.6% |
|
ebrary |
819 |
434 |
1,610 |
3.7 |
2 |
81 |
238 |
29% |
|
Total |
1,687 |
805 |
|
|
|
|
547 |
32% |
|
|
|
|
|
|
|
|
|
|
Mean costs
for EBL and ebrary ebooks
The overall
cost of the EBL collections is slightly higher than that of ebrary’s because it
has about 40% more “STM” books, which tend to be more expensive. In addition,
pricing of an EBL non-linear lending ebook tends to be higher than a
single-user title from ebrary.
A further
analysis was done by broad discipline on the two platforms. The results showed
that in general the EBL books were more expensive than ebrary’s in all disciplines
except “Social Sciences”.
Table 10
Mean cost
of EBL and Ebrary Ebooks
|
|
No. of ebooks |
Cost of all ebooks |
Mean cost of all ebooks |
No. of ebooks used |
Cost of ebooks used |
Mean cost of ebooks used |
|
EBL |
868 |
$87,737* |
$101 |
371 |
$36,826 |
$99 |
|
ebrary |
819 |
$70,556 |
$86 |
434 |
$36,063 |
$83 |
|
Total |
1,687 |
$158,293 |
$94 |
805 |
$72,889 |
$91 |
|
* all
costs given are in Canadian dollars |
||||||
Table 11A
EBL Ebooks Mean
Cost by Discipline
|
|
No. of ebooks |
Cost of all e- books |
Mean cost of all ebooks |
No. of ebooks used |
Cost of ebooks used |
Mean cost of ebooks used |
|
Arts & Humanities |
284 |
$25,168 |
$88 |
116 |
$10,792 |
$93 |
|
Social Sciences |
313 |
$24,801 |
$79 |
123 |
$9,726 |
$79 |
|
STM |
245 |
$31,800 |
$130 |
119 |
$14,863 |
$125 |
|
Other |
26 |
$3,043 |
$117 |
13 |
$1,446 |
$111 |
|
Total |
868 |
$84,812 |
$98 |
371 |
$36,827 |
$99 |
Table 11B
Ebrary Ebooks
Mean Cost by Discipline
|
|
No. of ebooks |
Cost of all ebooks |
Mean cost of all ebooks |
No. of ebooks used |
Cost of ebooks used |
Mean cost of ebooks used |
|
Arts & Humanities |
322 |
$24,426 |
$76 |
173 |
$12,944 |
$75 |
|
Social Sciences |
322 |
$27,574 |
$86 |
174 |
$15,062 |
$87 |
|
STM |
148 |
$17,059 |
$115 |
70 |
$7,133 |
$102 |
|
Other |
27 |
$2,310 |
$86 |
17 |
$1499 |
$88 |
|
Total |
819 |
$71,369 |
$87 |
434 |
$36,638 |
$84 |
Mean Print
Book Costs
The mean
purchase price of all EBL and ebrary ebooks ($94) is much higher than the mean
cost of all print books ($55).
A further
breakdown of this information was done by broad discipline.
Table 12
Mean Cost
of Print Books
|
No. of p-books |
Cost of all p-books |
Mean cost all |
No. of p-books used |
Cost of p-books used |
Mean cost p-books used |
|
5,237 |
$289,672 |
$55 |
2,003 |
$112,318 |
$56 |
Table 13
Mean Cost
of Print Books by Discipline
|
|
No. of p- books |
Cost. of all p-books |
Mean cost all p- books |
No. of p- books used |
Cost of p- books used |
Mean cost (p- books used) |
|
Arts & Humanities |
2,263 |
$109,462 |
$48 |
807 |
$39,735 |
$49 |
|
Social Sciences |
1,740 |
$90,654 |
$52 |
657 |
$33,383 |
$51 |
|
STM |
1,063 |
$79,681 |
$75 |
469 |
$34,774 |
$74 |
|
Other |
171 |
$9,875 |
$58 |
70 |
$4,426 |
$63 |
|
Total |
5,237 |
$289,672 |
$55 |
2003 |
$112,318 |
$56 |
Cost per
Use Comparison
Cost per
use for EBL ebooks, ebrary ebooks, and print books ($57, $51, and $34) was
about 40% less than the mean purchase cost per book ($101, $86, and $56
respectively).
The
cost-per-use data has a non-normal or right-skewed distribution for p- and
ebooks and for all disciplines. Therefore, the nonparametric Kruskal-Wallis
test was used to determine where cost-per-use differs among the three
groups: p-books, EBL ebooks, and ebrary ebooks.
As an
alternative strategy, the square-root transformation was applied to the
cost-per-use figures in all groups in order to reduce the right-skewedness in
the data. A t-test (to compare two groups at a time) and the ANOVA (to compare
all three groups) were conducted on the transformed data and the results were
compared with those from the Kruskal-Wallis test. The reported conclusion is based on the
Kruskal-Wallis test.
EBL and
ebrary ebooks are not significantly different in terms of their
cost-per-use. The mean cost per use is
definitely lower for print books with the exception of books in the “Other”
discipline, where the small sample size fails to lead to a conclusion.