Research Article
Determining Gate Count Reliability in a Library
Setting
Jeffrey Phillips
Student Success Librarian
Robert Manning Strozier
Library
Florida State University
Tallahassee, FL, USA
Email: jbphillips@fsu.edu
Received: 6 June 2016 Accepted:
5 Aug. 2016
![]() 2016 Phillips. This is an Open Access article
distributed under the terms of the Creative Commons‐Attribution‐Noncommercial‐Share Alike License 4.0
International (http://creativecommons.org/licenses/by-nc-sa/4.0/),
which permits unrestricted use, distribution, and reproduction in any medium,
provided the original work is properly attributed, not used for commercial
purposes, and, if transformed, the resulting work is redistributed under the
same or similar license to this one.
2016 Phillips. This is an Open Access article
distributed under the terms of the Creative Commons‐Attribution‐Noncommercial‐Share Alike License 4.0
International (http://creativecommons.org/licenses/by-nc-sa/4.0/),
which permits unrestricted use, distribution, and reproduction in any medium,
provided the original work is properly attributed, not used for commercial
purposes, and, if transformed, the resulting work is redistributed under the
same or similar license to this one.
Abstract
Objective – Patron
counts are a common form of measurement for library assessment. To develop
accurate library statistics, it is necessary to determine any differences
between various counting devices. A yearlong comparison between card reader
turnstiles and laser gate counters in a university library sought to offer a
standard percentage of variance and provide suggestions to increase the
precision of counts.
Methods – The collection of library exit counts identified the differences between
turnstile and laser gate counter data. Statistical software helped to eliminate
any inaccuracies in the collection of turnstile data, allowing this data set to
be the base for comparison. Collection intervals were randomly determined and
demonstrated periods of slow, average, and heavy traffic.
Results – After analyzing 1,039,766 patron visits throughout a year, the final
totals only showed a difference of .43% (.0043) between the two devices. The
majority of collection periods did not exceed a difference of 3% between the
counting instruments.
Conclusion – Turnstiles card readers and laser gate counters provide similar levels
of reliability when measuring patron activity. Each system has potential
counting inaccuracies, but several methods exist to create more precise totals.
Turnstile card readers are capable of offering greater detail involving patron
identity, but their high cost makes them inaccessible for libraries with lower
budgets. This makes laser gate counters an affordable alternative for reliable
patron counting in an academic library.
Introduction
Gate counts are a common tool for the assessment of
libraries, correlating patron visits with the use of library facilities
(Hernon, Dugan, Matthews, & Thornton, 2014). This form of analysis
associates the value of a library with its popularity of in-person patronage,
but requires a thorough collection of quantitative data for a true
justification of expediency. Libraries use various methods for counting
patrons, including laser counters, turnstiles, or designated employees who
physically count the individuals visiting the library. As libraries attempt to
maximize funding, many have implemented counting devices in place of a
dedicated census employee. These devices add numerous advantages beyond
monetary frugality, including both accuracy and security.
With the significantly lower cost of theft-deterrent beam counters, many
libraries purchase these devices for inventory security but remain concerned
about the accuracy of their counting-ability. Libraries who insist on more
accurate counts may choose to implement both theft deterrent beam counters and
turnstiles, with each device maintaining its individual purpose of either
assessment or security. However, with the strict budget concerns that many
libraries are facing, it is of interest to determine if the less expensive
laser beam counters are also reliable assessment tools.
Literature Review
Libraries offer numerous services outside of book collections, and gate
counts are capable of showing the in-person usage of a library in its entirety
(Dotson & Garris, 2008). Although the increase of online resources causes
concern about the viability of physical libraries (Hiller, 2004), universities
need library-like places for student interaction, peer learning, tutoring,
collaboration, and other in-person functions (Hurlbert, 2008). Incorporating
these services presents an opportunity to influence patrons to visit the
library for reasons beyond the collection (Hiller, 2004), and patron counts
help determine if certain events or workshops lead to an increase library
popularity.
By collecting information that tracks the habits,
movements, and patterns of patrons, institutions can identify trends in traffic
over both daily and weekly time frames (Zhu, Aghdasi, Millar, & Mitchell,
2014). This data promotes informed staffing decisions that efficiently match
the amount of employees with the patron population. Patron counts also help
evaluate the effectiveness of outreach promotions and activities.
Turnstiles are more mechanically reliable and provide better patron
security when compared to laser counters (Boss, 1999). These devices offer
correct counts from contact-based functionality, necessitating a physical
interaction between the user and machine (Hashimoto, Kawaguchi, Matsueda,
Morinaka, & Yoshiike, 1998). The design of the turnstile only permits the
passage of one person at a time and counts remain more accurate and consistent
by forcing the user to personally engage the machine’s counting mechanism. In
addition to statistical reliability, unique card swipes also promote better
security, forcing patrons to authenticate their identity to gain clearance
through the machine.
Infrared (horizontal) beam counters do not require physical contact to
operate but instead calculate patron visits by counting the amount of times
breaks occur in the laser beam. The beam transmits to a reflector across the
desired path of measurement, and whenever the connection is broken, the counter
records a new visitor. This is a popular method of counting but accuracy
suffers when more than one person passes through the laser at the same time
(Riachi, Karam, & Greige, 2014). Additionally, problems occur from
obstructions (Dotson & Garris, 2008) and the inability to distinguish
between objects and humans, thus mistakenly counting shopping carts, luggage,
and other objects as patrons (Kryjak & Komorkiewicz, 2013).
Although concerns of counting reliability loom around the functionality
of beam counters, their affordable price influences their popularity. These
devices are capable of offering both counting and theft detection
simultaneously, allowing libraries to use one device to fulfill multiple needs.
Theft deterrent gate systems suggest a reduction of loses from 70%-80%, which
not only may pay for itself with two years, but also helps prevent the loss of
high-demand literature from the collection (Boss, 1999).
Aims
The goal of this research is to promote the collection of accurate
patron traffic counts in a library setting. This study compares over one
million unique library exits from laser gate counters and card swipe
turnstiles, revealing any dissimilarities in their totals. Finalized results
aim to define an average variation between both devices and offer approaches to
enhance the precision of collecting patron counts.
Methods
Variations between turnstile and gate counter data were determined by
inspecting library exit data in a large academic library. Patrons were required
to pass through both devices to exit the building, and each system individually
counted the patron. Users first crossed through a theft deterrent gate system
that contained the laser counter. Several feet afterwards, patrons approached
the turnstiles and were required to swipe their official university
identification card to exit the library. A wall and rope barricade discouraged
patrons from altering the suggested pathway between counting devices and the
entrance contained a separate group of turnstiles that patrons could not use to
exit the library. The entrance turnstiles were located abreast of the exit
turnstiles, prohibiting patrons altering the explicit traffic pattern.
The collection period consisted of 26 random intervals throughout 1
year, with dates ranging from 1 to 35 days. The frequency of these periods
targeted dates that represented busy, average, and slow foot traffic periods.
The computerized record of the individual swipe interactions determined the
turnstile total, while the gate count numbers required a manual monitoring of a
built-in digital gate counter. Turnstile totals calculated the records of an
entire day ending at midnight during the weekdays and 6pm during the weekends,
which required a simultaneous visual confirmation of the laser counter total to
guarantee a precise comparison. This influenced several of the collection
dates, requiring the periods to correspond with the researcher’s availability. The
original research design also focused on variances in collection intervals to
determine if inaccuracies developed from specific days or patron counts, which
encouraged sporadic collection periods.
To create a reliable comparison between the patron counters, it was
necessary to first analyze the turnstile results and eliminate any errors in
their collection. The turnstile totals consisted of all successful card swipes
that occurred throughout the designated date range. However, these outcomes
often included multiple successful swipe acknowledgements for the same person
upon one exit.
Each time the turnstiles encountered a sequence of simultaneous rapid
card swipes, inaccuracies occurred. By default, all swipe processes contained a
one second buffer but the results included any interactions that occurred from
the same patron after the one second delay. Even though the user received
approval to exit through the turnstiles, these swipes also registered as unique
patron exits in the total.
The use of IBM SPSS software corrected these miscalculations.
Sequentially organizing the exit logs allowed for the identification and
elimination of additional successful swipes occurring from the same user within
the same minute.
Results
The total number of laser gate counts (n = 1,035,327) differed from the
total number of turnstile swipes (n = 1,039,766) by -4,439, or -.43%. Although
the laser counter totals were often times greater than the turnstile counts,
the extreme variance from the longest interval of days (Interval 35) made the
final tally of turnstiles exceed the total results of the laser counter.
Table 1
Collection of Patron Counts
|
Interval in Days |
Percentage Difference |
Actual Turnstile Count |
Laser Gate Count |
|
1 |
9.02% |
474 |
521 |
|
1 |
6.95% |
589 |
633 |
|
3 |
4.73% |
1,471 |
1,544 |
|
5 |
4.73% |
1,350 |
1,417 |
|
6 |
-0.58% |
38,385 |
38,162 |
|
6 |
1.09% |
20,344 |
20,569 |
|
7 |
2.59% |
10,670 |
10,954 |
|
7 |
2.79% |
18,989 |
19,533 |
|
7 |
1.33% |
16,884 |
17,111 |
|
7 |
1.78% |
28,582 |
29,101 |
|
7 |
-0.12% |
9,710 |
9,698 |
|
7 |
2.73% |
9,046 |
9,300 |
|
12 |
1.31% |
40,642 |
41,182 |
|
14 |
1.83% |
61,008 |
62,143 |
|
14 |
1.75% |
57,974 |
59,006 |
|
19 |
23.22% |
248 |
323 |
|
20 |
1.13% |
78,024 |
78,918 |
|
21 |
1.62% |
56,918 |
57,857 |
|
21 |
2.44% |
22,975 |
23,549 |
|
21 |
3.72% |
25,079 |
26,047 |
|
21 |
1.43% |
80,867 |
82,037 |
|
22 |
1.42% |
85,854 |
87,090 |
|
24 |
2.69% |
10,437 |
10,725 |
|
28 |
0.50% |
89,606 |
90,052 |
|
33 |
1.47% |
164,359 |
166,803 |
|
35 |
-20.02% |
109,281 |
(possible error) 91,052 |
As Table 1 displays, the results often remained within 1% to 3% of one
another. The most common period of data collection took place at seven days, in
which the difference never exceeded 2.79% throughout all six collection
periods. Information gathered from a period of less than a week was the most
inconsistent, ranging from 1.09% to 9.02%.
The results note a range of possibly distorted data due to an error in
the gate counter’s functionality. Interference caused the theft deterrent
system to stop operating and required a system reboot to continue proper
functionality. On the readout, an error code replaced the count listing, making
it unknown if this error also affected the counting ability of the machine.
This data period (Interval 35) was grossly different from the other periods,
and eliminating this information from the total would change the total
difference by 2%, with the laser counters yielding a 1.5% higher result than
the turnstiles.
Figure 1 shows that the largest variances between the counters resulted
from Interval 19 (23.22%) and Interval 35 (-20.02%). Conversely, the difference
of 23.22% was only comprised of 75 patrons, whereas the difference of -20.02%
involved 18,229 users. The collection period with the largest quantity of
patrons (n = 164,359) only showed a difference of 1.47% between both systems.
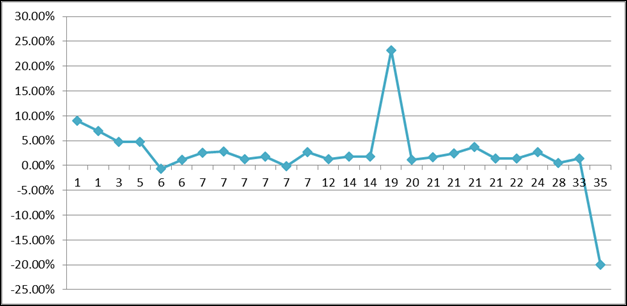
Figure 1
Percentage of difference between the counters
and the interval of collection days
Discussion
The single-user multiple-swipe theory appeared to be a significant
factor in distorting finalized turnstile counts. To gain an accurate result of
patron activity through the turnstile card readers it was necessary to export
the turnstile totals into SPSS software. Analyzing all sequential swipes from
the same user concluded that the data consisted of 65,475 duplicated swipes, or
-5.92% of the yearly turnstile total. The turnstile totals removed all
instances of these duplicated entries before the comparison analysis began.
Future studies may determine the reasons for patrons to perform a rapid
succession of swipes in the reader upon exit. For example, this behavior could
be a result of swipe anxiety, a feeling of impatience, or psychological
mimicry.
Gate counters have difficulty providing an accurate assessment when
multiple patrons exit in a staggered or side by side formation. This results in
totals that are less than the turnstile count, with multiple patrons
registering as a single person. However, the majority of collection periods had
the beam counter producing a larger number of patron visits than the
turnstiles. A possible factor contributing to this increase resulted from the
theft deterrent feature of the gate system.
The theft deterrent gate system alarm notifies patrons with sensitized
materials to return to the circulation desk for desensitization of those items.
While the beam counter has processed a successful exit, the patron is required
to return to the circulation desk before reaching the turnstiles. When
returning to the circulation desk, the patron will cross through the theft
deterrent gate system again, creating a second count for the same exiting
patron. After desensitization of their materials at the desk, the patron
returns through the beam counter for a third count of their same attempt to
exit the library, finally the turnstile for the first time. In this situation,
the turnstile count system would only register this as one event, whereas the
beam counter assumes three separate exits have occurred.
Whereas the largest discrepancy in data (Interval 35) could be the
result of an equipment error, a possible outlier occurred from an interval of
19 days, where the totals varied 23.22%. Fortunately, this was also the period
with the lowest total of patron visits, and failed to create a significant
variance in the yearly total.
Conclusion
Turnstile card readers and laser gate counters provide similar
reliability as counting devices in an academic library setting. The totals of
both devices in a one year study shows a difference of less than half of a
percent (.43%) and the majority of collection periods did not exceed a
difference of 3% between the devices.
Turnstile readers may encounter a multiple swipe dilemma, counting the
same patron several times for one particular exit. It is necessary to inspect
and edit these records for an accurate portrayal of library visits in a
turnstile environment. Alternatively, multiple users simultaneously exiting the
library threaten the reliability of laser gate counters. These devices may have
difficulty in distinguishing the difference between individual patrons and
multiple users walking side-by-side, providing less results than actually
occurred. However, the occasional patron who must return to the circulation
desk to desensitize materials before exiting the library appears to balance
this divergence.
Both turnstiles and laser gate counters offer additional functionality
beyond basic counting. Turnstiles offer better physical security and the
ability to record individual patron statistics, but their higher cost may
dissuade potential buyers. Alternatively, laser gate counters do not offer the
same level of physical security, but can provide product security and decent
dependability at a lower cost. When evaluating both systems as instruments for
collecting patron activity, they generate similar results in reliability.
Therefore, the accuracy of patron counts are comparable between turnstiles and
laser gate counters in an academic library settin
References
Boss, R. W. (1999). Security technologies for libraries: Policy concerns
and a survey of available products. Library Technology Reports, 35(3),
271.
Dotson, D. S., & Garris, J. B. (2008). Counting more than the gate:
Developing building use statistics to create better facilities for today's
academic library users. Library Philosophy and Practice.
Hashimoto, K., Kawaguchi, C., Matsueda, S., Morinaka, K., & Yoshiike,
N. (1998). People-counting system using multisensing application. Sensors
& Actuators A: Physical, 66(1-3), 50-55.
Hernon, P., Dugan, R. E., Matthews, J. R., & Thornton, K. (2014). Getting
started with evaluation. Chicago, IL: ALA Editions.
Hiller, S. (2004). Measure by measure: Assessing the
viability of the physical library. The Bottom Line, 17(4), 126-131.
Hurlbert, J. M. (2008). Defining relevancy: Managing the new academic
library. Westport, CT: Libraries Unlimited.
Kryjak, T., & Komorkiewicz, M. (2013). Hardware-software vision
system for moving people counting based on 3D information. Image Processing
& Communications, 18(2-3), 71-81. http://dx.doi.org/10.2478/v10248-012-0081-4
Riachi, S., Karam, W., & Greige, H. (2014). An improved real-time method for counting people in crowded scenes
based on a statistical approach. Paper presented at the 11th
International Conference on Informatics in Control, Automation and Robotics,
Vienna, Austria.
Zhu, H., Aghdasi, F., Millar, G. M., & Mitchell,
S. J. (2014). Online learning method for people detection and counting for
retail stores. U.S. Patent No. 20140270358 A1. Google Patents.