Introduction
Library use is a measure of implied value (Tenopir, 2013). Measuring changes in usage over time and
the impact of internal and external factors on usage is of interest as
libraries are looking for ways to demonstrate continued library value.
One aspect of library usage is library website usage.
Changes to the website may or may not affect the number of visits to the
website, but it could affect usage of specific services or resources by making
them more visible than before. While design changes may be based on research
prior to the redesign, the effect of changes can also be evaluated after they
are made, using both qualitative methods, such as usability studies, and
quantitative methods, such as transaction log analysis.
The Iowa State University Library website includes a
discovery service through Ex Libris’ Primo, lists of
article indexes and databases, e-journals, course reserves, “Ask Us!” online
reference service, digital collections, special collections, and general
information about the library and library services. To evaluate website usage
over time, enrollment levels, which have been increasing at Iowa State
University, must be taken into account.
Library website usage data (visits as defined by IP
address) from server transaction logs are analyzed in this paper. Three factors
are included in the analysis: increasing enrollment (using website visits per
headcount as the dependent variable); graduate to undergraduate enrollment
ratio; and visits starting on the George Washington Carver Digital Collections
pages.
In general, sources of visits to the website include
robots, people unaffiliated with the university, and faculty, staff,
undergraduate students, and graduate students from the university. Robot visits
are filtered by the AWStats software. Otherwise, IP
addresses do not identify the group of the visitor. It would be possible to
filter by on-campus or off-campus IPs, but faculty, staff, undergraduates, and
graduate students can all access the website from off-campus, and people
unaffiliated with the university could access the website from an on-campus IP
address. The graduate to undergraduate enrollment ratio is included in the
model as this ratio is decreasing due to increasing undergraduate enrollment
(from 21,607 in Fall 2008 to 27,659 in Fall 2013) and flat graduate enrollment
(Figure 1). The ratio should have an influence on visits per headcount as
survey data shows that graduate students report more frequent library website
usage than do undergraduates.
The George Washington Carver Digital Collections pages contain digitized
photos, letters, and other documents related to botanist and
inventor George Washington Carver, Iowa State Agricultural College's (later
Iowa State University) first Black student and faculty member. The
George Washington Carver visits are included because it seems plausible that
many of these visits originate in the primary and secondary schools and many of
the visitors are not affiliated with the university. These visits peak in
February, which is Black History Month in the schools, and have been
decreasing. This variable is included to remove a portion of the non-affiliated
visits from the estimate, leaving an estimate of the mean yearly change that
more closely reflects usage by students, faculty, and staff. Worldwide, George
Washington Carver-related search engine searches have been declining over the
last several years, according to Google Trends.

Figure 1
Headcount enrollment, February 2008 through July 2014.
Another analysis was conducted, with the goal of estimating the average marginal
effect on number of library website visits per additional student from each of
these groups: graduate students, level 2, 3, and 4 undergraduates, and
freshmen, after accounting for other factors, and comparing this result with
estimates of usage from survey results.
Literature Review
Is it true that college students think (and act on)
the statement "everything needed for research is available free on the
Web" (Cochrane, 2007)? If so, is this tendency increasing?
The value of the library as a source of information
has competition. Students and faculty have choices besides the library website
for starting their research, such as Internet search engines, Google Scholar,
Google Books, Wikipedia, and Hathi Trust (Education
Advisory Board, 2011). Liu (2008) wrote that academic library websites have to
compete with many other sites which may seem more entertaining or easier to
use, such as Amazon, Google, or YouTube, although libraries provide higher
quality scholarly information. Connaway, Dickey, and
Radford (2011) found that users chose sources which were convenient and “good
enough,” with search engines as the most frequently used sources for graduate
and undergraduate students.
Accordingly, usage of library websites may be in
decline. A study from OCLC shows such a decrease among college students, from
61% in 2005 to 57% in 2010, although 22% of students who do use the website use
it at least weekly, an increase of 7% over 2005 (De Rosa, Cantrell, Carlson,
Gallagher, Hawk, & Sturtz, 2010). The Measuring
Information Services Outcomes (MISO) survey found a decrease in student usage
of library websites between 2008 and 2010 (Allen, Baker, Wilson, Creamer, &
Consiglio, 2013). Wood and Walther (2000) reminds us
that, although there is a wealth of free information on the Internet, the
profit motive remains strong for publishers, and patrons will need libraries to
receive free access to subscription material.
Nackerud, Fransen, Peterson, and Mastel
(2013) collected demographic data on licensed database, e-journal, and e-book
usage and website logins at the University of Minnesota via a “click-thru”
script, and found that 65% of undergraduates used electronic resources or
logged into the website, while 82% of graduate students did so.
Marek (2011) offers comprehensive advice on setting up
and using web analytics in a library. Cohen (2003), Jansen (2006), and Goddard
(2007) discuss technical details of Web server transaction log analysis.
Transaction log analysis is more often used to measure cross-sectional aspects
of website usage than trends over time (Asunka, Chae, Hughes, & Natriello,
2009; Ke, Kwakkelaar, Tai,
& Chen, 2002; Li, 1999; Park & Lee, 2013).
Time series regression and Autoregressive Integrated
Moving Average (ARIMA) methods (Box, Jenkins, & Reinsel, 2008) are
usually used for forecasting. Ahiakwo (1988), Brooks
(1984a and 1984b), and Naylor and Walsh (1994) have used these methods for
forecasting circulation. All of these researchers included regression variables
to improve their forecasting models. In this study, rather than being used to
improve forecasting, the magnitude of the effect of the regression variables
are of interest in explaining trends in website visits.
Methods
Transaction Log Analysis
The Iowa State University library has been capturing
and parsing transaction log data with AWStats
software and has data available on website usage since February 2008. AWStats defines a library website visit as one or more page
accesses during an hour by a single IP address. A unique visitor is defined by
IP address as well.
Visits data were cleaned and partitioned by using the
counts for entry for each page. An entry page is the first page visited during
a session. The total count for entries should equal the count of visits. Some
counts were discarded as they showed the entry page to be a URL not belonging
to the library, such as “http://www.styleusagroupco.com/.” Visits starting on staff intranet
pages were also discarded. Two days had counts of zero and were assumed
missing. Interpolated values were added to the cleaned monthly count.
A plot of the cleaned total library website visits
from February 2008 through July 2014 is shown with a plot of visits starting on
Special Collections and ISU Digital Collections George Washington Carver pages
in Figure 2.
A visits-per-headcount statistic was created by
dividing the number of visits by the sum of enrollment and employment
(students, faculty, and Professional & Scientific (P&S) staff
headcount). This leaves out website visitors who are currently unaffiliated
with the university, and other groups, such as university retirees and
classified staff. The number of unaffiliated website visitors could vary
substantially over time.
An average monthly student count was calculated for
the months of August, December, January, and May for each year, which includes
weeks when school is not in session. For weeks between semesters the number of
undergraduates was set to zero, while the number of graduate students was set
to the enrollment for the next semester.
Usage Rates of Undergraduates, Graduates, and Faculty
The pattern in the graph of all visits (Figure 2) is
inverted in the graph of visits per headcount (Figure 3). While the number of
visits drops markedly in the summer and between semesters when there are few
undergraduates around, the number of visits per headcount goes up markedly in
the summer.
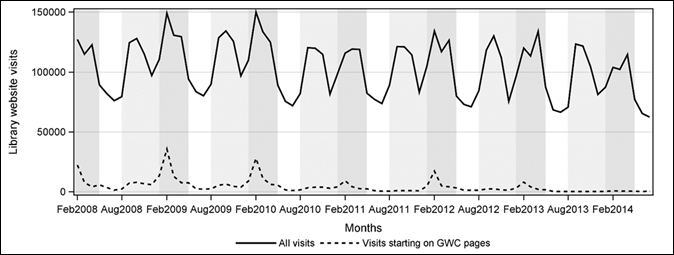
Figure 2
Plot of all library website visits with plot of visits
starting on George Washington Carver pages.
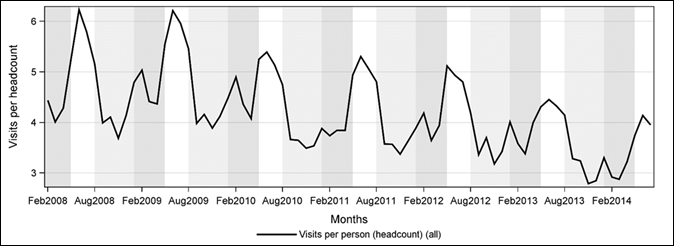
Figure 3
Visits per month per total headcount of students,
faculty, and P&S staff.
Although in Figure 2, the highest number of website
visits coincides with the highest number of students present, it does not
necessarily follow that students are the source of most of the visits.
Anecdotally, some undergraduates never or rarely use the library website.
Alternative explanations for the increase in visits could include an increase
in usage by faculty or staff during the semesters, perhaps in preparation for
classes or for research; it is also possible that there is some usage from the
primary and secondary schools, which are also in session at roughly the same
time.
In 2012, the Iowa State University library conducted a
survey to measure satisfaction, importance, and usage levels for library
services and resources. From this survey, a
rough estimate of the self-reported number of visits per month can be made for
each of these groups: lower and upper division undergraduates, graduate and
professional students, faculty, and P&S staff. Freshmen were not included in
the survey, so classification year 2 comprised lower division, and
classification years 3 and 4 comprised upper division.
For answers to the question “How often do you use the
e-Library (i.e., Library website)”, visits per month were assigned as follows
to the answer choices:
- Daily: 16
- Weekly: 4
- Monthly: 1
- Once a
semester: 0.3
- Less often:
0.2
- Never: 0
While graduate students and faculty clearly use the
library website more than undergraduates (p<.0001), the evidence is weak
that faculty members use the website more than graduate students (p=0.11), or
that upper level undergraduates use the website more than sophomores (p=0.27)
(Table 1). It is unknown if freshmen would be different, since they were not
included in the survey, which was conducted in the Fall.
Contrast statements were used to test the differences between the groups.
Table 1. Estimate of Average Library Website Visits,
by Group, from 2012 Survey
|
|
Mean visits per
month
|
|
Faculty
|
6.4
|
|
Grad and professional students
|
5.7
|
|
Second year undergrads
|
1.4
|
|
Upper division undergrads
|
2.0
|
|
P & S
|
1.5
|
Since graduate
students are more frequent users of the library website than undergraduates (by
self-report), the declining graduate to undergraduate enrollment ratio may be
contributing to declining visits per person. The ratio is also seasonal, with
peaks in the summer when undergraduate enrollment is much smaller (Figure 4).
Seasonal Differences
Seasonality in the data needs to be accounted for,
either by eliminating it by seasonal differencing, or by including other
variables, such as indicator variables for months. In this analysis, all
variables were seasonally differenced: for each value, the value from twelve
months before was subtracted. The resulting estimates from the model include an
estimate of the mean yearly change, after controlling for each of the included
explanatory variables.
Regression with ARMA Errors
Ordinary regression applied to time series data
presents problems, as residuals from the model are often correlated (a value at
one point in time is likely to be similar to its neighbor), thus violating the
assumption of independent residuals needed for regression analysis.
If the residuals are correlated, then some available
information won’t be used in the model, resulting in inaccurate estimates of
coefficients (Granger & Newbold, 1986; Hyndman & Athanasopoulos,
2014). Other problems include invalid statistical tests, as the residual
variance is estimated incorrectly, and misleading correlations, or spurious
regressions (Pankratz, 1991, p. 12, or for absurd
examples see the website Spurious
Correlations).
Autocorrelation in the residuals can be removed by
using regression with ARMA errors (called dynamic regression by Pankratz, 1991, also called transfer function
or ARIMAX). The residuals are modelled as a time series with terms
referencing past history of the series, leaving white noise, independent
residuals. These terms can be autoregressive (AR), which are portions of past
values, and/or moving average (MA), which are portions of past random shocks.
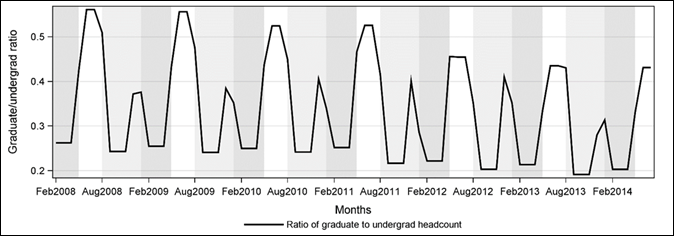
Figure 4
Ratio of graduate and professional student to
undergraduate headcount enrollment.
Autoregressive terms for lags 1 and 12, with a
multiplicative term for lag 13 were added, but there were still significant
autocorrelations at lags 3 and 6 (second row of Figure 5). This suggests a
trading day effect (Pankratz, 1991, pp. 115-118).
A trading day effect (a count of the number of
weekdays in each month) is included to remove remaining autocorrelation in the
residuals. Weekdays have more website visits than weekends. The number of
weekdays can vary. For example, a month might have four or five Wednesdays in
different years. Adding the weekdays term lowered the Akaike information criterion (AIC) from -21 to -42 and the
autocorrelation function (ACF) and partial autocorrelation function (PACF)
display no significant autocorrelation. In each succeeding model,
autocorrelation is removed from the residuals, the model fits the observed
values more closely, and the confidence interval gets smaller (gray bands)
(Figure 5).
In Figure 5, the top row is a regression model of
visits per headcount, seasonally differenced, with two independent variables,
graduate to undergraduate enrollment ratio and visits starting on Carver pages
(both seasonally differenced). The residuals from the model are autocorrelated, as seen by the serial grouping of observations
above or below the predicted line, and as shown on the ACF plot on the right.
The second row adds autoregressive terms for lags 1 and 12, with a
multiplicative effect for lag 13. This removes the autocorrelation in lags 1
and 2, but lags 3 and 6 in the ACF indicate a trading day effect. In the third
row, another variable for number of weekdays per month was added, leaving no
significant autocorrelation in the residuals.
The final model is:
y’t
= µ + β1Ratio’t + β2GWC’t + β3Weekday’s3,t + n’t, and n’t=φ1y’t-1 + φ12y’t-12
- φ1φ12y’t-13 + et
where
y’t = visits per headcount at month t
(seasonally differenced), µ is the mean change adjusted for other factors in
model, et are uncorrelated residuals, and all
independent variables are seasonally differenced.
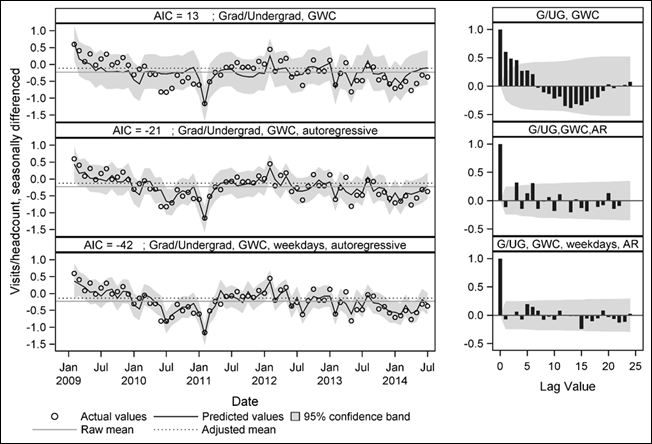
Figure 5
Autoregressive terms at lags 1 and 12 (middle row) removes
most of the residual autocorrelation. Adding a variable for the number of
weekdays in a month leaves uncorrelated residuals (bottom row).
To provide a comparison, in case enrollment sizes are
not the true driver of higher website visits during the semester, an indicator
variable for Fall and Spring semesters, replacing the graduate to undergraduate
enrollment ratio, was included in an alternative model. For the months of
January, May, August, and December, which were partially included in the
semester, an average indicator was calculated.
To get a new measure every year of the adjusted mean
change, and to see how the effect of the explanatory variable changes over
time, the analysis was repeated for rolling time windows of equal length. The
results are a smoothed and more easily interpretable metric that can identify
correlations that change over time (Zivot & Wang,
2006). A four-year (academic year) rolling window with 48 observations was
chosen. Seasonal differencing leaves 36 observations available to estimate the
model, resulting in a three-year average of differences.
Another analysis estimated how often students from
different groups visit the website, on average, after past history, the effect
of the other groups, and other factors are taken into account. This marginal
effect is estimated by the coefficient of the variable in the regression model.
The data were not seasonally differenced. Instead, a
number of other variables besides enrollment are included to account for
seasonality: the number of George Washington Carver entry page visits, a count
of library closed days for the two weekdays of Thanksgiving break and weekdays
closed during winter break, and a count of weekdays minus the other holidays
and break days per month. Additionally, December 24 and the days between
Christmas and New Year’s, if the library was not closed, are counted as
holidays. The model includes autoregressive terms for lags 1 and 12. Again,
this model was compared to a model containing an indicator variable for Fall and Spring semesters, rather than enrollment variables.
Results
Effect
Sizes
In time series models, most of the month-to-month
variation is explained by past history (top row of Figure 6). Pierce (1979)
developed a regression R2 that measures how much of the remainder of
the variation (the innovation variance) is explained by the independent
variables. The weekdays adjustment is excluded from
the regression R2 in this analysis.
The graduate/undergraduate ratio explains 23% of the
innovation variance (the variance that is not explained by past history and the
weekdays adjustment). The adjusted mean estimate is -0.17. The Carver
visits explain 34% of the innovation variance, with adjusted mean of -0.19.
Both variables together explain 58% of the innovation variance (Figure 6).
The adjusted mean with both variables is -0.14, with a
95% confidence interval of -0.24 to -0.03, compared to the raw mean of -0.23.
The magnitude of the adjusted mean decrease is 61% of the magnitude of the raw
decrease.
The alternate model with the averaged Fall/Spring
semester indicator variable fit slightly worse than the final model, with an
AIC of -37, compared to -42, and a regression R2 of 55%.
Redesign
Effect
After a website redesign in August 2010, there appears
to be a drop in both visits and visits per headcount (Figures 2 and 3). Fitting
a model with a dummy variable set to 0 before that date and 1 afterwards, there
is an effect of -0.20 (p=0.07). Adding first order and seasonal autoregressive
terms reduces the effect to a nonsignificant -0.07 (p=0.68). Including the
other variables (graduate/undergraduate ratio, George Washington Carver visits
and weekdays) changes the effect to 0.04 (p=0.77).
Rolling Windows
Estimates of Visits per Headcount Adjusted Mean Change
For the period ending in 2012, the adjusted mean
change is -0.14, for the period ending in 2013, the adjusted mean change is
-0.10, and for 2014, -0.16 (Figure 7.)
The relative importance of the two independent
variables changes over time, with the graduate/undergraduate ratio becoming
more important and the Carver pages visits becoming less important, shown by
the regression R2. The regression R2 for the complete
model increases over time, from 42% in the period ending in 2012 to 59% in the
period ending in 2014 (Figure 8).
The left panel of Figure 8 shows the observed values and model fitted
for each window, while the right panel shows the estimates of the regression
coefficients. The bottom panel shows the regression R2 for the
rolling windows for the model containing both of the variables of interest and
for models containing one of the variables of interest. Regression R2
is the percent of innovation variance (variance not explained by past history).

Figure 6
Comparison of effect size, using adjusted
mean, AIC, and Regression R2: The first two rows show results from
baseline models (autoregressive terms only and autoregressive adjusted for
weekdays). The third row includes the graduate/undergraduate ratio, with a
regression R2 of 23%; the fourth row includes the Carver visits (but
not the ratio), with a regression R2 of 34%; the last row includes
both independent variables, with a regression R2 of 58%. In other
words, including both the graduate/undergraduate ratio and the Carver visits
explains 58% of the variance in website visits per headcount that is not
explained by past history of the series and a weekdays
adjustment.
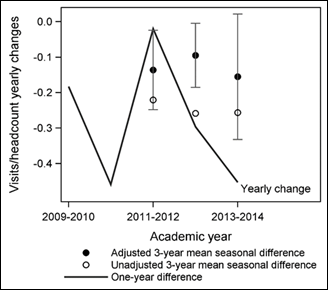
Figure 7
Seasonal differences of website visits per
headcount, compared to unadjusted 3-year rolling averages, and rolling averages
adjusted for graduate/undergraduate enrollment ratio and visits starting on
George Washington Carver pages.
Estimate of
Undergraduate and Graduate Student Marginal Effects on Library Website Visits
Freshmen enrollment and other undergraduate enrollment
follow different patterns (Figure 9). Freshmen have a lower enrollment during
the Spring, in contrast to the other undergraduates.
Graduate student enrollment (Figure 4) exhibit less seasonal change and less
trend than undergraduate enrollment, making it more difficult to estimate the
effect with precision. Faculty headcount is flat, so faculty effect can’t be estimated
separately.
Website visits from faculty, staff, and all others are
included in the estimate of 1556 visits attributed to each additional weekday.
Visits due to visits starting on the Carver pages were restricted to be 1. Each
library closed day had an effect of -2369 fewer visits, after accounting for
other factors.
An average of 5.4 visits per month is attributed to
each additional graduate student, after all other variables are taken into
account. Similarly, 2.0 visits per month are attributed to freshmen, and 2.5
visits per month are attributed to other undergraduates. The 95% confidence
intervals are quite large and overlapping (Figure 10).
This model had a lower AIC of 1520 compared to 1553
for a model containing an indicator variable for Fall
and Spring semesters instead of enrollment variables, indicating a better fit.
In the rolling windows analysis, the variation in the
marginal visits attributed to weekdays minus holidays varies widely, from 1015
in the first rolling window ending in August 2012, to 1723 and 1571 in the next
two. The decrease attributed to closed days ranges from -1836 in the first
period to -2444 in the third period.
While the point estimates for graduate students show
an increase from 3.8 to 5.4, the broad and nearly completely overlapping
confidence intervals make it difficult to say whether there was actually an
increase. The same is true for the increase for freshmen and the decrease for
other undergraduates, although the confidence intervals for the other
undergraduates are much narrower (Figure 11).
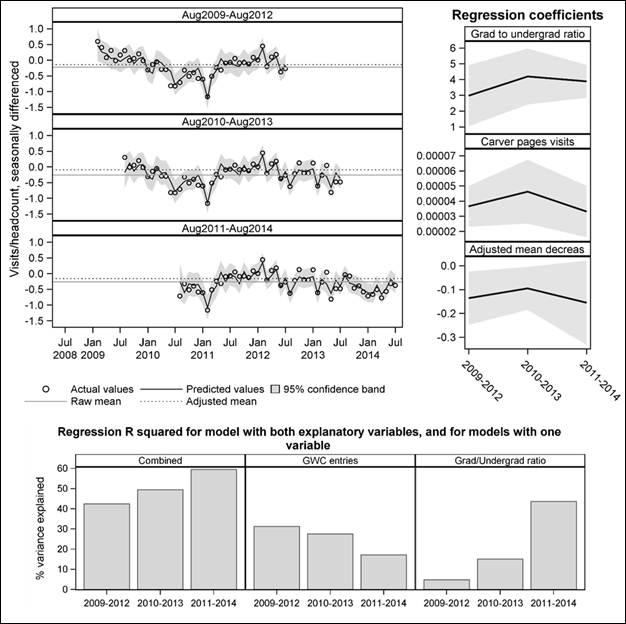
Figure 8
Rolling windows analysis using three years of seasonal
differences for each window.
The decline in library website usage over this study
period is small. Students and faculty may be using resources the library has
paid for but not accessing them through the library website. Perhaps fewer
individuals are using the library website but the individuals who are using it
are more intensive users, as seen in the OCLC study (De Rosa, et al., 2011).
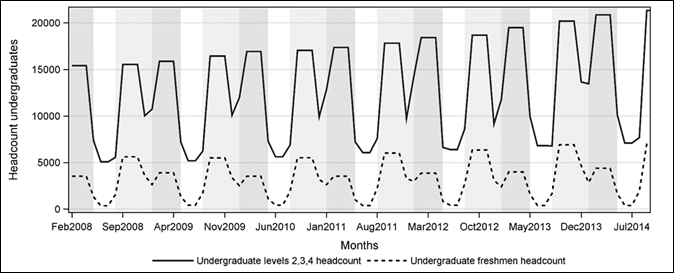
Figure 9
Undergraduate headcount enrollment, freshmen, and all
others.
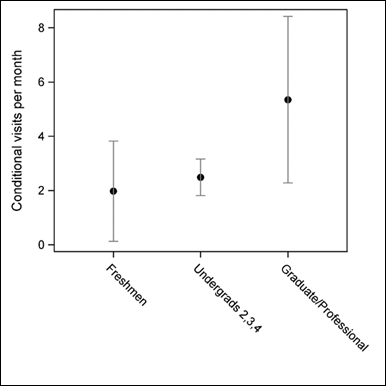
Figure 10
Coefficients of student group variables - estimates of
marginal effect of adding one student on number of website visits, for each
student group, with 95% confidence limits.
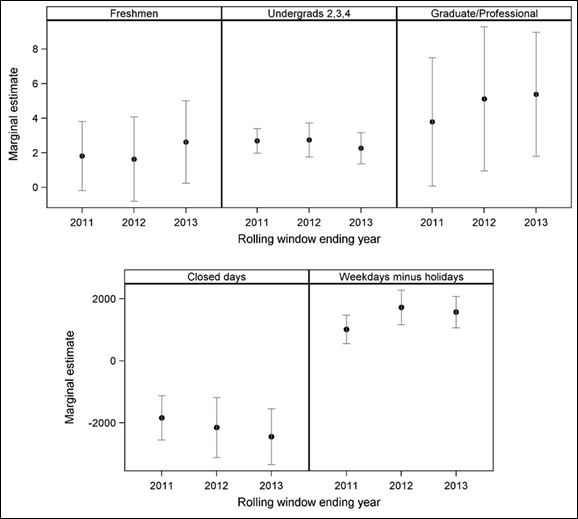
Figure 11
Rolling windows estimates of marginal effects of
adding one student from each student group on number of website visits (top
row) and marginal effects of each additional closed day during Thanksgiving and
winter breaks, and each additional weekday that is not a holiday per month,
with 95% confidence bars.
There is some support for the idea that fewer
individuals are using the library website but they are more intensive users.
The number of unique visitors per headcount decreased, but the number of visits
per unique visitor (as defined by IP address) increased until the 2011-2012
academic year, then plateaued. At the beginning of the period, unique visitors
per headcount is 1.5 or greater, perhaps partly attributable to non-affiliate
use for George Washington Carver pages. In the last two years of the study
period, it stays mostly between 1.0 and 1.5, with a dip below 1.0 during Fall 2013 (Figure 12).
There are caveats with visits and unique visitor statistics – IP address
is used to define website visits and visitors but there isn’t a one-to-one
relationship between IP addresses and individuals. There are also people who
are not included in the headcount who may use the library website. Some of
these individuals may not be affiliated with the university.

Figure 12
The number of unique visitors per total headcount is
decreasing but the number of library website visits per unique visitor has
increased.
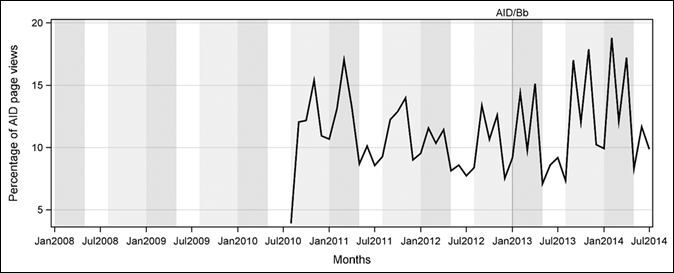
Figure 13
Page views of the Articles Indexes & Databases
main page as a percentage of visits. AID/Bb reference links marks
implementation date of a redesigned Articles Indexes & Databases page and
of Blackboard MyLibrary tab.
Further Analysis
Although a redesign in 2010 did not result in any
change in visitors per headcount, an emphasis on the Ask Us! feature
did result in an increase in the chat and email service usage. In the 2014
redesign, a new link to Interlibrary Loan and Document Delivery (ILL/DD) was
placed on the home page. ILL/DD data could be analyzed for an effect on number
of ILL/DD requests and number of patrons who used the service.
Intensive library website visitors may make more use
of certain features of the website, such as the Article Indexes and Databases
page, which shows an increase in page views as a percentage of visits to the
library website in the last two years (Figure 13). Page view statistics for
Article Indexes & Databases pages could be analyzed in conjunction with
both database and journal usage data and website design changes. Two events
happened in January 2013: a change in the design of the Article Indexes &
Databases page, and the implementation of a “My Library” tab with a link to
this page in the campus Blackboard course management system. The recent trend
upwards, if it is not a short-lived fluctuation, could be due to either or both
of these changes, and/or perhaps to recent visitors being more intensive users
of the website.
Even though there is a general decline in interest in
George Washington Carver, improved search engine optimization for this and
other digital collections could continue to bring both affiliated and unaffiliated
people to the website.
Effect on Number of Website Visits by Student Groups:
Graduate and Professional Students, Freshmen, and
Other Undergraduates
The effect of adding autoregressive terms to the
model, rather than using an ordinary regression, was quite marked. A model with
all of the variables except the autoregressive terms resulted in parameter
estimates of 12.8 for graduate and professional students, 0.9 for
undergraduates (class 2, 3, and 4) and 2.6 for freshmen, illustrating the need
to remove correlation from regression residuals. Using regression with ARMA
errors allows making inferences about demographic groups, even without having
data that is directly tied to demographics.
These analyses assume that students, both graduate and
undergraduate, visit the library website. There is self-reported evidence of
that but no direct evidence. There are clearly more website visits during the Fall and Spring semesters when there are also many more
students, but behaviour by other possible visitors,
including faculty and staff, and teachers and students from the public schools,
could change then as well. Models including enrollment variables fit slightly
better than models including a Fall/Spring semester indicator variable instead
of the enrollment variables.
Conclusion
Trend in Library Website Visits
Time series analysis (regression with ARMA errors) was
conducted to evaluate trend in library website visits, while accounting for
factors such as increased enrollment, decreasing graduate to undergraduate
enrollment ratios, and decreasing visits to a popular George Washington Carver
digital collection.
The sample mean change in monthly visits per headcount
over the study period (February 2008 to August 2014) is -0.23. The mean change
adjusted for graduate to undergraduate ratio and George Washington Carver
visits is -0.14. Together these two factors explain 58% of the variance of the
seasonal differences in visits per headcount that is not explained by past
history of a time series. Rolling windows analysis shows the effect of the
undergraduate/graduate ratio increasing over time, while the effect of the
George Washington Carver visits decreases.
A decrease in visits per headcount coinciding with a
design change in 2010 was found to be nonsignificant after including
autoregressive terms. The decrease also coincided with a drop in George
Washington Carver pages visits. According to Google Trends,
searches for George Washington Carver have been decreasing worldwide.
Comparison of Usage Estimates by Student Group from
Survey Data and from Web Log Data
Regression with ARMA errors was used to estimate
marginal effects on library website visits by three student groups. Each
additional freshman enrolled marginally increased the number of website visits
per month by 2, after taking into account George Washington Carver visits, the
number of other undergraduates, the number of graduate students, the number of
weekdays minus holidays per month, and library closed days at Thanksgiving and
winter break. Similarly, the regression analysis attributes 2.5 visits to each
additional level 2, 3, and 4 undergraduate, and 5.4 visits for each additional
graduate student. The confidence intervals for freshmen and graduate students
are quite wide. The point estimates for graduates’ and other undergraduates’
marginal usage match closely (within confidence intervals and within one visit)
with estimates taken from survey results in 2012. These estimates were made
without demographic data tied to individual records in the transaction logs.
Library websites are a gateway to library resources,
services, contact information, and events. Changes in the website may affect
awareness and usage of these resources and services. This analysis can be
extended to evaluate the impact of changes on usage and understand the effect
of background data such as enrollment changes and other events. The methods can
be applied to any time series data libraries have, such as electronic resource
usage, attendance, or number of reference transactions.
Acknowledgements
Many thanks to Karen Lawson
and Kristine Stacy-Bates for reading earlier versions of the manuscript and
contributing greatly to its improvement.
References
Ahiakwo, O. N. (1988). Forecasting techniques and library circulation operations:
Implications for management. Library and Information Science Research, 10(2),
195-210.
Allen, L.,
Baker, N., Wilson, J., Creamer, K., & Consiglio,
D. (2013). Analyzing the MISO data: Broader perspectives on library and
computing trends. Evidence Based Library and Information Practice, 8(2),
129-138. Retrieved from https://ejournals.library.ualberta.ca/index.php/EBLIP
Asunka, S., Chae, H. S., Hughes, B., & Natriello, G. (2009). Understanding academic information
seeking habits through analysis of web server log files: The case of the
teachers college library website. The Journal of Academic Librarianship, 35(1),
33-45. http://dx.doi.org/10.1016/j.acalib.2008.10.019
Box, G. E.
P., Jenkins, G. M., & Reinsel, G. C. (2008). Time
series analysis: Forecasting and control (4th ed.).
Hoboken, NJ: John Wiley & Sons.
Brooks, T.
A. (1984a). Naive vs. sophisticated methods of forecasting public library
circulations. Library & Information Science Research, 6(2),
205-214.
Brooks, T.
A. (1984b). Using time-series regression to predict academic library
circulations. College & Research Libraries, 45(6),
501-505.
Cochrane,
L. S. (2007). If the academic library ceased to exist, would we have to invent
it? EDUCAUSE Review, 42(1), 6-7. Retrieved from
http://er.educause.edu/~/media/files/article-downloads/erm0714.pdf
Cohen, L.
B. (2003). A two-tiered model for analyzing library website usage statistics,
part 1: Web server logs. portal:
Libraries and the Academy, 3(2), 315-326. http://dx.doi.org/10.1353/pla.2003.0028
Connaway, L. S., Dickey, T. J., & Radford, M. L. (2011). “If it is too
inconvenient I'm not going after it”: Convenience as a critical factor in
information-seeking behaviors. Library & Information Science
Research, 33(3), 179-190. http://dx.doi.org/doi:10.1016/j.lisr.2010.12.002
De Rosa, C., Cantrell, J., Carlson, M., Gallagher, P., Hawk, J., Sturtz, C. (2011).
Perceptions of libraries, 2010:
Context and community. Retrieved
from OCLC website: http://www.oclc.org/reports/2010perceptions.en.html
Education
Advisory Board. (2011). Redefining the
academic library: Managing the migration to digital information services.
Retrieved from https://www.eab.com/research-and-insights/academic-affairs-forum/studies/2011/redefining-the-academic-library
Goddard,
L. (2007). Getting to the source: A survey of quantitative data sources
available to the everyday librarian: Part I: Web server log analysis. Evidence
Based Library and Information Practice, 2(1), 48-67. Retrieved from https://ejournals.library.ualberta.ca/index.php/EBLIP
Google.
(2014). Google trends: George Washington
Carver. Retrieved from http://www.google.com/trends/explore#q=George%20Washington%20Carver
Granger,
C. W. J., & Newbold, P. (1977). Forecasting economic time series.
New York: Academic Press.
Hyndman,
R. J., & Athanasopoulos, G. (2014). Forecasting: Principles and practice. Heathmont, Vic: OTexts. Retrieved
from https://www.otexts.org/fpp
Jansen,
B. J. (2006). Search log analysis: What it is, what's been done, how to do
it. Library & Information Science Research, 28(3),
407-432. http://dx.doi.org/doi:10.1016/j.lisr.2006.06.005
Ke, H. R., Kwakkelaar, R., Tai, Y. M., &
Chen, L. C. (2002). Exploring behavior of E-journal users in science and
technology: Transaction log analysis of Elsevier's ScienceDirect
OnSite in Taiwan. Library & Information
Science Research, 24(3), 265-291. http://dx.doi.org/doi:10.1016/S0740-8188(02)00126-3
Liu, S.
(2008). Engaging users: The future of academic library web sites. College
& Research Libraries, 69(1), 6-27. http://dx.doi.org/10.5860/crl.69.1.6
Marek, K.
(2011). Using web analytics in the library:
A library technology report. Chicago, IL: American Library
Association.
Nackerud, S., Fransen, J., Peterson, K., & Mastel, K. (2013). Analyzing demographics: Assessing
library use across the institution. portal:
Libraries and the Academy, 13(2), 131-145. http://dx.doi.org/DOI:10.1353/pla.2013.0017
Naylor, M.,
& Walsh, K. (1994). A time-series model for academic library data using
intervention analysis. Library & Information Science Research, 16(4),
299-314. http://dx.doi.org/doi:10.1016/0740-8188(94)90054-X
Pankratz, A. (1991). Forecasting with
dynamic regression models. New
York: Wiley.
Park, M.,
& Lee, T. S. (2013). Understanding science and technology information users
through transaction log analysis. Library Hi Tech, 31(1),
123-140. http://dx.doi.org/10.1108/07378831311303976
Pierce, D.
A. (1979). R 2 measures for time series. Journal of the American Statistical
Association, 74(368), 901-910.
Tenopir, C. (2013). Building evidence of the value and impact of library and
information services: methods, metrics and ROI. Evidence Based Library
and Information Practice, 8(2), 270-274. Retrieved from https://ejournals.library.ualberta.ca/index.php/EBLIP
Vigen, T. Spurious correlations.
Retrieved 19 Feb 2015 from http://www.tylervigen.com/spurious-correlations
Wood, P.
A., & Walther, J. H. (2000). The future of academic libraries: Changing
formats and changing delivery. The Bottom Line, 13(4),
173-182. http://dx.doi.org/10.1108/08880450010355904
Zivot, E., & Wang, J. (2007). Modeling financial time series with
S-PLUS® (2nd ed.). New York: Springer.