Conference Paper
Coding Practices for LibQUAL+® Open-Ended
Comments
Karen Neurohr
Assessment Librarian
Oklahoma State University
Stillwater, Oklahoma,
United States of America
Email: karen.neurohr@okstate.edu
Eric Ackermann
Head, Reference Services and Library Assessment
Radford University
Radford, Virginia, United States of America
Email: egackerma@radford.edu
Daniel P. O'Mahony
Director of Library Planning and Assessment
Brown University Library
Providence, Rhode Island, United States of America
Email: dpo@brown.edu
Lynda S. White
Associate Director of Library Assessment
University of Virginia Library
Charlottesville, Virginia, United States of America
Email: lsw6y@virginia.edu
 2013 Neurohr, Ackermann, O’Mahony,
and White.
This is an Open Access article distributed under the terms of the Creative
Commons‐Attribution‐Noncommercial‐Share Alike License 2.5 Canada (http://creativecommons.org/licenses/by-nc-sa/2.5/ca/),
which permits unrestricted use, distribution, and reproduction in any medium,
provided the original work is properly attributed, not used for commercial
purposes, and, if transformed, the resulting work is redistributed under the
same or similar license to this one.
2013 Neurohr, Ackermann, O’Mahony,
and White.
This is an Open Access article distributed under the terms of the Creative
Commons‐Attribution‐Noncommercial‐Share Alike License 2.5 Canada (http://creativecommons.org/licenses/by-nc-sa/2.5/ca/),
which permits unrestricted use, distribution, and reproduction in any medium,
provided the original work is properly attributed, not used for commercial
purposes, and, if transformed, the resulting work is redistributed under the
same or similar license to this one.
Abstract
Objective – This paper presents the results of a study of
libraries’ practices for coding open-ended comments collected through LibQUAL+® surveys and suggests practical steps for
facilitating this qualitative analysis.
Methods
– In the fall of 2009, survey invitations were sent
to contacts at 641 institutions that had participated in the LibQUAL+® survey from 2003 to 2009. Of those invited, there
were 154 respondents, for an overall response rate of 24.0%.
Results
– Nearly 87% of the respondents indicated that their
library had performed a qualitative analysis of the comments from their most
recent LibQUAL+® survey. Of these, over 65% used
computer software to organize, code, sort, or analyze their comments, while
33.6% hand-coded their comments on paper. Of the 76 respondents who provided
information on software, 73.7% used Excel, 18.4% used Atlas.ti,
and 7.9% used NVivo. Most institutions (55.8%) had
only 1 person coding the comments; 26.9% had 2 coders, and very few had 3 or
more. Of those who performed some type of analysis on their comments, nearly
all (91.9%) indicated that they developed keywords and topics from reading
through the comments (emergent keywords). Another common approach was to code
the comments according to the LibQUAL+® dimensions;
55.0% of respondents used this strategy. Nearly all of the institutions (92.7%)
reported using their LibQUAL+® comments internally to
improve library operations. Libraries also typically incorporated the comments
into local university reports (75.5%) and used the comments in outreach
communications to the university community (60.9%).
Conclusion
–
Comments obtained from the LibQUAL+® survey can be
useful for strategic planning, understanding users, identifying areas for
improvement, and prioritizing needs. A key suggestion raised by respondents to
this survey was for practitioners to consider sharing the fruits of their labor
more widely, including coding taxonomies and strategies, as well as broader
discussion of qualitative analysis methods and practices.
Introduction
Since its launch in 2000, LibQUAL+®
has become the most prevalent library assessment instrument for measuring
service quality.
LibQUAL+® has been used to
collect service quality assessment perceptions from 1,294,674 participants at
1,164 institutions around the world. LibQUAL+® has
been implemented in 28 language variations: Afrikaans, Chinese, Danish, Dutch,
English (American, British, Dutch, Finnish, France, Norwegian, Swedish, Swiss),
Finnish, French (British English-BE, Belge, Canada,
France, Swiss), German (and German Swiss), Greek, Hebrew, Japanese, Norwegian,
Spanish, Swedish (and Swedish BE), and Welsh (Kyrillidou,
Thompson, & Cook, 2011, p. 3).
A
key component of the LibQUAL+® survey data is the
file of respondents’ free-text comments that accompanies the quantitative data
– almost 40% of LibQUAL+® respondents
typically include narrative comments (Green & Kyrillidou,
2010, p. 26).
“[T]he open-ended comments gathered as part of LibQUAL+®
are themselves useful in fleshing out insights into
perceived library service quality. Respondents often use the
comments box on the survey to make constructive suggestions on specific ways to
address their concerns” (Cook et al., 2008, p. 14).
Thus,
systematic analysis of a library’s qualitative data from LibQUAL+®
can be extremely valuable in assessing the library’s performance and
identifying areas for improvement.
To
better understand libraries’ current practices in analyzing and using LibQUAL+® comments, the authors conducted a survey of all
U.S. and Canadian libraries that administered at least one LibQUAL+®
survey from 2003 through June 2009. Survey questions asked respondents to
describe what they did with the open-ended comments received from their LibQUAL+® survey and probed aspects including coding
methods, local resources for coding, and the use of comments for various
purposes. This paper presents the survey findings as well as suggestions for
practical steps to help facilitate qualitative analysis of LibQUAL+®
comments. The questionnaire can be found at http://www.library.okstate.edu/dean/neurohr/CodingSurvey10-26-09.pdf.
Literature Review/Bibliography
A search of the published, peer-reviewed
library literature found 12 articles and conference papers produced by 11
academic libraries: Bowling Green State University (Haricombe
& Boettcher, 2004); Northeastern University (Habich,
2009); Notre Dame (Jones & Kayongo, 2009); Texas
A&M (Guidry, 2002; Clark, 2007); University of Arizona (Begay,
Lee, Martin, & Ray, 2004); University of British Columbia (Friesen, 2009);
University of Idaho (Jankowska, Hertel,
& Young, 2006); University of
Massachusetts-Amherst (Fretwell, 2009); University of
Pittsburgh (Knapp, 2004); Vanderbilt University (Wilson, 2004); Western
Michigan University (Dennis & Bower, 2008). These articles covered LibQUAL+® surveys administered during the
period from 2001 to 2007 and for the most part described the methodologies,
experiences, and findings of individual libraries that performed some type of
systematic analysis of their survey’s comments.
All 1 institutions represented in the
literature review were doctorate-granting universities. Seven of these 11
libraries were members of ARL (Begay et al., 2004;
Guidry, 2002; Clark, 2007; Jones & Kayongo, 2009;
Fretwell, 2009; Friesen, 2009; Knapp, 2004; Wilson,
2004). Ten of the 11 institutions are located in the United States: 3 in the
Northeast, 3 in the South, 2 in the Midwest, and 2 in the West, while the
eleventh institution is located in Canada.
The amount of detail reported in the
literature review by libraries about the management of their coding projects
was relatively sparse and inconsistent. Only 3 of the 11 libraries represented
in the literature review reported any project structure, all of which were ad
hoc or informal (Begay et al., 2004; Habich, 2009; Jankowska et al.,
2006). Three of the libraries reported the number of coders they used: one
reported using one coder (Habich, 2009), and two
reported using two coders (Dennis & Bower, 2008; Jones & Kayongo, 2009). Two non-librarians were involved in the
coding (Dennis & Bower, 2008; Guidry, 2002). Only one of the libraries
reported providing formal training for their coders by way of a consultant (Begay et al., 2004) while another
library’s coder was self-taught (Habich, 2009). The
remaining nine libraries did not provide any information on coder training.
All 11 of these libraries reported performing
qualitative analysis on either all or a representative sample of the comments
they received from the LibQUAL+® surveys they
conducted, which was part of the criteria for selecting these 11 articles. The
average number of comments received by these 11 libraries was 1,031. Seven of
the 12 authors reported using computer software to help in the analysis (Begay et al., Dennis & Bower, 2008; Friesen, 2009;
Guidry, 2002; Habich, 2009; Haricombe
& Boettcher, 2004; Jones & Kayongo, 2009)
while 5 did not report what coding method (by computer or by hand) they used
(Clark, 2007; Fretwell, 2009; Jankowska
et al., 2006; Knapp, 2004; Wilson, 2004). Of the seven libraries that reported
using software, three used ATLAS.ti (Dennis &
Bower, 2008; Friesen, 2009; Guidry, 2002), two used Excel (Habich,
2009; Jones & Kayongo, 2009), one used NUD*IST – now
called NVivo – (Begay et
al., 2004), and one used Access (Haricombe &
Boettcher, 2004).
The 11 libraries covered in the literature
review varied in the way they developed a coding system for use in the analysis
of their LibQUAL+® comment data. Five of the 11
reported basing their codes on the 3 LibQUAL+®
dimensions Affect of Service, Information Control,
and Library as Place (Friesen, 2009; Habich, 2009; Jankowska et al., 2006; Jones & Kayongo,
2009; Wilson, 2004). Three of the 11 libraries also based their
coding on the individual LibQUAL+® and/or local
questions (Friesen, 2009; Habich, 2009; Jones & Kayongo, 2009). Three of the libraries reported
using a predetermined set of concepts or keywords (Begay
et al., 2004; Haricombe & Boettcher, 2004; Jones &
Kayongo, 2009), while nine reported using keywords
and concepts developed from the content of the comments (Begay
et al., 2004; Clark, 2007; Dennis & Bower, 2008; Fretwell,
2009; Friesen, 2009; Guidry, 2002; Habich, 2009; Haricombe & Boettcher, 2004; Jankowska
et al., 2006). Nine of the 11 libraries reported coding the distinct
topics found within each comment in lieu of using 1 code for the entire comment
(Begay et al., 2004; Dennis & Bower, 2008; Fretwell, 2009; Friesen, 2009; Guidry, 2002; Habich, 2009; Haricombe &
Boettcher, 2004; Jones & Kayongo, 2009; Wilson,
2004). Seven of the libraries also coded a comment “positive” or
“negative” if it expressed such an experience with an aspect of the library (Begay et al., 2004; Dennis & Bower, 2008; Fretwell, 2009; Friesen, 2009; Guidry, 2002; Habich, 2009; Wilson, 2004). Note that the use of each of
the elements discussed above was not exclusive. Each of these libraries
reported using a different combination in developing their coding system. Only
one did not include any report of the elements it used to create its coding
schema (Knapp, 2004).
Only 2 of the 11 libraries reported any
detailed information about the steps they took to encourage or enforce coding
consistency and reduce coding subjectivity during their projects. Both reported
that their coders worked using an understanding gained through prior discussion
of how to apply the codes (Begay et al., 2004; Jones
& Kayongo, 2009), but only one had their coders
work independently on randomly assigned sets of comments (Begay
et al., 2004). None of these libraries reported documenting their coding
procedures.
All 11 of the libraries also reported using
the results to communicate with other professionals in the field (Begay et al., 2004; Clark, 2007; Dennis & Bower, 2008; Fretwell, 2009; Friesen, 2009; Guidry, 2002; Habich, 2009; Haricombe &
Boettcher, 2004; Jankowska et al., 2006; Jones & Kayongo, 2009; Knapp, 2004; Wilson, 2004). Few of the 11
libraries reported any further plans to use the results of their qualitative
analysis. One library reported plans to incorporate some of their findings into
their annual reports and other intra-university administrative reports (Dennis
& Bower, 2008). Only three planned to include the findings in outreach
communications to their university (Dennis & Bower, 2008; Habich, 2009; Haricombe &
Boettcher, 2004) or to external groups (e.g., donors or potential donors; Habich, 2009).
The libraries represented in the literature
review reported several benefits from analyzing their comment data. Two of the
libraries gained a better understanding of library users’ needs and priorities
(Jones & Kayongo, 2009; Fretwell,
2009). One found a new source of ideas for new services (Begay,
2004). Three libraries found a new source for improving existing services
(Clark, 2007; Friesen, 2009; Wilson, 2004). One found a new source for
maximizing the impact of limited resources (Habich,
2009). Three of the 11 libraries reported that they had developed a new tool
for analyzing other data sets (Begay et al., 2004;
Dennis & Bower, 2008; Jankowska et al., 2006).
Two discovered that the findings from analyzing the LibQUAL+®
comment data complemented and enhanced the findings from the quantitative data
(Dennis & Bower, 2008; Jones & Kayongo,
2009).
Only one of these libraries indicated the
nature of the biggest challenge they encountered during the project, which was
devising a method for comment analysis that did not require learning a new
software program (Habich, 2009). None of the
libraries represented reported on what support from their institutions,
vendors, or others they wished they had during the project. Only one mentioned
a resource they found helpful: the survey research expertise available in their
university’s Office of Institutional Research (Habich,
2009).
Methodology
LibQUAL+®
quantitative measures have been thoroughly investigated and validated, but what
about the qualitative data? Each survey includes an open-ended statement:
“Please enter any comments about library services in the box below.” How do
libraries analyze and use the data received in response to this statement?
In
the fall of 2008, a small working group began to study this question. The study
was initially informed by feedback obtained by one of the authors new to LibQUAL+® who queried the LibQUAL-L discussion list in February 2008 by asking, “Can anyone share
information about how they coded the open-ended comments from the LibQUAL+® survey?” The wide variety in the
responses received led to the ad hoc formation of a luncheon affinity group to
discuss coding at the 2008 Library Assessment Conference in Seattle. Over 15
librarians participated in the affinity group and there was much interest in
coding methodologies and practices. Next, the authors met to discuss ways to
explore coding, drafted a survey and planned for the survey’s distribution.
In September 2009, the survey questionnaire
was piloted to a small group of 30 colleagues who
had responded to the listserv query or participated in the affinity group. They
assisted the authors in clarifying the wording and structure of the
questionnaire by answering these questions about the draft:
1.
How
long did it take to complete the survey? (The goal was 10 minutes or less.)
2.
Can
you answer the questions quickly/easily?
3.
Are the
questions clear? Which are not? Do you have suggestions for clarification?
4.
Are
the questions generic enough to cover most possible situations at your
institution or others you are familiar with?
5.
Other
comments.
The Association of Research Libraries (ARL)
provided generous assistance by emailing survey
invitations to all of the contacts at North American institutions that
participated in the LibQUAL+® survey from 2003
through spring 2009. There were 641 institutions: 110 ARL members (84 from the
United States and 16 from Canada) and 531 non-members (515 in the United States
and 28 in Canada). The first invitation was sent on October 27, 2009, followed
by four reminders at one-week intervals. Of those invited, there were 154
respondents for an overall response rate of 24.0%.
Survey Results
The survey asked what kind of institution the
respondent was affiliated with by using the Carnegie classifications for higher
education. Of the 151 responses to this question, 9.3% were from baccalaureate
colleges, 36.4% from master’s colleges and universities, and 54.3% were from
doctorate-granting universities (see Figure 1). There were no responses from
other types of institutions.
ARL members comprised 35.1% of the respondents to the survey (Figure 2).
ARL members were over-represented in the response, since only 17.2% of the 641
libraries in the sample were ARL members.
A large majority of the 154 respondents
(85.1%) were from the United States with the remaining libraries from Canada
(Figure 3). Nonetheless, Canadian libraries were over-represented in the
response, at 14.9%; only 9.4% of the 641 libraries in the sample were Canadian.
A little more than 33% of the U.S. respondents
were from the Northeast section of the country, closely followed by the South
and Midwest. Only 11.5% were from the Western states (Figure 4). For 60.2% of
respondents, administration of the LibQUAL+® survey
was handled by a formal or standing group within the library. or by someone whose position included survey administration.
Thus, among these respondents, there appeared to be some permanent
responsibility in their library for assessment (Figure 5). Nearly 40%
implemented LibQUAL+® through an informal or ad hoc
team or project group.

Figure 1
What is your
institution type?
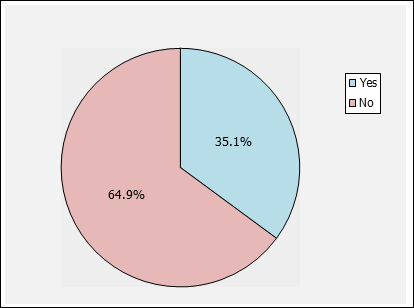
Figure 2
Does your library belong to the Association of
Research Libraries (ARL)?

Figure 3
Country

Figure 4
Sections of the United States
Nearly 87% of the respondents indicated that
their library had performed a qualitative analysis of the comments from their
most recent LibQUAL+® survey (Figure 6), where
“qualitative analysis” was described as any process that organized or
categorized or tagged/coded the free-text comments so that they might be used
by library staff or others in assessing and/or improving library services. Of those
who did not perform analysis on their survey comments, the most frequently
mentioned reason was lack of staff time. The average number of LibQUAL+® comments received by responding libraries was
379. The median was 293 but the number of comments ranged from one to 1,420.
The survey asked those who had performed a
qualitative analysis of their comments about the tools and methods they used in
their approach. Of the 114 responding libraries that provided answers, over 65%
used some sort of computer software to organize, code, sort, or analyze their comments,
while 33.6% hand coded their comments on paper (Figure 7).
The survey revealed that coders primarily used
Excel to analyze the comments: of the 76 respondents that provided information
on software, 73.7% used Excel (Figure 8). ATLAS.ti
was the most common qualitative data analysis software used (18.4% for ATLAS.ti versus 7.9% for NVivo).
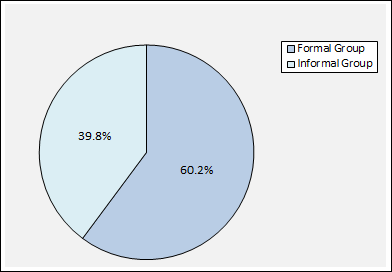
Figure 5
LibQUAL+® administrators
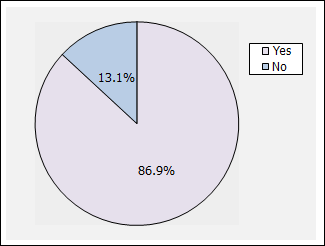
Figure 6
Did you perform
qualitative analysis of the open-ended comments?
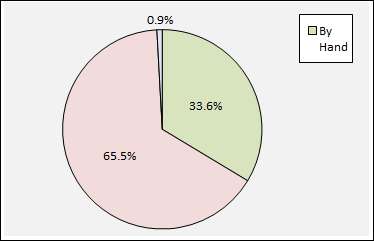
Figure 7
Coding methods
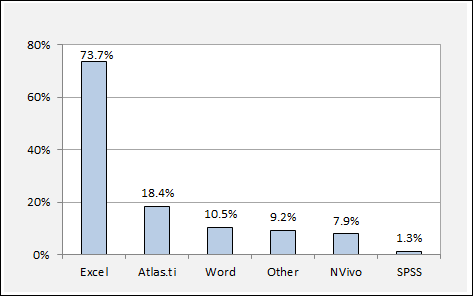
Figure 8
Software used (respondents could choose more
than one option)
Most respondents (58 out of 104 libraries, or
55.8%) had only 1 person coding the comments (Figure 9). Twenty-eight (26.9%)
had 2 coders, but
very few had 3 or more. Thus, at over 80% of the
responding libraries, either 1 or 2 people performed the coding. Only 18
libraries (17.3%) had 3 or more people who did coding.
Staff who performed the coding at respondents’
libraries were typically professional librarians:
84.2% of respondents indicated that librarians were coders while 25.4% used
non-librarian staff (Figure 10).
Training for coders came from several venues,
primarily LibQUAL+® workshops run by ARL (69.6%), but
there was also a large contingent that was self-taught or who had taken formal
courses in assessment methods (Figure 11). “Other” tended to be consultants
from other areas of the local institution.
Respondents used a number of approaches to
code the comments (Table 1). Of those who performed some type of analysis on
their comments, nearly all (91.9%) indicated that they developed keywords and
topics from reading through the comments (emergent keywords). Another common
approach was to code the comments according to LibQUAL+®
dimensions (55.0% of respondents used this strategy). Less common was coding
according to the 22 individual LibQUAL+® questions
(done by only 27.0%). A couple of respondents specifically mentioned that
creating a word cloud to visually display the key concepts that emerged from
their LibQUAL+® comments was an effective tool,
especially in communicating their findings to others.
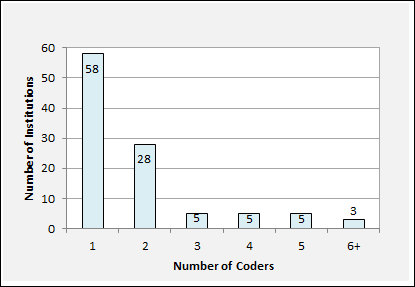
Figure 9
Number of institutions with n coders
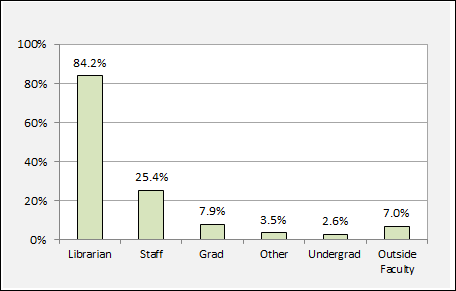
Figure 10
Coder status (respondents could choose more
than one option)

Figure 11
Training activities (respondents could choose
more than one option)
Table 1
Basis For Coding the
Comments
|
Basis
for Coding the Comments:*
|
%
|
N
|
|
Emergent keywords or concepts (e.g.,
“service hours”) developed from reading the comments?
|
91.9%
|
102
|
|
Whether or not it expressed a “positive” or
“negative” perspective/experience of the library?
|
67.6%
|
75
|
|
The LibQUAL+® dimensions: Affect of Service, Information Control, & Library as
Place?
|
55.0%
|
61
|
|
The number of distinct topic(s) in a single
respondent’s comment?
|
46.8%
|
52
|
|
A pre-set list of keywords or concepts
(e.g., “service hours”)?
|
41.4%
|
46
|
|
The 22 individual LibQUAL+®
questions and/or the 5 local questions?
|
27.0%
|
30
|
|
Other
|
10.8%
|
12
|
In order to enhance consistency and
objectivity, a number of steps were often implemented, including training,
using previous coding schemes, and having others check the work of a single
coder (33% of “other”). See Table 2.
Roughly half (51.4%) of those responding to
the survey did not document the process they used to code/analyze their LibQUAL+® comments (Table 3). The most common documentation
produced was lists of tags/codes with definitions and descriptions of the procedure
or methodology used.
Nearly all (92.7%) of the responding libraries
reported using their LibQUAL+® comments internally to
improve library operations (Table 4). Libraries also typically incorporated the
comments into local university reports (75.5%) and used the comments in
outreach communications to the university community (60.9%). Notably, roughly
half (46.4%) of respondents said they either did or planned to include their LibQUAL+® comments in communications with professional
communities (e.g., in conference presentations or professional publications).
Benefits
The survey asked, “For your library, what was
the best benefit of coding the comments?” The two most frequently mentioned
benefits were (1) that the comments helped to identify action items for improvement,
and (2) that the comments helped the library better understand its users
(Figure 12). Other benefits included providing results and examples that can be
communicated to various library constituents such as the provost or potential
donors, identifying and analyzing specific needs and issues raised by users,
identifying trends and patterns, and corroborating the quantitative survey
data.
Table 2
Consistency in Coding
|
Consistency in coding was assured by:*
|
%
|
N
|
|
Training and/or discussion was conducted
ahead of time for all participants to ensure a common understanding of the
application of the codes/tags
|
44.6%
|
37
|
|
Coding schemes and definitions from previous
survey administrations were consulted
|
44.6%
|
37
|
|
Other (please specify)
|
43.4%
|
36
|
|
Each comment was coded independently by at
least two people
|
27.7%
|
23
|
|
Comments were randomly assigned to people
doing the coding
|
12.0%
|
10
|
*Respondents could choose more than one
option.
Table 3
Documentation Type
|
Documentation Type*
|
%
|
N
|
|
None; did not document the process
|
51.4%
|
55
|
|
Code book (list of tags/codes, definitions,
examples, etc)
|
27.1%
|
29
|
|
Description of procedure and methodology
|
25.2%
|
27
|
|
Other (please specify)
|
17.8%
|
19
|
*Respondents could choose more than one option.
Table 4
Uses of Comment Data
|
Uses of Comment Data*
|
Yes
|
No
|
Plan to do
|
|
Internally within the library for
operational improvements
|
92.7%
|
0.9%
|
6.4%
|
|
Incorporated into administrative reports to
the university community (e.g., in annual report, budget request, etc.)
|
75.5%
|
7.3%
|
16.4%
|
|
Included in outreach communications to the
university community (e.g., in announcements for new services)
|
60.9%
|
18.2%
|
17.3%
|
|
Included in communication with professional
community (e.g., in conference presentations or professional publication)
|
25.5%
|
43.6%
|
20.9%
|
|
Included in outreach communications to
external audiences such as donors or potential donors (e.g., demonstrate
satisfaction with funded gifts or express need for funds, etc.)
|
22.7%
|
38.2%
|
27.3%
|
|
Other
|
3.6%
|
20.9%
|
0.9%
|
*Respondents could choose more than one
option.
Challenges
When it came to the biggest challenges of
coding the comments, time constraints were mentioned most frequently (Figure
13). Time here referred not only to the duration of coding itself, but also
included the time it took to learn new software, and the time to manage
multiple coders. Closely related to lack of time was the expressed challenge of
lack of people/staff to perform the coding and analysis. Another
resource-related challenge was the lack of appropriate software.
Respondents also described a number of
challenges related to the process of performing the actual coding and analysis,
including developing categories/groupings for coding schemes. Other less
frequently mentioned challenges included dealing with multiple concepts,
maintaining consistency throughout the coding process, the difficulty in
maintaining objectivity, and the need for assistance in analyzing and
interpreting the data. Some respondents also commented on the sheer volume of
the qualitative data (the average number of comments per responding library was
379, with each comment likely to contain numerous concepts to be coded
separately).
Support Needed
The survey asked, “What kind of support (from
your library, institution, ARL, software vendor, etc.) would be most helpful to
you in doing qualitative analysis of LibQUAL+®
comments?” Software purchase and software training were cited most frequently (Figure 14).
Respondents also made a number of suggestions regarding sharing information,
experiences, and work products in conducting the coding of LibQUAL+®
comments, as well as sharing the results of the qualitative analysis. For
example:
·
“Perhaps
the sharing of the index terms that others have used”
·
“It
might be interesting for a group … to draft a thesaurus and research
commonalities and trends across universities."
·
“It
would be great to share comments or types of comments, for informal
benchmarking, similar to how we can compare our scores on items through the
notebooks."

Figure 12
Best benefits of coding

Figure 13
Biggest challenges
of coding
ARL was gratefully acknowledged for their many
workshops and training/sharing sessions on LibQUAL+®
generally, but there was also an expressed interest in online training/webinars
on coding. In addition, a desire for basic training in qualitative research
theory/methodologies was mentioned, as well as training for the actual coding
and analysis. More staff to help with coding was desired by several
respondents.
Recommended Resources
Finally, the survey asked the respondents to
recommend helpful resources for someone new at starting a coding project. The
resource mentioned most often was ARL with its myriad activities which include
publications, the Library Service Quality Academy, the Library Assessment Conference
and proceedings, the LibQUAL+® website and workshops,
and the Assessment listserv/blog (Table 5). Other resources mentioned included
experts on campus, software vendors’ workshops and websites, and formal
research courses. The works of two institutions were mentioned specifically:
the Brown University guide (http://old.libqual.org/documents/admin/BrownU_2005_LQ_qual_method.pdf) and articles from Notre Dame (see, for
example, Jones & Kayongo, 2009).
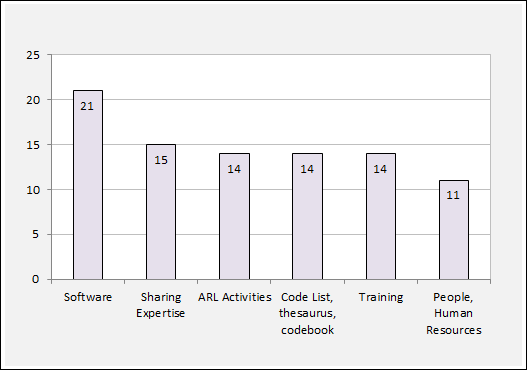
Figure 14
Most helpful support
for coding
Table 5
Recommended Resources
Recommended resources:
|
N
|
|
ARL Activities
|
20
|
|
None or Unsure
|
12
|
|
Online Resources
|
9
|
|
Software Manuals, Training,
Tutorials, Websites
|
7
|
|
Articles, Books
|
6
|
|
Suggestions
|
5
|
|
Formal and Informal Coursework
|
4
|
|
Institutional, Campus Resources
|
3
|
|
Manuals, guides
|
3
|
Several specific resources were listed by
survey respondents as helpful starting points for conducting qualitative
research:
Corbin, J. & Strauss, A. (2008). Basics of qualitative research. Los Angeles, CA: Sage. (Or
another book on grounded theory generation)
Richards, L. (2005). Handling qualitative data: A practical guide. London: Sage Publications.
LaPelle, N. (2004). Simplifying qualitative data analysis
using general purpose software tools. Field Methods, 16(1),
85-108.
Online QDA. (2012). School of Human
& Health Sciences, University of Huddersfield. Retrieved 30 May 2013
from http://onlineqda.hud.ac.uk/Introduction/index.php
Šauperl, A. (n.d.). Qualitative research methods in information
and library science: an annotated bibliography of sources, In University of Ljubljana, Faculty of Arts,
Department of Library and Information Science and Book Studies.. Retrieved
30 May 2013 from http://uisk.ff.cuni.cz/dwn/1003/1725cs_CZ_Qualitative%20Research%20Methods-Bibliography.rtf
Conclusion
Comments obtained from the LibQUAL+®
survey can be useful for strategic planning, understanding users, identifying
areas for improvement, and prioritizing needs. Clearly, the survey results
indicated a strong interest in systematically analyzing the open-ended comments
from the LibQUAL+® survey: nearly 87% of respondents
performed qualitative analysis on their most recent LibQUAL+®
comments, and of that group more than 65% utilized a computer software tool in
conducting that analysis. In more than half of the responding libraries, LibQUAL+® analysis was conducted by individuals or groups
with permanent responsibility for assessment. However, nearly 33% of
respondents indicated they had no training and were self-taught regarding
qualitative analysis.
Overall, respondents expressed a strong desire
for assistance in learning how to code and for knowing the best practices used
by other libraries. Far and away, Microsoft Excel was the tool of choice as
nearly 75% of respondents used it for some aspect of their analysis. There
appeared to be some confusion about the capabilities of text analysis software
packages, presumably by those who had not used such a tool (e.g., several
respondents commented on not using any software that “automatically” assigned
codes to the text).
A key suggestion raised by respondents to this
survey was for practitioners to consider sharing the fruits of their labor more
widely (including coding taxonomies and coding strategies) as well as broader
discussion of qualitative analysis methods, strategies, approaches, and
practices. To this end, it was encouraging that more than half of the survey
respondents indicated that they either already had or planned to include their LibQUAL+® comments in communications with professional
communities (e.g., in conference presentations or professional publications).
Such sharing of information, methods, and results should be welcomed given that
the literature review performed as part of this study revealed very few items
that focused on performing a systematic analysis of LibQUAL+®
comments.
Administering a LibQUAL+® survey typically results in a wealth of data, and
librarians want to know how best to use it. Performing qualitative analysis of
the open-ended comments is a typical practice with multiple benefits
accompanied by multiple challenges. A variety of tools and methods are utilized
by libraries.
Acknowledgement
The authors gratefully acknowledge
the input of the librarians who responded to the ARL LibQUAL-L
query, participated in the Library Assessment Conference Affinity Group, tested
and provided input for the pilot survey, and took the “LibQUAL+®
Comment Coding Survey.” Also, the authors thank ARL for their work and
cooperation in sending the survey invitations. We hope that this exploratory
study helps describe the current state of practice of qualitative analysis
among LibQUAL+® libraries and provides a basis from
which the emerging community of interest might grow.
References
Begay, W., Lee, D. R., Martin, J., & Ray, M.
(2004). Quantifying qualitative data: Using LibQUAL+® comments for library-wide planning
activities at the University of Arizona. Journal
of Library Administration, 40(3/4), 111-119. doi:10.1300/J111v40n03_09.
Clark, D. (2007). Practical assessment at
Texas A&M Libraries: Using LibQUAL+®
comments to enhance reference services. In F. DeFranco,
S. Hiller, L. J. Hinchliffe, K. Justh,
M. Kyrillidou, J. Self, & J. Stein (Eds.), Proceedings of the Library Assessment
Conference: Building effective, sustainable, practical assessment, (pp.
91-94). Washington, DC: Association of Research Libraries. Retrieved 30 May
2013 from http://libraryassessment.org/bm~doc/proceedings-lac-2006.pdf
Cook, C., Heath, F., Thompson, B., Davis, M., Kyrillidou, M., & Roebuck, G. (2008). LibQUAL+® 2008 survey
results notebook– ARL.
Washington, DC: Association of Research Libraries. Retrieved 30 May 2013 from http://www.libqual.org/documents/admin/ARL_Notebook_2008.pdf
Dennis, B. W., & Bower, T. (2008). Using content analysis
software to analyze survey comments. portal: Libraries and the Academy 8(4), 423-437. doi:10.1353/pla.0.0015
Fretwell, G. (2009). Examining the overlooked: Open-ended
comments from 6,108 invalid 2007 LibQUAL+® survey
responses. In S. Hiller, K. Justh, M. Kyrillidou, & J. Self (Eds.), Proceedings of the Library Assessment Conference:Building effective, sustainable, practical assessment
(pp. 443-448). Washington, DC: Association of Research Libraries. Retrieved
30 May 2013 http://libraryassessment.org/bm~doc/proceedings-lac-2008.pdf
Friesen, M. (2009). Applying ATLAS.ti
and Nesstar WebView to the LibQUAL+® results at UBC Library: Getting started. In S.
Hiller, K. Justh, M. Kyrillidou,
& J. Self (Eds.), Proceedings of the
Library Assessment Conference: Building effective, sustainable, practical
assessment (pp. 449-455). Washington, DC: Association of Research
Libraries. Retrieved 30 May 2013 from http://libraryassessment.org/bm~doc/proceedings-lac-2008.pdf
Green, D., & Kyrillidou,
M. (2010). LibQUAL+® procedures manual, including
the LibQUAL+® Lite
feature. Washington, DC: Association of Research Libraries.
Guidry, J. A. (2002). LibQUAL+®
spring 2001 comments: A qualitative analysis using ATLAS.ti.
Performance Measurement and Metrics 3(2),
100-107. doi:10.1108/14678040210429008
Habich, E. C. (2009). Analyzing LibQUAL+® comments
using Excel: An accessible tool for engaging discussion and action. In S. Hiller, K. Justh,
M. Kyrillidou, & J. Self (Eds.), Proceedings of the Library Assessment
Conference: Building effective, sustainable,practical assessment (pp. 417-423).Washington,
DC: Association of Research Libraries. Retrieved 30 May 2013 from
http://libraryassessment.org/bm~doc/proceedings-lac-2008.pdf
Haricombe, L. J., & Boettcher, B. J. (2004). Using LibQUAL+® data
in strategic planning: Bowling Green State University. Journal of Library Administration, 40(3/4), 181-195. doi:10.1300/J111v40n03_14.
Jankowska, M. A., Hertel, K.,
& Young, N. J. (2006).
Improving library service quality to graduate students: LibQUAL+® survey results in a
practical setting. portal: Libraries and the Academy, 6(1), 59-77. doi:10.1353/pla.2006.0005
Jones, S., & Kayongo,
J. (2009). Are they really
that different?: Identifying needs and priorities
across user groups and disciplines at the University of Notre Dame through LibQUAL+® user comments. In S. Hiller, K. Justh, M. Kyrillidou, & J.
Self (Eds.), Proceedings of the Library
Assessment Conference: Building effective, sustainable, practical assessment (pp.
425-441). Washington, DC: Association of
Research Libraries.
Retrieved 20 May 2013 from http://libraryassessment.org/bm~doc/proceedings-lac-2008.pdf
Knapp, A. E. (2004). We asked them what they thought, now what do we
do? The use of LibQUAL+®
data to redesign public services at the University of Pittsburgh. Journal of Library Administration, 40(3/4),
157-171. doi:10.1300/J111v40n03_12
Kyrillidou, M., Thompson, B., & Cook, C. (2011,
Aug.). Regrounding LibQUAL+® for the Digital Library Environment: an analysis
of the DigiQUAL Data. Paper presented at the 9th
Northumbria International Conference on Performance Measurement in Libraries
and Information Services, York, England.
Wilson, F. (2004). LibQUAL+® 2002
at Vanderbilt University: What do the results mean and where do we go from
here? Journal of Library Administration,
40(3/4), 197-240. doi:
10.1300/J111v40n03_15.