Conference Paper
Value
of Libraries: Relationships Between Provision, Usage, and Research Outcomes
Michael Jubb
Director
Research Information Network
London, England, United Kingdom
Email: michael.jubb@researchinfonet.org
Ian Rowlands
Research Services Manager and Bibliometrician
University of Leicester
Leicester, England, United Kingdom
Email: ir46@le.ac.uk
David Nicholas
Director
CIBER Research Ltd
Newbury, England, United Kingdom
Email: Dave.Nicholas@ciber-research.eu
![]() 2013 Jubb, Rowlands, and Nicholas. This is an
Open Access article distributed under the terms of the Creative Commons‐Attribution‐Noncommercial‐Share Alike License 2.5 Canada (http://creativecommons.org/licenses/by-nc-sa/2.5/ca/), which
permits unrestricted use, distribution, and reproduction in any medium,
provided the original work is properly attributed, not used for commercial
purposes, and, if transformed, the resulting work is redistributed under the
same or similar license to this one.
2013 Jubb, Rowlands, and Nicholas. This is an
Open Access article distributed under the terms of the Creative Commons‐Attribution‐Noncommercial‐Share Alike License 2.5 Canada (http://creativecommons.org/licenses/by-nc-sa/2.5/ca/), which
permits unrestricted use, distribution, and reproduction in any medium,
provided the original work is properly attributed, not used for commercial
purposes, and, if transformed, the resulting work is redistributed under the
same or similar license to this one.
Abstract
Objective – To explore the relationships in the United
Kingdom between library expenditures, levels of usage, and research outcomes,
focusing on the provision and use of e-journals.
Methods
– The project used a mixture of top-down and
bottom-up approaches. It involved a close study of the behaviors of researchers
in eight universities and two research institutes across a range of six subject
areas, along with a parallel gathering and analysis of data for all U.K.
universities and colleges, covering various library indicators together with
data on article downloads and a range of measures of research performance. The
work was undertaken in two stages and was completed in 2010. The first stage involved
detailed mining of the publishers’ logs from Elsevier’s Science Direct and from
Oxford Journals to generate fine-grained insights into the information-seeking
behavior of scholars from the case study institutions, together with an initial
analysis of the U.K.-wide data. The second stage involved a survey and
interviews with a wide range of researchers as well as librarians from the case
study institutions, together with further analysis of the U.K.-wide data.
Results
– Strong variations were found between users, not
only in different disciplines but also in different institutions. Some, but not
all, of the variations seemed to be related to the size and research intensity
of the institution. Analyses of the U.K.-wide data show that levels of library
expenditure influence subsequent levels of use of e-journals. While the
modeling does not show strong direct linkages in either direction between
library expenditure and research performance, it does show a strong positive
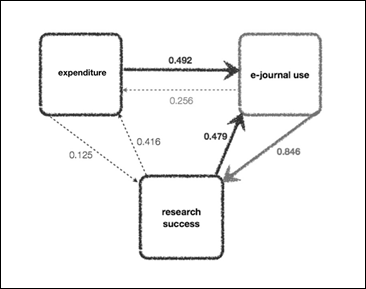
feedback loop between the use of e-journals and research performance.
Conclusion
–
There is a need both to broaden the focus beyond e-journals and for more
detailed work to test hypotheses and understand the dynamics of the
relationships between different variables over time.
Introduction
Expenditure in university and college libraries in
the UK amounted in 2008 to £630 million (Society of College, National and
University Libraries, 2009), a figure that had grown by 30% in real terms over
the previous ten years. Growth in expenditure was even faster – at nearly 48%
– for the libraries of the research-intensive
universities represented by Research Libraries UK (RLUK). Numbers of staff and
students also grew, however, and income and expenditure on research grew even
faster. Hence the proportion of total university expenditure that went to
support libraries fell: from 3.4% to 2.8% across all UK universities; and from
3.2% to 2.6% across the RLUK libraries. So libraries represent a declining
share of university budgets, and they will have to fight hard to avoid further
falls in that share as universities face significant cuts in the income they
receive from public funds.
In that context, it is particularly important that
libraries should be able to show not only that they are operating efficiently,
but that they provide services with demonstrable links to success in achieving
institutional goals. Return on investment is thus an increasingly important
issue. In order to address these issues, libraries need to do more to
understand user behaviour and workflows; and to rigorously analyse and
demonstrate the value of what they do in terms of improving students’
experience, and supporting teaching, learning, and research.
There has been a tendency, in the UK at least, for
performance indicators to focus on inputs and outputs that are relatively
straightforward to measure, as distinct from the much harder issues relating to
impact and value. In current circumstances, however, it is important that more
is done to analyse the relationships between library activities on the one
hand, and learning and research outcomes on the other.
Work of this kind is in its relatively early
stages, and it is fraught with difficulties. Gathering and analysing evidence
of value is notoriously difficult; a number of different approaches have been
adopted, and there is no single answer. A key question is “value for whom?” In
relation to libraries, approaches to gathering evidence of value for students
or academic staff may well differ from approaches to value for funders or for
universities. Similarly, approaches to the value of existing services may not
be appropriate in gathering evidence of possible changes (positive or negative)
either to the nature or to the level of those services. And there are notorious
difficulties in assessing changes in value over time.
This paper focuses on one element in that set of
issues: the provision of information content, particularly e-journals, that
libraries make from within their budgets, and the use that is made of that
content. It reports in particular on the findings of a study commissioned and
overseen by the Research Information Network (RIN), and undertaken by the
Centre for Information Behaviour and the Evaluation of Research (CIBER) at
University College London. The study was undertaken in two stages, and was
completed in 2010.
Project design and methodology
The study started with the aim of providing a
detailed portrait of the information-seeking behaviour of UK researchers, of
how they make use of e-journals and of the benefits that flow from that use.
More detailed objectives were to
·
investigate
researchers’ behaviour, in terms of levels and patterns of usage, content
viewed, navigational preferences, and routes used to access e-journal content
·
ascertain
how researchers’ behaviours vary by subjects and disciplines, and in relation
to the universities and other institutions in which they work
·
gather and
analyse any evidence of relationships between researchers’ behaviours and
usage, and institutional expenditure on e-journals, and
·
gather and analyse any
evidence of relationships between researchers’ behaviours on the one hand and
research productivity, outputs and outcomes on the other, including such measures
as numbers of publications produced, citations attracted, and the results of
research evaluations.
The project used a mixture of top-down and
bottom-up approaches. It thus involved a close study of the behaviours of
researchers in eight universities and two research institutes across a range of
six subject areas; and a parallel gathering and analysis of data for all UK
universities and colleges, covering various library indicators together with
data on article downloads and a range of measures of research performance. The
work was undertaken in two stages. The first stage involved detailed mining of
the publishers’ logs from Elsevier’s Science Direct and from Oxford Journals to
generate fine-grained insights into the information-seeking behaviour of
scholars from the case study institutions, together with an initial analysis of
the U.K.-wide data (Research Information Network, 2009) The second stage
involved a survey and interviews with a wide range of researchers as well as
librarians from the case study institutions, together with further analysis of
the U.K.-wide data (Research Information Network, 2011).
Expenditure and usage of e-journals
Expenditure on information content of all kinds
represents about 35% of all library expenditure across the U.K. university
library sector (Figure 1), and that proportion has been relatively stable over
the past decade. But there are significant differences between individual
libraries – proportions vary between under 30% and over 40% – and
groups of libraries. The proportion tends to be lowest in small colleges and
specialist institutions, and highest in the older universities.
The
relatively stable proportion of expenditure on content implies, of course,
increases in actual expenditure in real terms. But here experiences differ
across the sector. In the research-intensive universities expenditure rose by
52%; but in the newer universities, after rising by 5% in the years up to 2002,
expenditure on content has actually declined in real terms since then, and in 2008
was actually 2% lower than it was in 1998.

Figure
1
Expenditure on information provision as a percentage
of overall library expenditure 1998-2008
The
lion’s share of that expenditure goes to serials, which now account for nearly
20% of total library expenditure across the U.K. higher education (HE) sector.
That marks a significant change over the past ten years. In 1998 books
accounted for just over 12% of library expenditure, and serials just over 15%;
but by 2008 the percentages had diverged rapidly, to 9% and 19% respectively
(Figure 2). In several older universities, serials account for over a quarter
of the total library budget.
Growth
in expenditure on serials has of course been accompanied, as a result of the
adoption of big deals, by a huge increase in the number of titles available
(Figure 3). Overall, the number of titles has increased by over 153% across all
UK university libraries between 1998 and 2008. Within this, there is
considerable variation, both in the rate of change and in the overall number of
titles available. RLUK members, while showing one of the smaller overall
increases at 56%, has a consistently larger number of titles available than any
other group. Other HE colleges, also showing a lower rate of change at 39%,
have noticeably fewer titles available than pre- and post-92 universities.
Nonetheless, the overall story is one of rapid and significant change.
And
the increase in provision has been accompanied by huge increases in usage. Our
estimates of the number of downloads of e-journal articles as reported by
libraries in accordance with the COUNTER protocols are shown in Table 1. They
show an increase of over two and a half times across
the sector as a whole between 2004 and 2008, with even higher rates of growth
among the research-intensive Russell Group of universities.
One
simple approach to value is to ascertain the unit cost per download and its
variation between different institutions or over time. As shown in Table 2,
since the rise in usage has been faster than the rise in expenditure on
serials, the cost per download fell sharply between 2004 and 2008: from £1.19
to £0.70 (thus by 41%) across the sector as a whole, with an even sharper fall
of 62% among the research-intensive Russell Group universities.

Figure
2
Serials expenditure as a percentage of overall
library expenditure 1998-2008
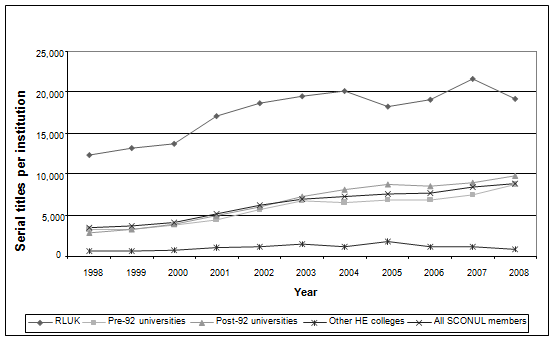
Figure
3
Number
of serial titles per institution 1998-2008
When
levels of usage are put alongside expenditure on e-journals in individual universities
across the UK, again the results are intriguing. They show a very strong
correlation between volumes of downloads and expenditure, with only a few
outliers; as shown in Figure 4, a matrix
scatterplot based on downloads for all downloads (COUNTER (adjusted), Elsevier
ScienceDirect, and Oxford Journals (fitted linear regression trendlines with 95% confidence intervals). Only the plots
for Oxford Journals show a wide scatter, reflecting the relatively small number
of journal titles involved, and their concentration in a relatively small range
of subject areas. Overall, however, our findings seem to indicate that
universities as a whole are spending their money wisely.
Variations
between subjects and institutions
It
is well known that there are significant variations between the usage
behaviours of researchers in different disciplines, as well as in the provision
of information resources and services directed towards them. This is borne out
by the detailed analysis of the usage logs for Science Direct and Oxford
Journals in our case study subjects and institutions. Table 3 shows that
economists differ from both life scientists and physical scientists in the
degree of concentration on a small number of titles, in the numbers of pages
viewed per session, in their use of abstracts, and in their use of external
gateways such as Google or Google Scholar to get to content.
Table
1
Annual
COUNTER Downloads (CIBER Estimates Based on SCONUL)
|
Mean for sector (Huber’s
M-estimator) |
|||||
|
Year |
2004 |
2005 |
2006 |
2007 |
2008 |
|
Russell
Group |
783,870 |
1,377,603 |
1,846,121 |
2,211,245 |
2,795,825 |
|
Pre-1992
Institutions |
439,813 |
632,144 |
655,926 |
819,335 |
1,001,521 |
|
Post-1992
Institutions |
283,760 |
332,251 |
443,027 |
521,350 |
592,253 |
|
Total |
432,693 |
632,758 |
772,600 |
930,415 |
1,134,165 |
|
|
Index 2004=100 |
||||
|
Year |
2004 |
2005 |
2006 |
2007 |
2008 |
|
Russell
Group |
100 |
175.7 |
235.5 |
282.1 |
356.7 |
|
Pre-1992
Institutions |
100 |
143.7 |
151.4 |
186.3 |
227.7 |
|
Post-1992
Institutions |
100 |
117.1 |
156.1 |
183.7 |
208.7 |
|
Total |
100 |
146.2 |
178.6 |
215.0 |
262.1 |
Table
2
Direct
Cost Per Download at Constant Prices (SCONUL/COUNTER/CIBER Estimates)
|
Mean for sector (Huber’s
M-estimator) |
Index 2004=100 |
|||||||||
|
Year |
2004 |
2005 |
2006 |
2007 |
2008 |
2004 |
2005 |
2006 |
2007 |
2008 |
|
Russell
Group |
£1.73 |
£0.99 |
£0.82 |
£0.74 |
£0.66 |
100
|
57.2 |
47.4 |
42.8 |
38.2 |
|
Pre-1992
Institutions |
£1.20 |
£0.96 |
£0.98 |
£0.91 |
£0.81 |
100 |
80.0 |
81.7 |
75.8 |
67.5 |
|
Post-1992
Institutions |
£1.01 |
£0.85 |
£0.73 |
£0.68 |
£0.65 |
100 |
84.2 |
72.3 |
67.3 |
64.4 |
|
Total |
£1.19 |
£0.91 |
£0.83 |
£0.77 |
£0.70 |
100 |
76.5 |
69.7 |
64.7 |
58.8 |
But
there are significant variations also between different areas of the sciences.
In physics and chemistry, for example, there are big differences in the degree of
concentration on specific journal titles. The total number of titles viewed was
broadly similar in the two disciplines; but the most popular 5% of titles
accounted for 39.5% of use in chemistry, as compared with 26.6% in physics.

Figure
4
UK higher education libraries expenditure and usage
of e-journals
Table
3
Information-Seeking
Behaviour - Readers in Different Subjects Behave Differently
|
|
Journal titles viewed |
Most popular 5% of
journals accounted for % use |
Page views (average
per session) |
Abstract views (%
sessions) |
Gateways (% page
views arriving via gateways) |
|
Chemistry |
196 |
39.5 |
3.2 |
23.3 |
49.2 |
|
Environmental
Sciences |
248 |
29.6 |
3.6 |
22.7 |
41.4 |
|
Economics |
132 |
46.9 |
3.8 |
30.4 |
19 |
|
Life sciences |
531 |
38.1 |
2.0 |
19.5 |
65.9 |
|
Physics |
204 |
26.6 |
2.5 |
20.1 |
57.8 |
There
are similar variations as to the average number of page views per session. It is
not obvious, for example, why environmental scientists should view nearly twice
as many pages during a session as life scientists do, though it may be related
to the latter’s much higher usage of external gateways, including services such
as PubMed. There is more consistency with regard to the use of abstracts: only
economists stand out as using them much more than scientists do.
Perhaps
more intriguing are the variations between users in the same discipline at different
institutions. Our analysis shows, for example, significant variations in
intensity of usage at our case study institutions. The following two charts
compare usage (in this case numbers of page views in the subject area concerned
as shown in the Science Direct logs) with the size of the institution in two
subject areas. The measure of size is the number of staff submitted to the 2008
Research Assessment Exercise (RAE), the exercise that has been undertaken
roughly every five years in the UK since 1986, to assess the quality of
research in each university in the UK. The number of staff submitted to the RAE
provides only a rough indication of size, since it does not take account of
numbers of research students or of staff (such as research assistants) who were
ineligible or who were not chosen for submission by their institution.
Nevertheless, it provides a reasonable indication of the weight of research
effort in each institution. In each of the graphs, the data are indexed to the
institution with the largest number of research-active staff in the subject
area.
What
is intriguing here is that intensity of use does not appear to be closely
correlated with size or with the quality of the research that is undertaken at
the universities concerned. In physics, for example, the quality ratings
achieved in the 2008 RAE by Cambridge, Edinburgh, Manchester, and University
College London were fairly similar. The striking variation – by a factor of four – in the ratios between levels of use
and of size at Edinburgh and UCL on the one hand, and Manchester on the other,
is not explained simply by either the volume or the quality of the research
being produced at those institutions. There are similar variations, by as much
as a factor of six, in the age of the articles that are viewed in different
subjects and institutions; and again these do not seem to be related to levels
or quality of research performance at individual institutions.
Variations
in the titles viewed at different institutions seem to show, however, a more
understandable pattern. Table 4 shows the average impact factor of the journals
viewed at the case study institutions. Since impact factors vary considerably
between disciplines, we have sought to normalise for the range of disciplines
at each institution, by calculating a “relative impact” factor, which matches
each journal viewed against the average for that discipline. Thus a value of 1
means that the journals viewed at that institution are typical—in terms of
their citation impact—of the journals for that range of disciplines as a whole,
worldwide. A value greater than 1 means that users at that institution are
viewing articles in journals with an impact factor higher than the average in
that range of disciplines. What is notable here is that users
at the most research-intensive universities (Cambridge, Edinburgh, Manchester
and UCL) are using journals that are more heavily cited than the global average
in their disciplines. Users at other institutions, including the two
Government-funded research institutes (the Centre for Ecology and Hydrology and
the Rothamsted agricultural research institute) tend
to use journals where the impact factor clusters around the average.


Figure
5
Usage
comparison – size of institution in two subject areas
Such
variations may well be related to differences in how users in different
institutions get to content. Users at the more research-intensive universities
tend to make more use of gateways such as Google Scholar and PubMed, and then
to spend less time on a journal site than their colleagues in other
institutions. Figure 6 shows the average session length in Science Direct for
users at each of our case study institutions in the life sciences, mapped
against the research rating of the authors at each institution as measured by
the Hirsch index. The percentages indicate how many Science Direct sessions
originated from an external gateway service, and the diameter of the circles is
scaled to that value.
We
can also derive similar patterns when we look at usage of navigation facilities
within the Science Direct platform, with users at the less-research-intensive
institutions making much more use of menus and search facilities, especially
citation search. They also make more use of value-added services such as
alerts, and articles in press.
The
conclusions from this part of our work are that there are strong variations
between users not only in different disciplines but also in different institutions, and that some – but
not all – of the variations seem to be related
to the size and research-intensity of the institution. Such variations also
raise questions, of course, about the utility and value of some of the services
provided by libraries and publishers, particularly when services such as
advanced search are used only infrequently. One conclusion from our findings is
thus the familiar one that one size does not fit all. It is already well
understood that researchers in different disciplines behave differently and
have different needs. What has perhaps been less well covered in the literature
has been the differences in behaviours, and presumably needs, between users in
different institutions.
Relationships
between usage and value
We
have already noted that there are close relationships between expenditure on
and usage of e-journals; and those relationships remain strong even when we control
statistically for institutional size. Trying to assess the impact or value of
usage is more difficult. For the linkages between use of information resources
provided by libraries on the one hand, and research or learning outcomes on the
other are difficult to pin down, and chains of reasoning may raise as many
questions as they seek to answer. One approach is to try to calculate the
return on investment (ROI) for individual libraries. Recent studies (Tenopir, King, Mays, Wu, and Baer, 2010) suggest that the
ROI varies from between 15.5: 1 to under 0.64:1 (i.e., a negative return),
depending on such factors as the balance between teaching and research, and the
subject mix, at each university.
Table
4
Average
Impact Factor of the Journals Viewed at the Case Study Institutions
|
Case study |
Average impact factor of journals viewed |
Relative impact |
|
Aberdeen |
3.0 |
1.2 |
|
Bangor |
2.3 |
0.9 |
|
Cambridge |
5.0 |
2.0 |
|
Centre for Ecology and Hydrology |
2.6 |
1.0 |
|
Edinburgh |
3.7 |
1.5 |
|
Manchester |
3.9 |
1.6 |
|
Rothamsted |
2.6 |
1.0 |
|
Strathclyde |
2.7 |
1.1 |
|
Swansea |
2.5 |
1.0 |
|
UCL |
4.1 |
1.7 |
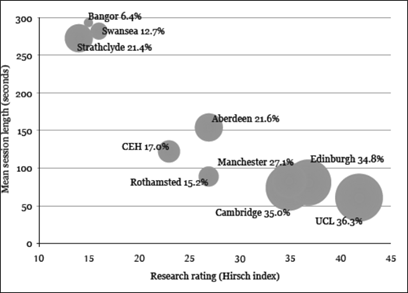
Figure
6
Session length and gateways
We
have taken a rather different approach, seeking to investigate the relationships
between levels of usage on the one hand, and a range of measures of research
activity on the other. We first of all identified from our analysis of the data
across the UK sector three groups of universities in terms of the volume of
downloads: moderate, high and super users. In Table 5, we match these groups
with various measures of research activity as well as a calculation of cost per
download.
These
figures suggest that there might be a relationship between e-journal usage and research
performance: the differences in performance between the groups are
statistically significant, although differences in cost per download are much
less so.
We
then moved to a more detailed mapping of article downloads in individual
universities plotted against similar measures of research performance, as
shown, for example, in Figure 7.
Table 5
Usage groups and research outcome measures
|
|
Moderate users (n=80) |
High users (n=25) |
Super users (n=10) |
|
Research papers per
academic |
0.4 |
0.8 |
1.0 |
|
Research grants and
contracts per academic (£000’s) |
12.7 |
29.0 |
39.7 |
|
PhD awards per 100
academics |
9.1 |
17.5 |
17.4 |
|
Cost per download |
£0.89 |
£0.74 |
£0.60 |