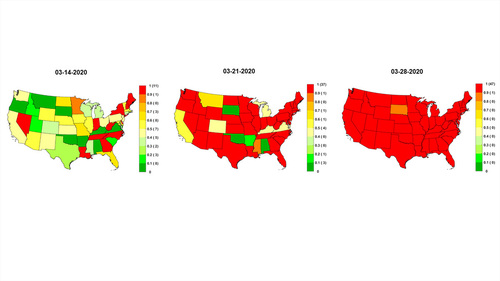
The spread of COVID-19 was rapid and relentless, and so were its effects on economies worldwide. Knowing how state economies withstand economic shocks in near-real time can be beneficial for policymakers who have the power to enact strategies to counteract the negative impact. University of Notre Dame researchers developed the first near-real-time dashboard that tracks weekly state-level economic conditions.
Their study, “Tracking Weekly State-Level Economic Conditions,” was published as a working paper by the National Bureau of Economic Research. Data in the dashboard are available dating back to 1987, allowing for a historical perspective, so academics and policymakers can see a new level of detail at key times such as the 1987 Black Monday stock market crash or the Great Recession.
Data are broken down into six categories that cover economic sectors from mobility (e.g., cellphones, gas prices) to labor (e.g., unemployment rates) to household spending (e.g., credit/debit card charges). This level of detail available weekly will allow policymakers to view how specific sectors in state economies are faring and, ideally, will permit detection of trends and economic shocks in time for appropriate policy responses.
“This project was motivated by what was happening with COVID-19,” said Christiane Baumeister, the Robert and Irene Bozzone Professor and Associate Chair of the Department of Economics and lead author. “We had never before experienced such a rapid deterioration of economic conditions, which brought to the fore the need for reliable measures of economic activity at high frequencies.”
Before they developed their dashboard, there was no available tool that allowed users to drill down into specific economic sectors measured weekly, illuminating which sectors were weak or strong in individual states at a given time.
“I think one important insight from our study is the level of heterogeneity in business cycles at a disaggregated level,” said Eric Sims, the Michael P. Grace II Collegiate Chair of Economics and co-author. “The Great Recession didn’t look the same everywhere. In contrast, regarding the pandemic, it is remarkable how very much the same everything was across states.”
Sims noted that state and national policy responses differ and that the researchers’ dashboard is a novel way to measure the efficacy of policy interventions.
“Policymakers can use the state-level economic conditions indices to assess the current situation in each state to devise targeted policy measures, and they can also track how state and federal policies affect the state at hand — so information is flowing both ways,” Baumeister added. “This is also helpful for better understanding how the economy works at the national level. On a state-by-state basis, we also compute the probability that states are in recession. The more states that are in recession, the more likely that there will be a national recession. We then determine the share of the economy in recession and turn this into an aggregate index of economic weakness. Our economic weakness index identifies the beginning of aggregate recessions in a more timely fashion than does the National Bureau of Economic Research Business Cycle Dating Committee.”
As another illustration of the usefulness of their state-level indexes, the researchers examined how a particular part of federal COVID-19 relief — the Paycheck Protection Program — impacted state economies. Using cross-state variation in loan amounts and volumes, the research team compared states receiving more PPP loans to states receiving fewer. They found that the disbursement of PPP loans triggered a very quick, positive response of state-level economic conditions.
“PPP effects on growth wore off in weeks, but the cumulative effects of the stimulus bolstered economic conditions for about three months,” Sims said. “You wouldn’t be able to detect this effect looking at quarterly numbers. The ability to track conditions at a weekly frequency is critical here.”
One of Baumeister’s areas of expertise is the oil and gas industry, so she used the dashboard to examine the economic differences in oil states versus states without those resources during the 2014-2016 oil price decline.
“We see very clearly that several states that are heavily reliant on oil industries were in contraction, while other oil-producing states were more resilient during this low oil price environment,” she said. “We found that non-oil states were performing very well during this episode and were counterbalancing what was happening in oil states. Thus, we can clearly pinpoint where weaknesses are.”
She will continue to research to see if negative economic shocks in oil states will spill over into neighboring states. “So, one of the possible applications is to look at shocks like an oil price shock and learn how important an industry is to a specific state. It could be an early warning system for recession detection in near-real time.”
Danilo Leiva-León from the Bank of Spain is also a co-author on the NBER working paper.

